skip navigation
Blog

Stay up to date on timely topics and market events. Subscribe to our Blog now.

MARKETS
April 09, 2024

Weekly Municipal Monitor—Bye-Bye, BABs?

By Robert E. Amodeo, CFA, Joseph Genco

Stay up to date on timely topics and market events. Subscribe to our Blog now.

Municipals Posted Negative Returns Last Week

Munis posted negative returns last week and underperformed Treasuries, which moved higher on stronger than expected payroll data. High-grade muni yields moved higher across the yield curve and market technicals improved on muni fund inflows and lower supply. The Bloomberg Municipal Index returned -0.65% during the week, the High Yield Muni Index returned - 0.83% and the Taxable Muni Index returned -1.52%. This week we highlight the increasing call activity associated with taxable Build America Bonds (BABs).

Fund Inflows and Lower Supply Conditions Provided Technical Support

Fund Flows: During the week ending April 3, weekly reporting municipal mutual funds recorded $80 million of net inflows, according to Lipper. Long-term funds recorded $161 million of inflows, intermediate funds recorded $32 million of inflows and high-yield funds recorded $161 million of inflows. Short-term funds recorded $21 million of outflows. This week’s inflows lead estimated year-to-date (YTD) net inflows higher to $9.9 billion.

Supply: The muni market recorded $6 billion of new-issue volume last week, down 40% from the prior week. YTD issuance of $106 billion is 41% higher than last year’s level, with tax-exempt issuance 56% higher and taxable issuance 49% lower year-over-year. Tax-exempt issuance has comprised 95% of issuance YTD. This week’s calendar is expected to pick up to $8 billion. Largest deals include $711 million Harvard University and $610 million Cornell University transactions.

This Week in Munis: State and Local Revenues Improve

Taxable Build America Bonds (BABs) were established as part of the 2009 American Recovery and Reinvestment Act. Under the BABs program, municipal issuers could receive a federal subsidy of up to 35% of the interest payments from taxable muni bonds issued to fund infrastructure initiatives. The effort was successful in expanding the municipal buyer base to a global scale, more than $180 billion of BABs were issued in 2009 and 2010, and BABs have since comprised a significant share of the overall taxable municipal market.

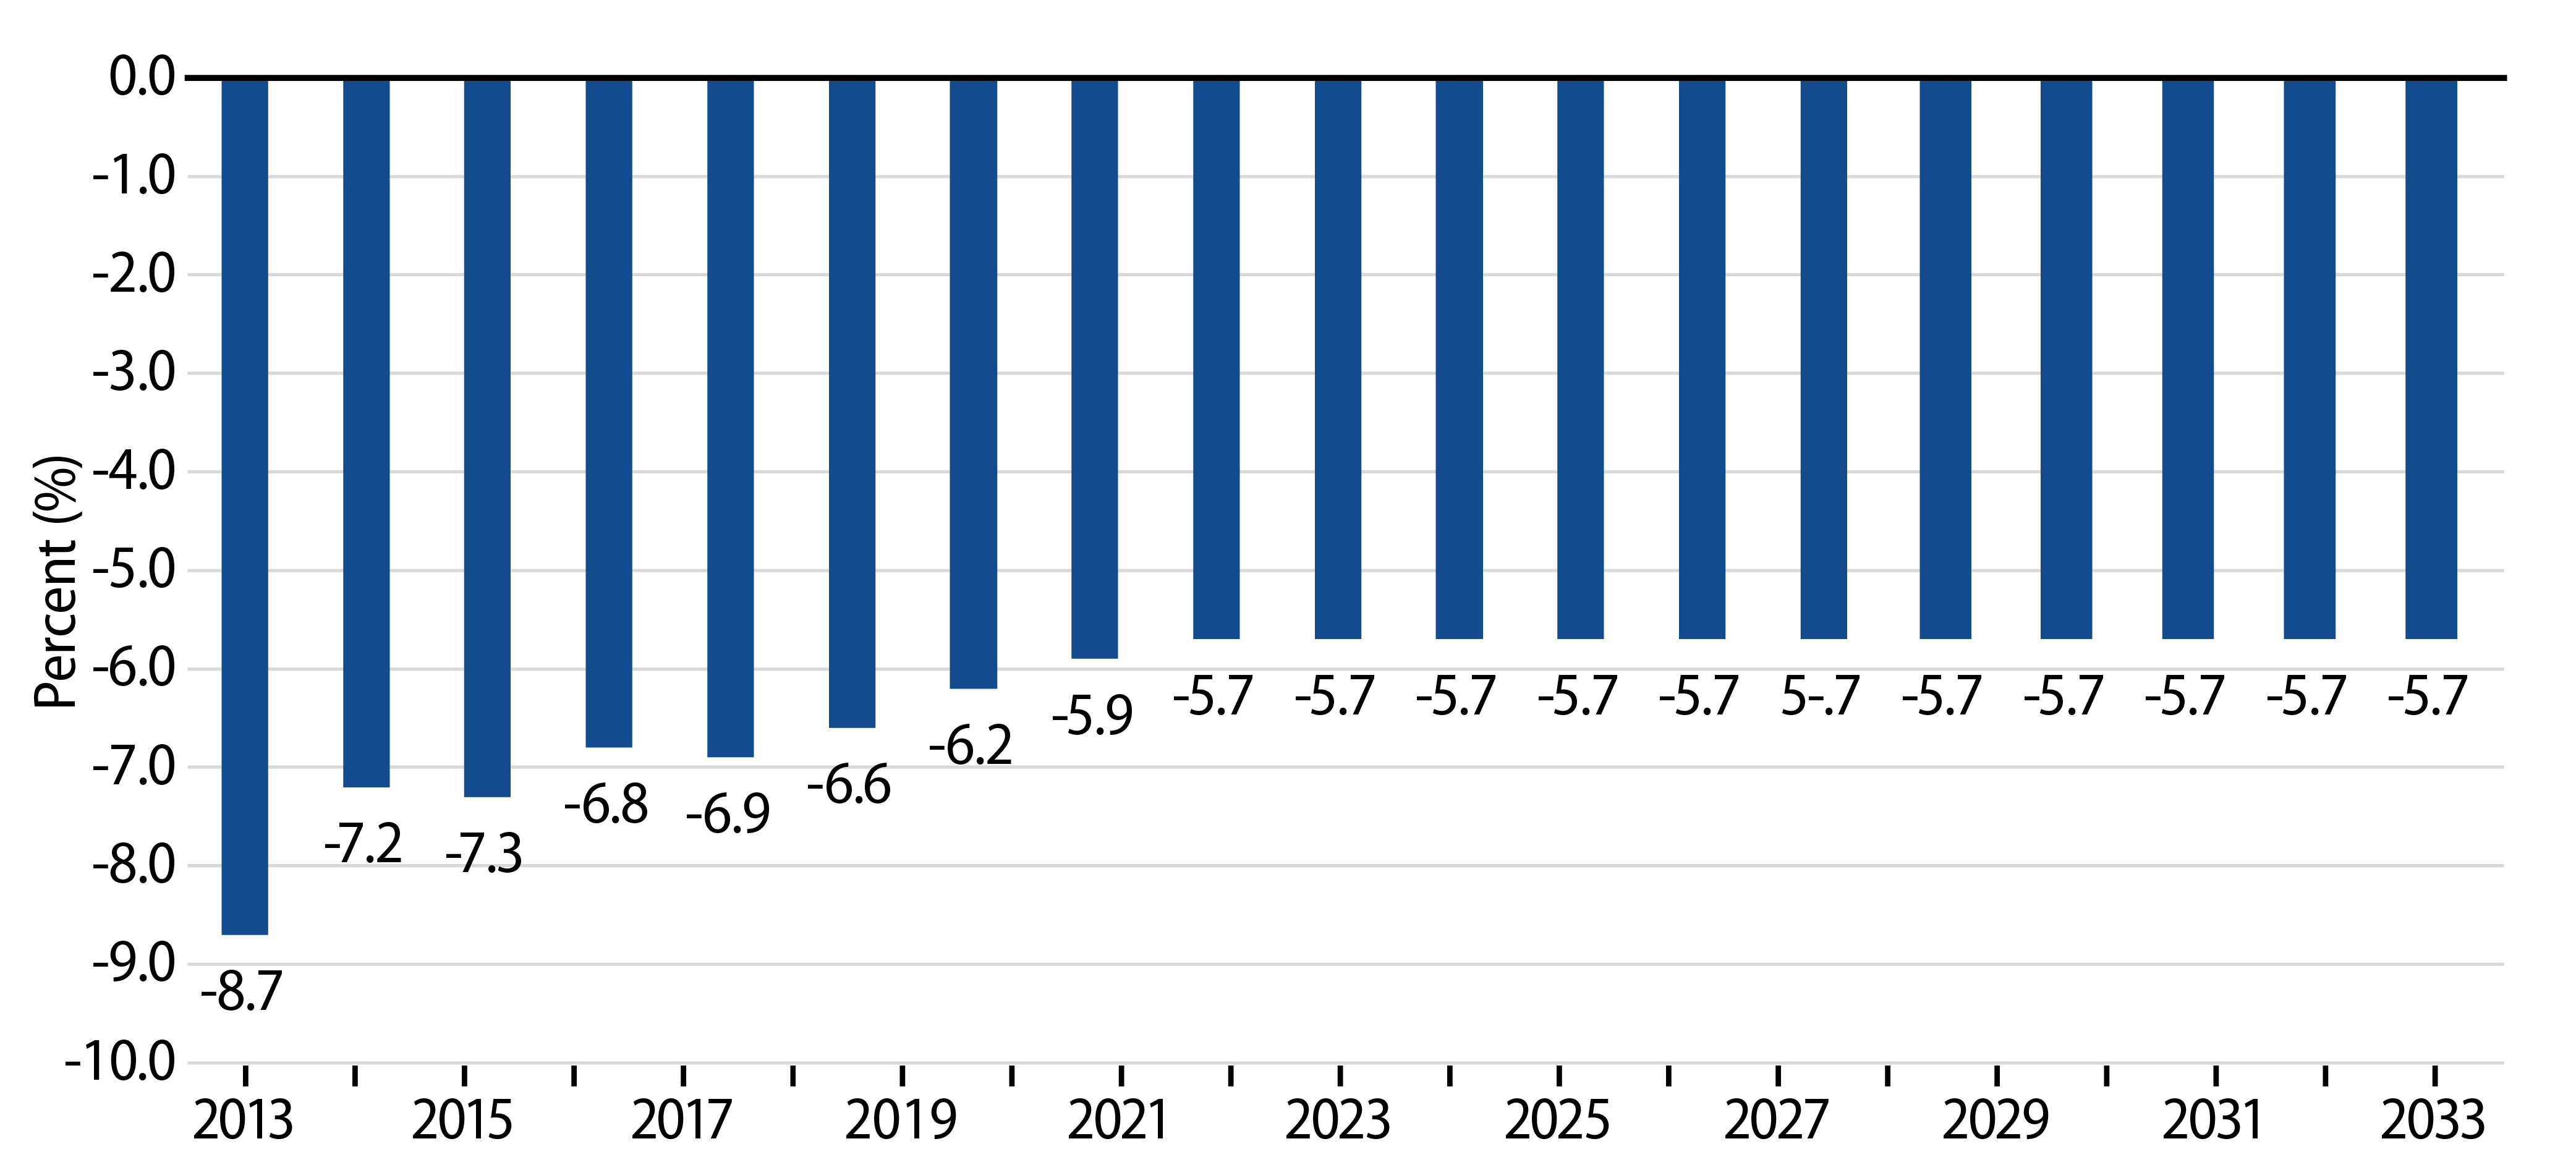
This year, we have seen an increase in the number of BABs being called under Extraordinary Redemption Provisions (ERPs), specifically citing a reduction of the federal subsidy as rationale for issuers to call outstanding municipal debt. As a result of federal sequestration measures, the federal subsidy reductions have ranged from 8.7% to 5.7% annually over the past decade.

Exhibit 1: Annual BAB Subsidy Reductions
Annual BAB Subsidy Reductions
Source: IRS. As of 25 May 23. Select the image to expand the view.

These subsidy reductions have deteriorated issuer economics of keeping the taxable debt outstanding versus tax-exempt funding alternatives. This dynamic has been exacerbated recently by high quality tax-exempt issuance trading at near record-low Muni/Taxable ratios. As municipal fundamentals improved over the past few years, more issuers were upgraded to higher quality cohorts, supporting the ability to capitalize on the cost savings offered in the high quality tax-exempt municipal market.

Exhibit 2: 10Y AAA Muni YTW—10Y Treasury YTW (After the Effective Subsidy Rate)
10Y AAA Muni YTW—10Y Treasury YTW (After the Effective Subsidy Rate)
Source: Western Asset, Thomson Reuters, Bloomberg. Yield-to-worst (YTW) is the lowest potential yield that can be received on a bond without the issuer actually defaulting. As of 05 Apr 24. Select the image to expand the view.

While more economical than ever to call outstanding BABs, we believe that ERP call activity could remain limited. First, attractive tax-exempt relative valuations are more contained to the highest quality AAA cohort, as AA and A rated bonds’ tax-exempt relative value is less compelling for issuers. Second, fixed costs associated with new issuance could overwhelm the positive refinancing benefits, particularly for smaller deals outstanding. Last, we believe issuers could question whether the sequestration of BABs subsidies qualify as an ERP event, and may ultimately determine that costs associated with legal challenges could outweigh positive economics associated with the refinancing.

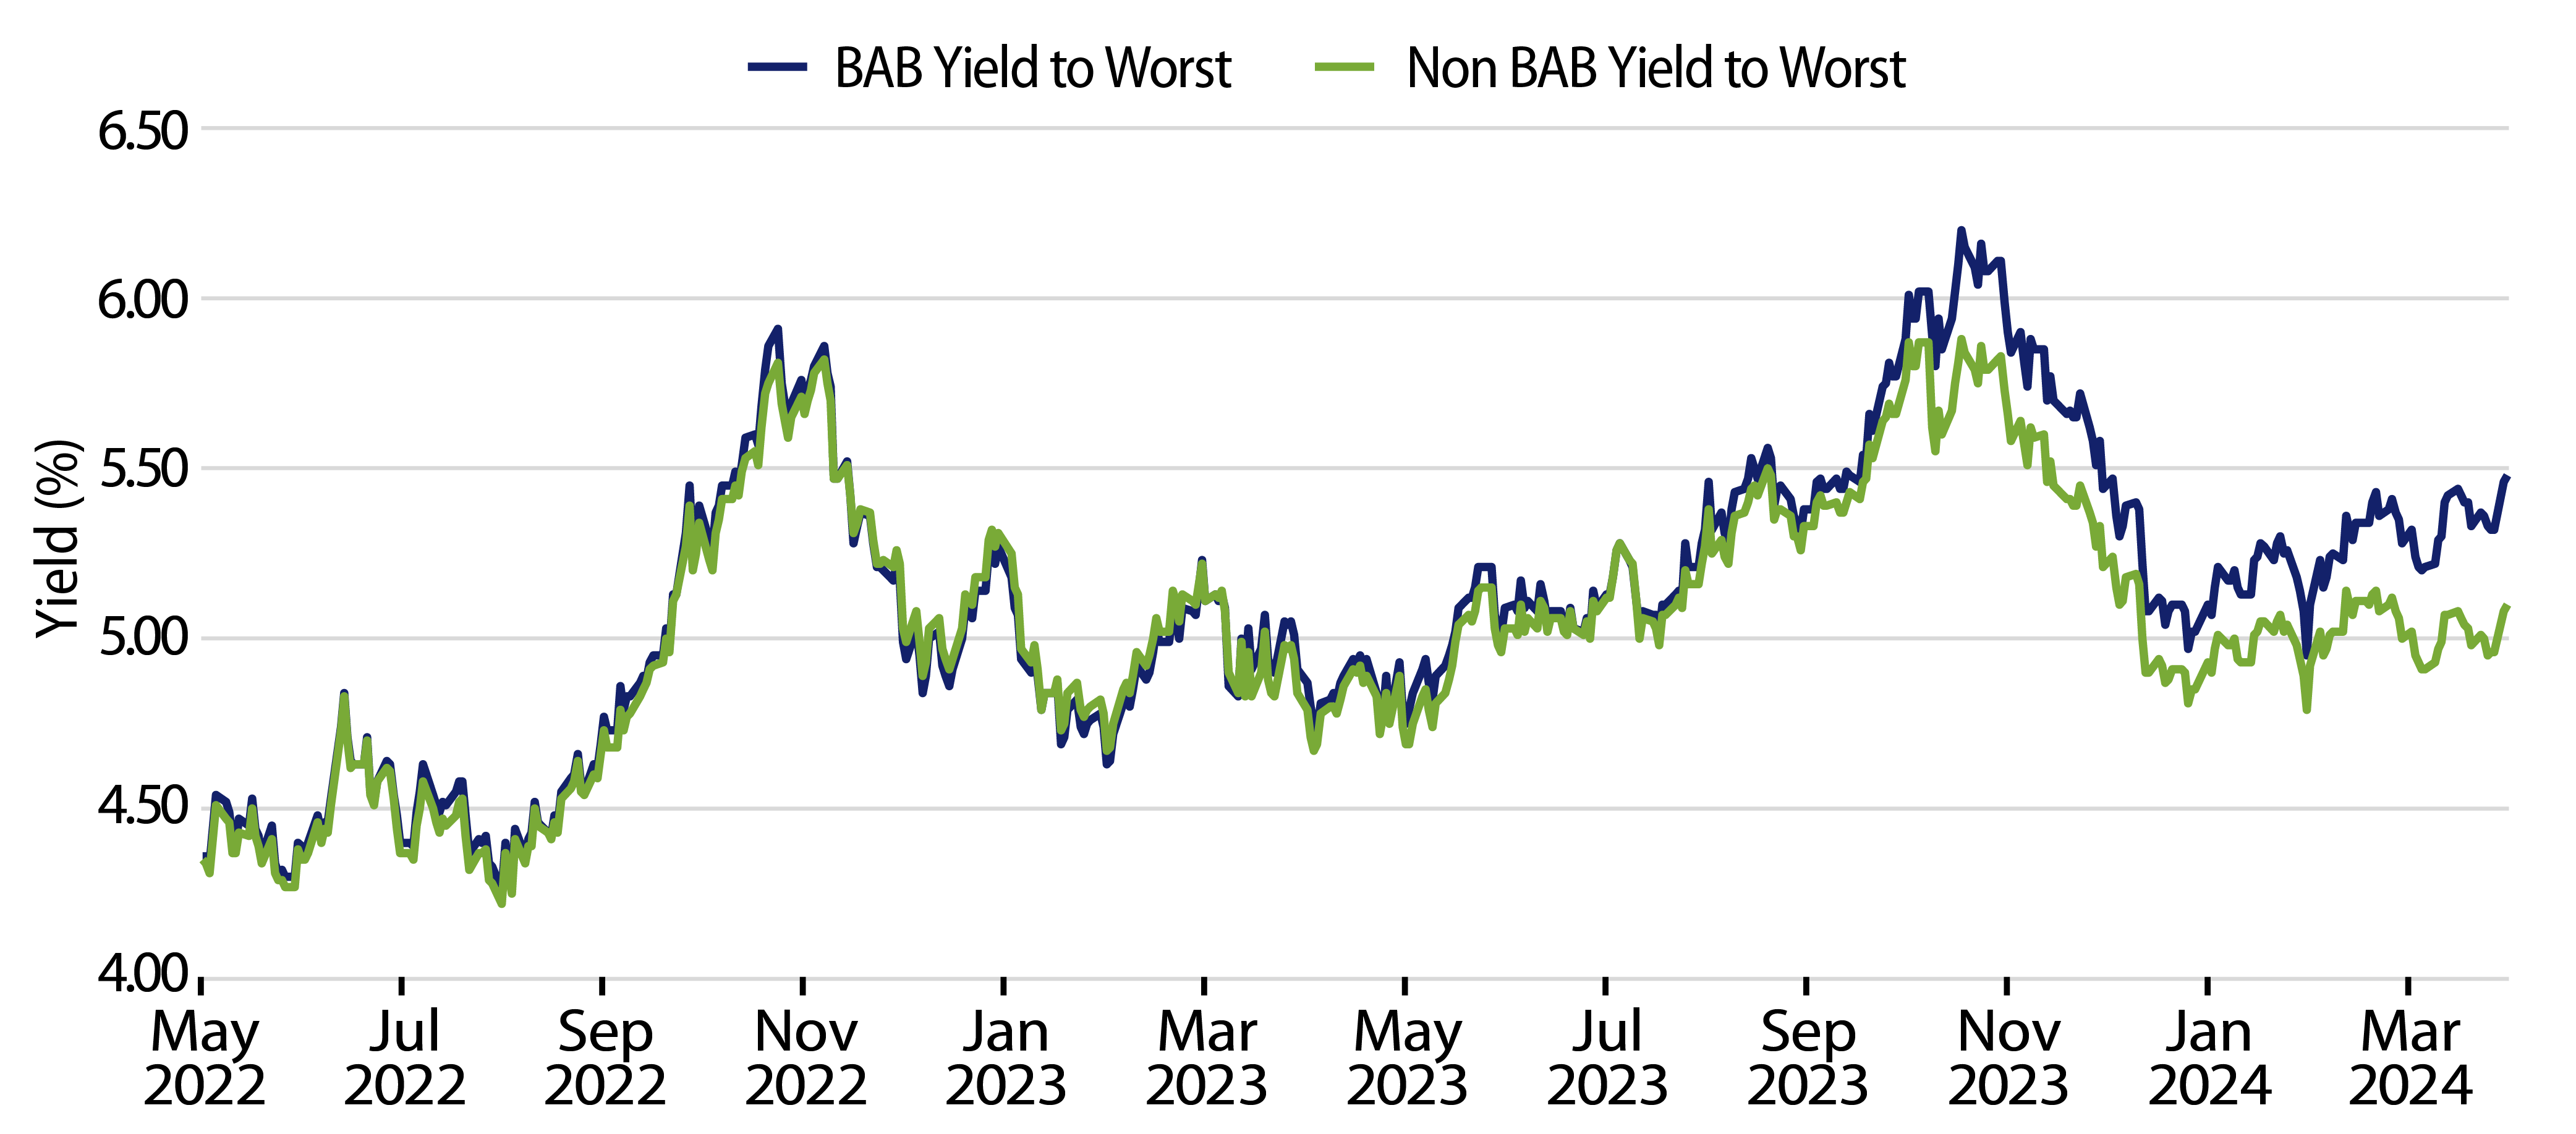
Since the call risk increased in earnest this year, BABs have since traded at higher relative yields versus non-BAB taxable muni counterparts (Exhibit 3), representing potential value for investors willing to weigh the call risk associated with these issues. For tax-exempt muni investors, higher refunding volumes in the market should be welcomed, given the recent positive demand that has led relative valuations richer in the higher quality segment of the market. Such an increase in tax-exempt refunding issuance may also prove a self-correcting catalyst as higher supply levels could contribute to higher tax-exempt yields, and deteriorate the favorable call economics that currently exist.

Exhibit 3: BAB vs. Non-BAB YTW
BAB vs. Non-BAB YTW
Source: Bloomberg. As of 04 Apr 24. Yield-to-worst (YTW) is the lowest potential yield that can be received on a bond without the issuer actually defaulting. Select the image to expand the view.

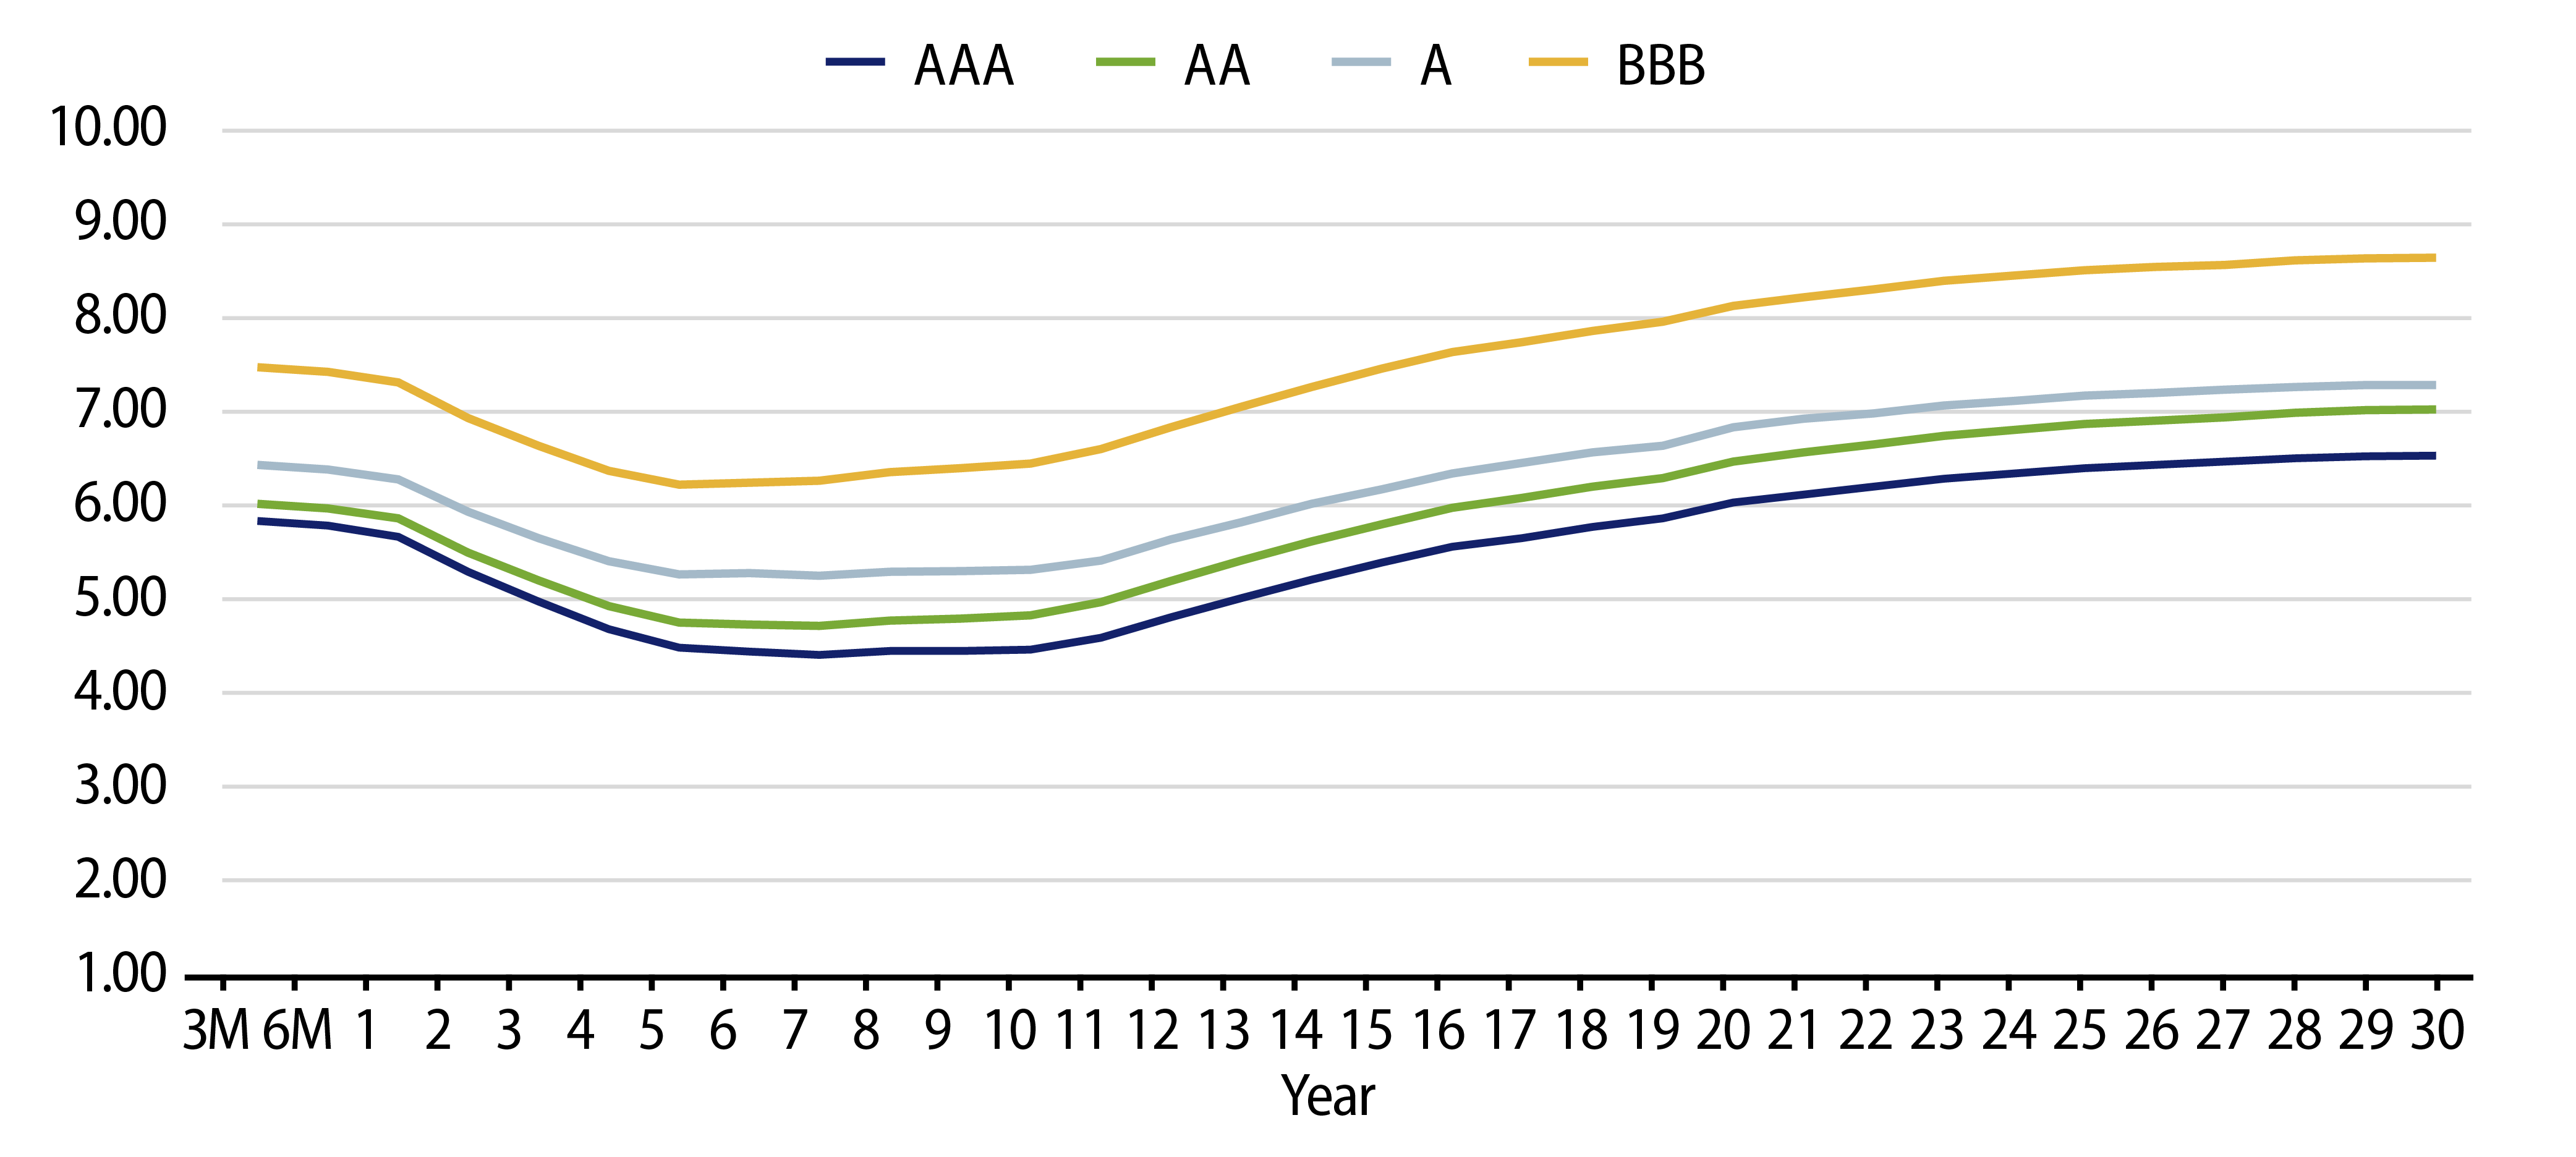
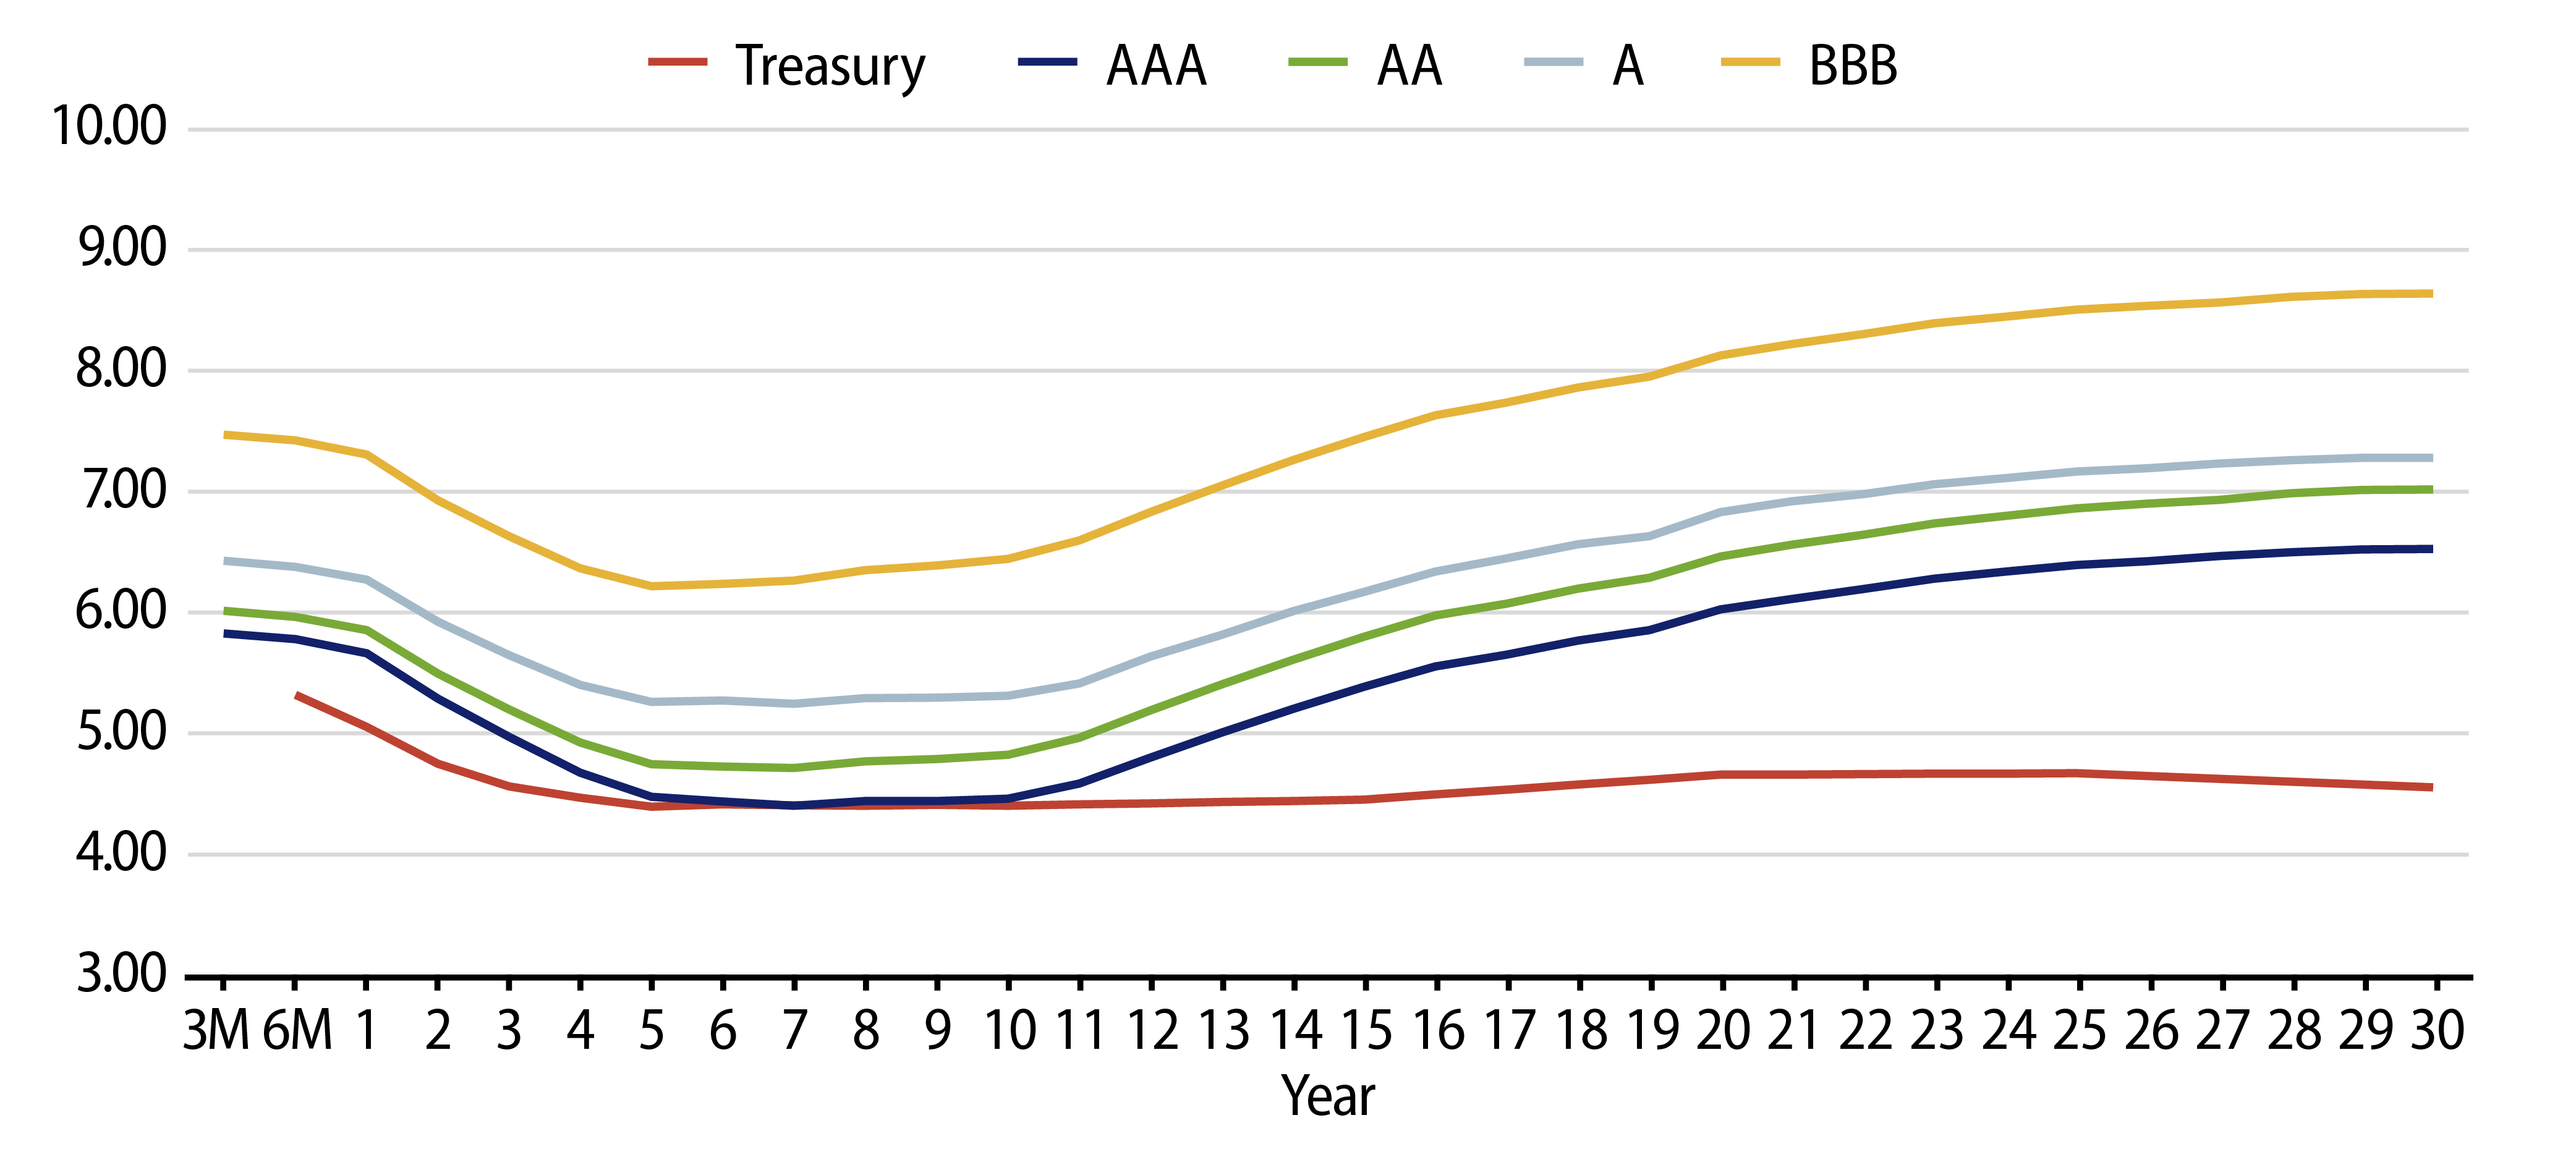
Municipal Credit Curves and Relative Value

Exhibit 4: Muni Credit Curves
Muni Credit Curves
Source: Bloomberg, Western Asset. As of 05 Apr 24. Bloomberg BVAL Municipal Credit Indices (AAA, AA, A, BBB, respectively) and US Sovereign Curves. Taxable-Equivalent Muni Credit Curves consider the top marginal effective tax rate of 40.8%. Select the image to expand the view.
Exhibit 5: Taxable-Equivalent Muni Credit Curves
Taxable-Equivalent Muni Credit Curves
Source: Bloomberg, Western Asset. As of 05 Apr 24. Bloomberg BVAL Municipal Credit Indices (AAA, AA, A, BBB, respectively) and US Sovereign Curves. Taxable-Equivalent Muni Credit Curves consider the top marginal effective tax rate of 40.8%. Select the image to expand the view.
Exhibit 6: AAA Munis versus Treasuries
AAA Munis versus Treasuries
Source: Muni Yields: Thomson Reuters MMD, Treasury Yields: Bloomberg. As of 05 Apr 24. Past performance is not a guarantee of future results. It is not possible to invest directly in an Index. Select the image to expand the view.
Exhibit 7: Tax-Exempt and Taxable Muni Valuations
Tax-Exempt and Taxable Muni Valuations
Source: Bloomberg. Yield-to-worst (YTW) is the lowest potential yield that can be received on a bond without the issuer actually defaulting. As of 05 Apr 24. Select the image to expand the view.

Western Asset Key Themes for Muni Investors

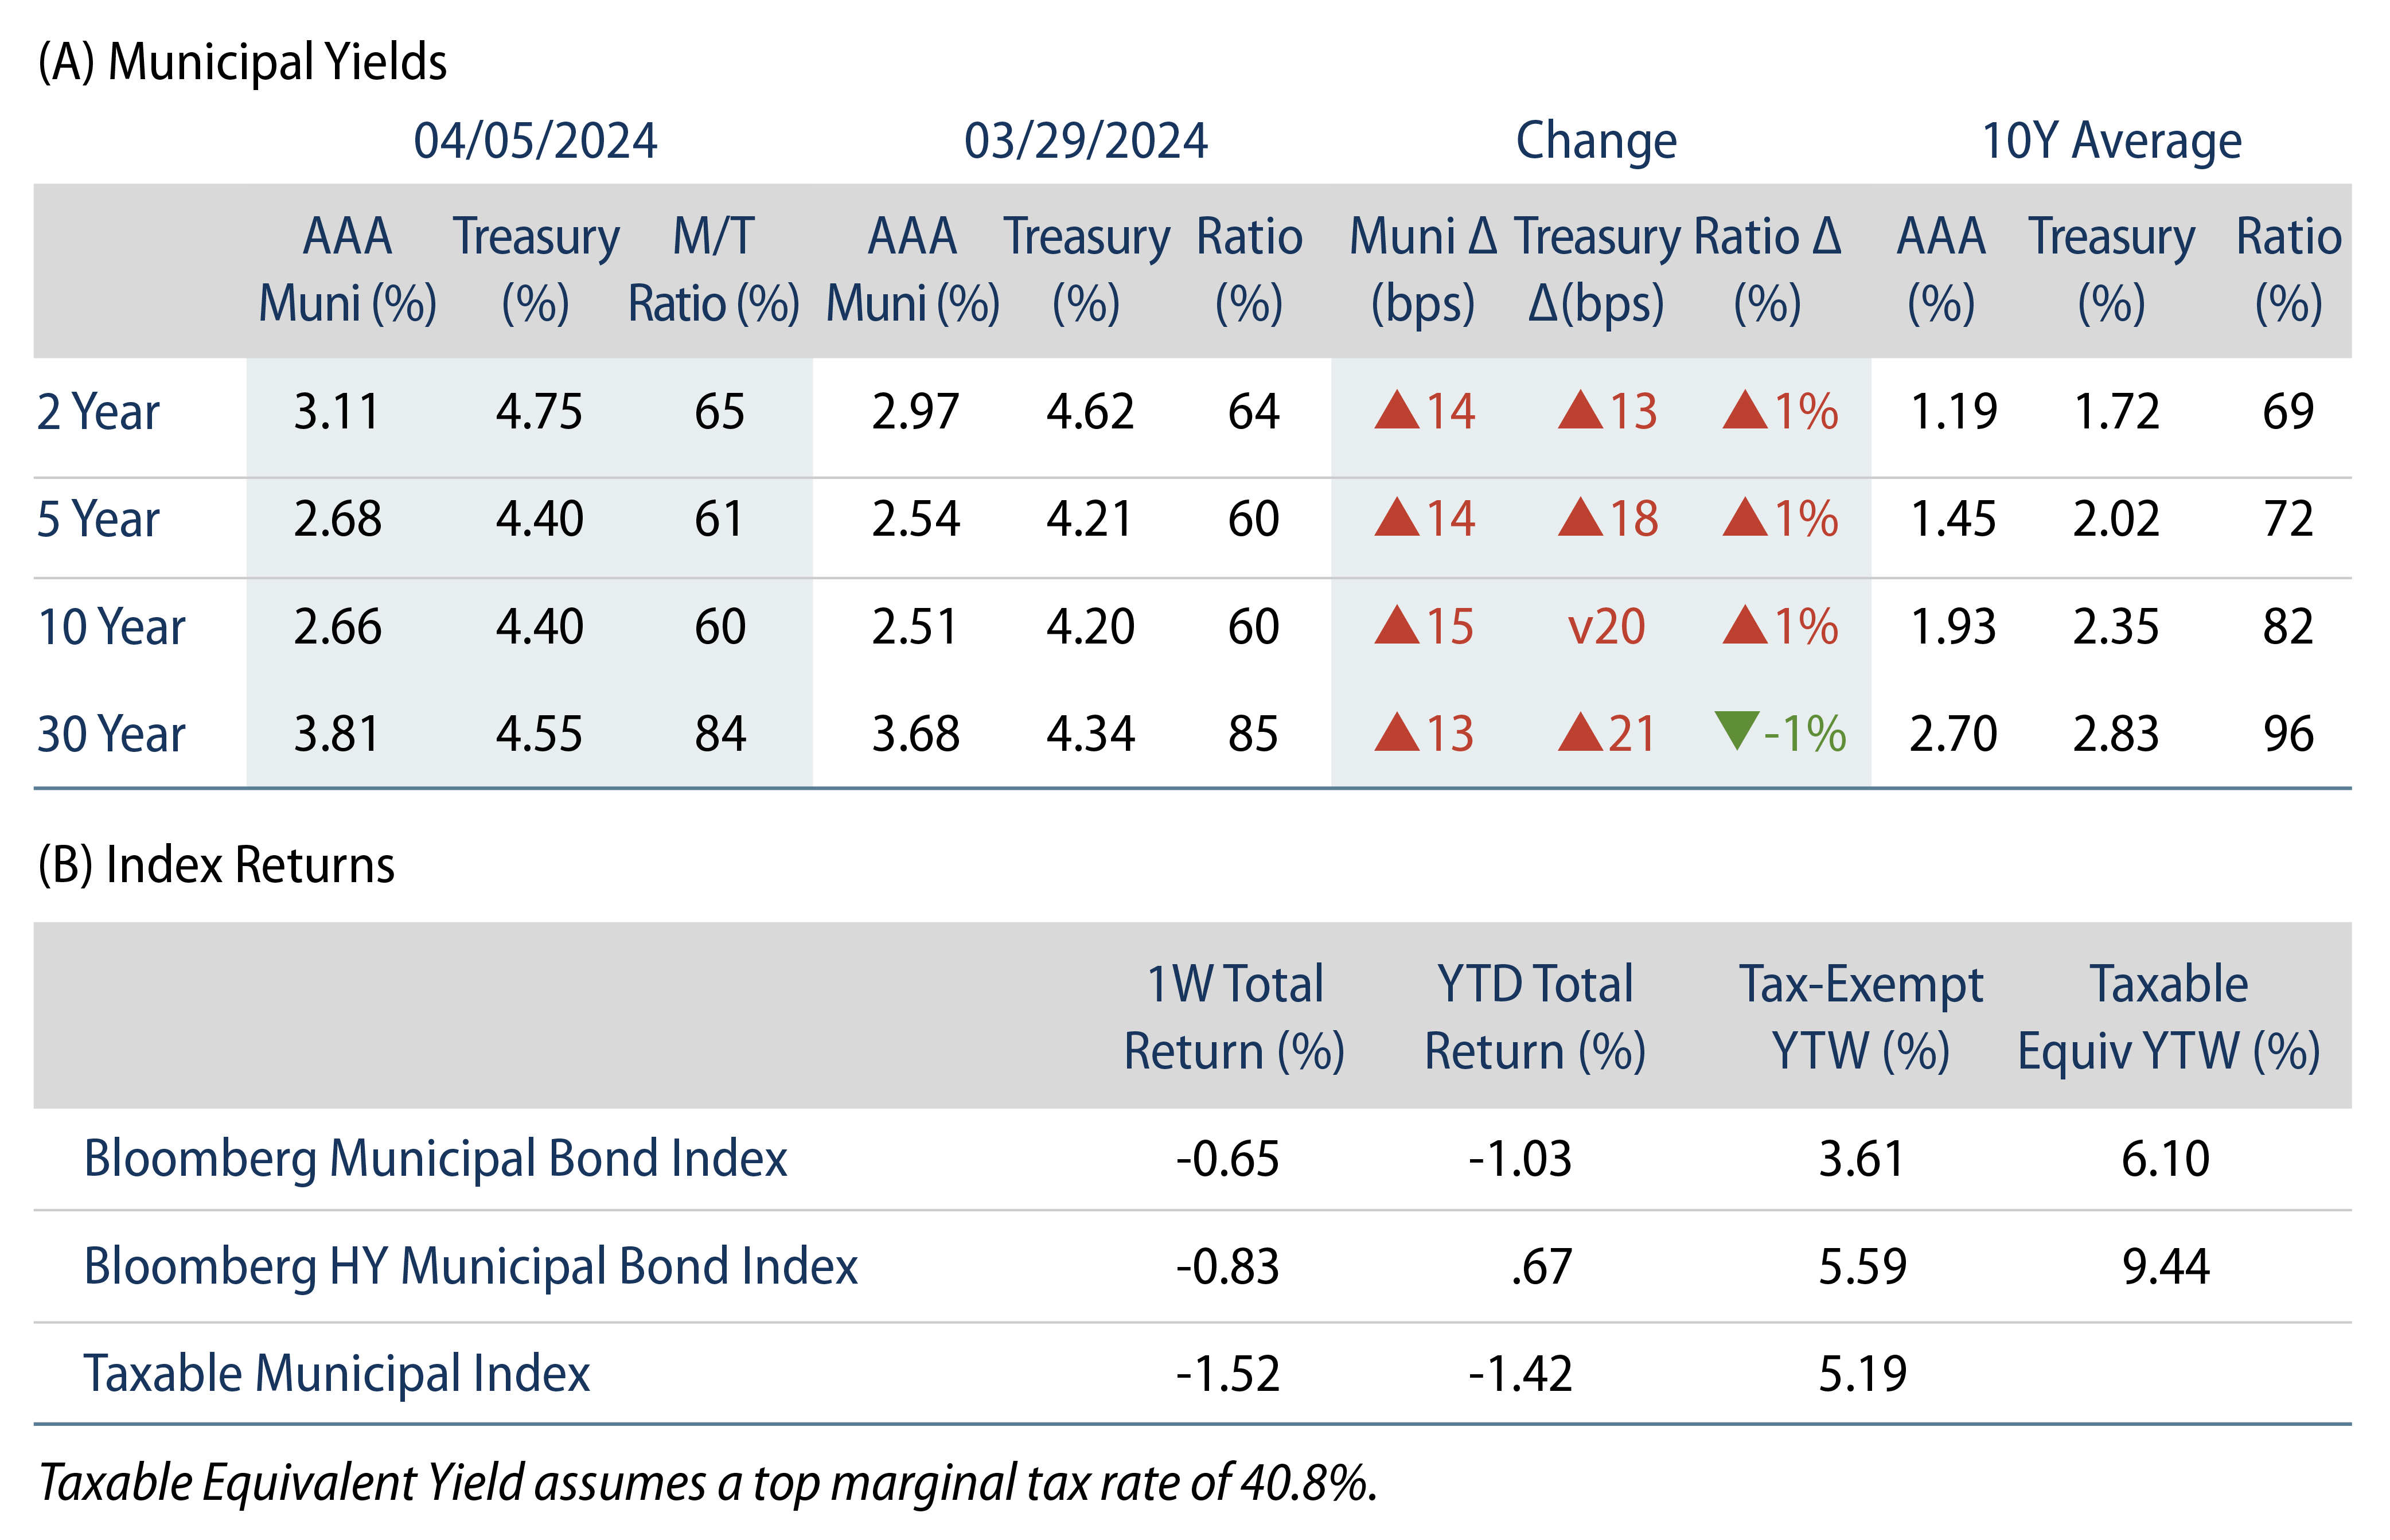
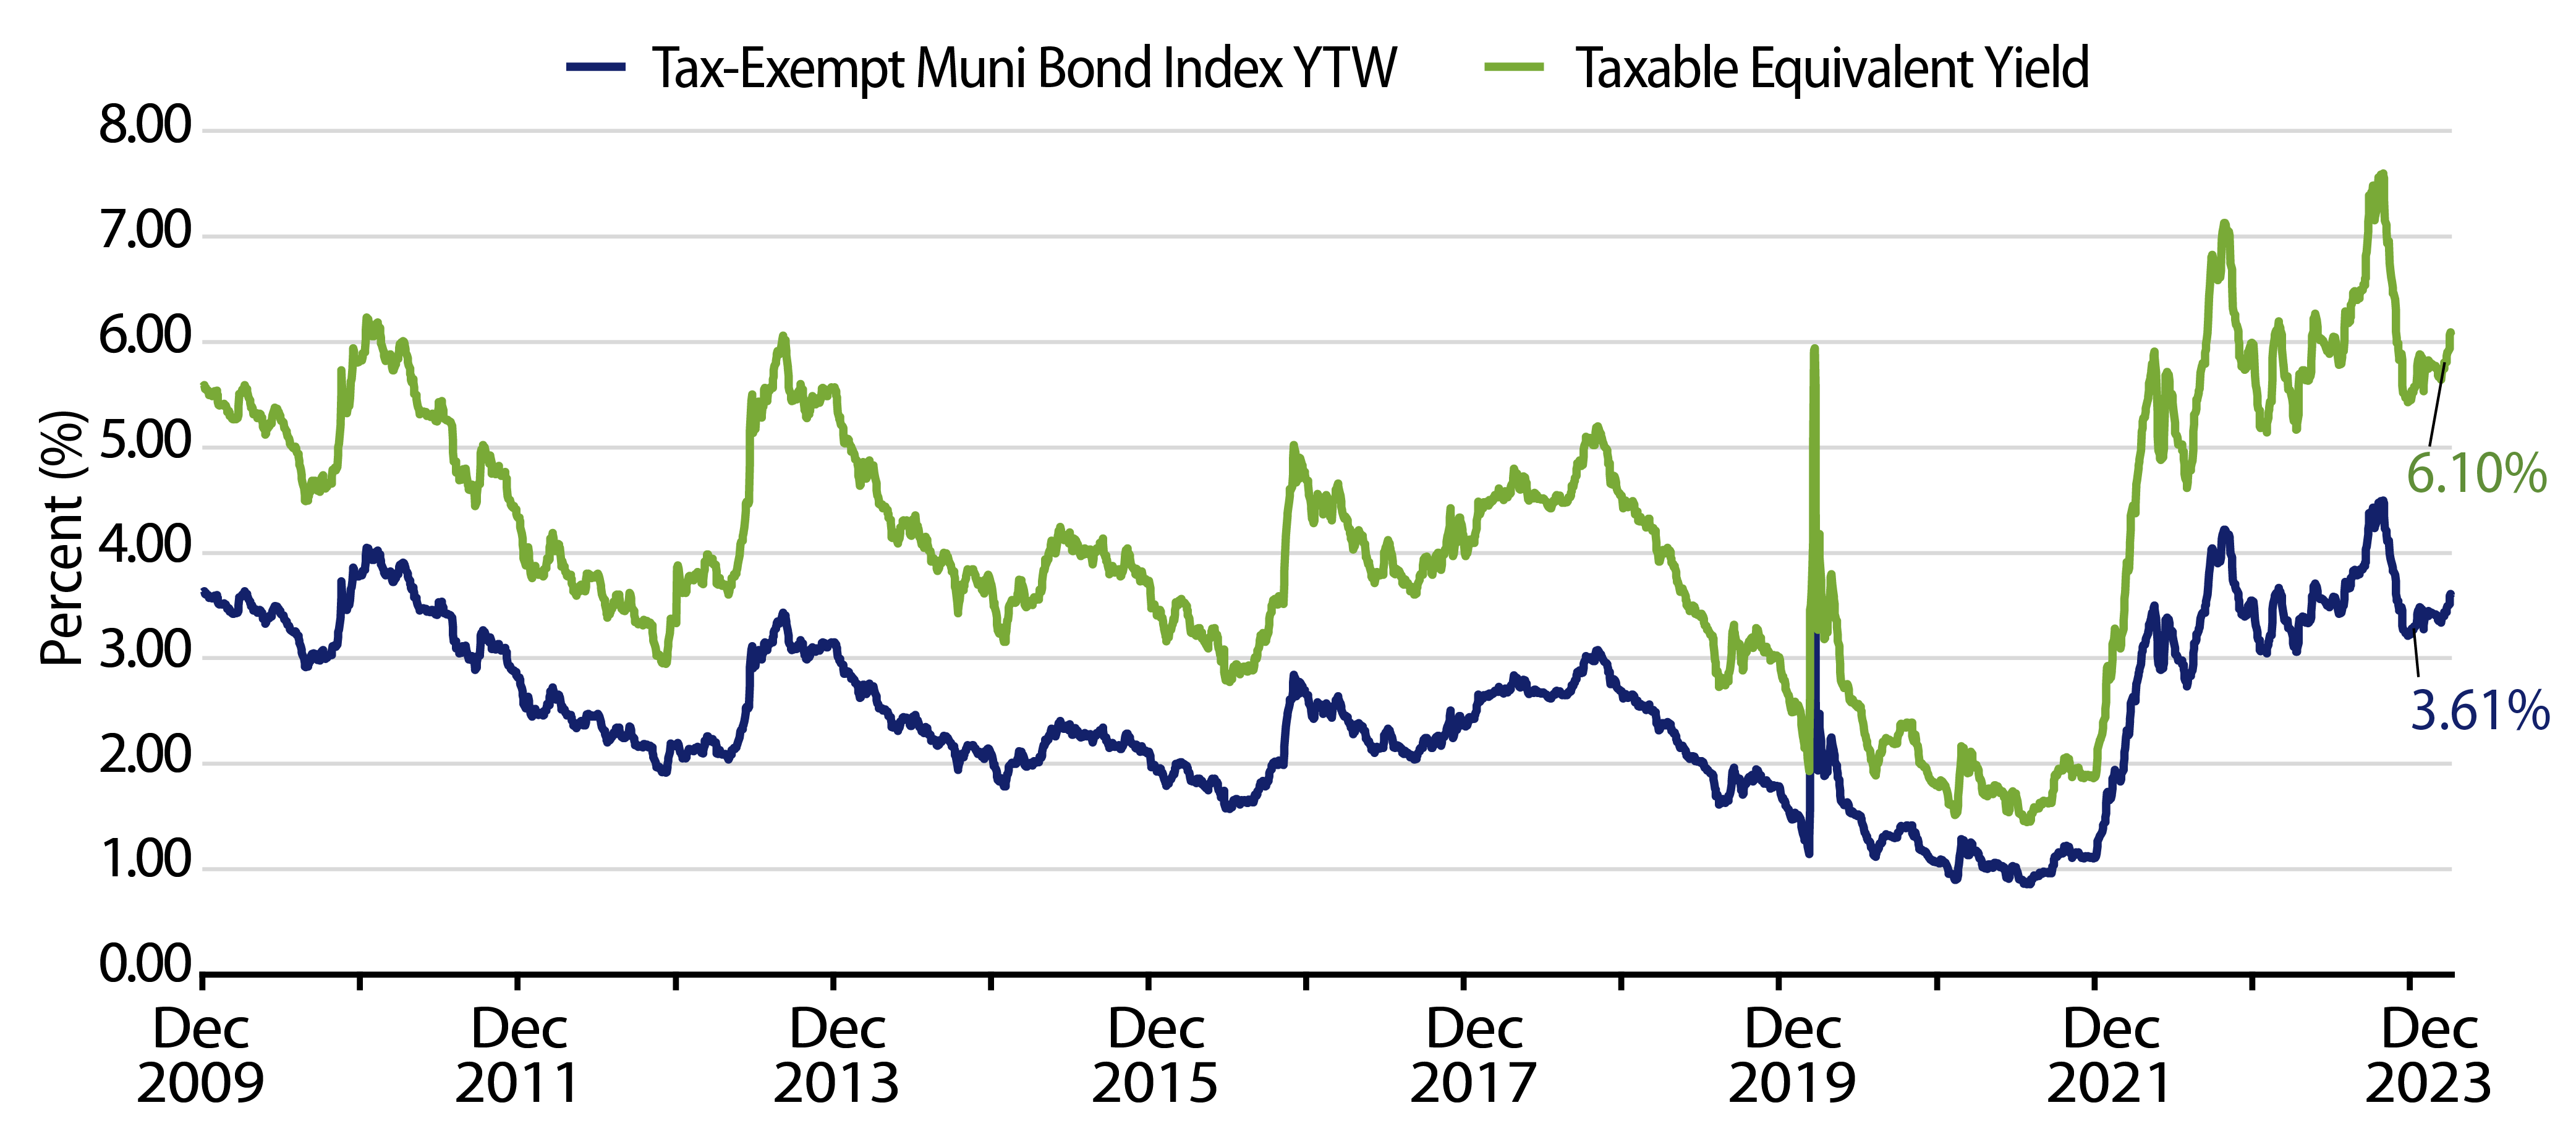
Theme #1: Municipal taxable-equivalent yields are above decade averages.

Exhibit 8: Muni and Taxable-Equivalent Muni Yield-to-Worst
Muni and Taxable-Equivalent Muni Yield-to-Worst
Source: Bloomberg, Western Asset. As of 22 Mar 24. Bloomberg Municipal Bond Index Yield Considering Highest Marginal Tax Rate of 40.8%. Indexes are unmanaged and one cannot directly invest in them. They do not include fees, expenses or sales charges. Past performance is not an indicator or a guarantee of future results. Select the image to expand the view.

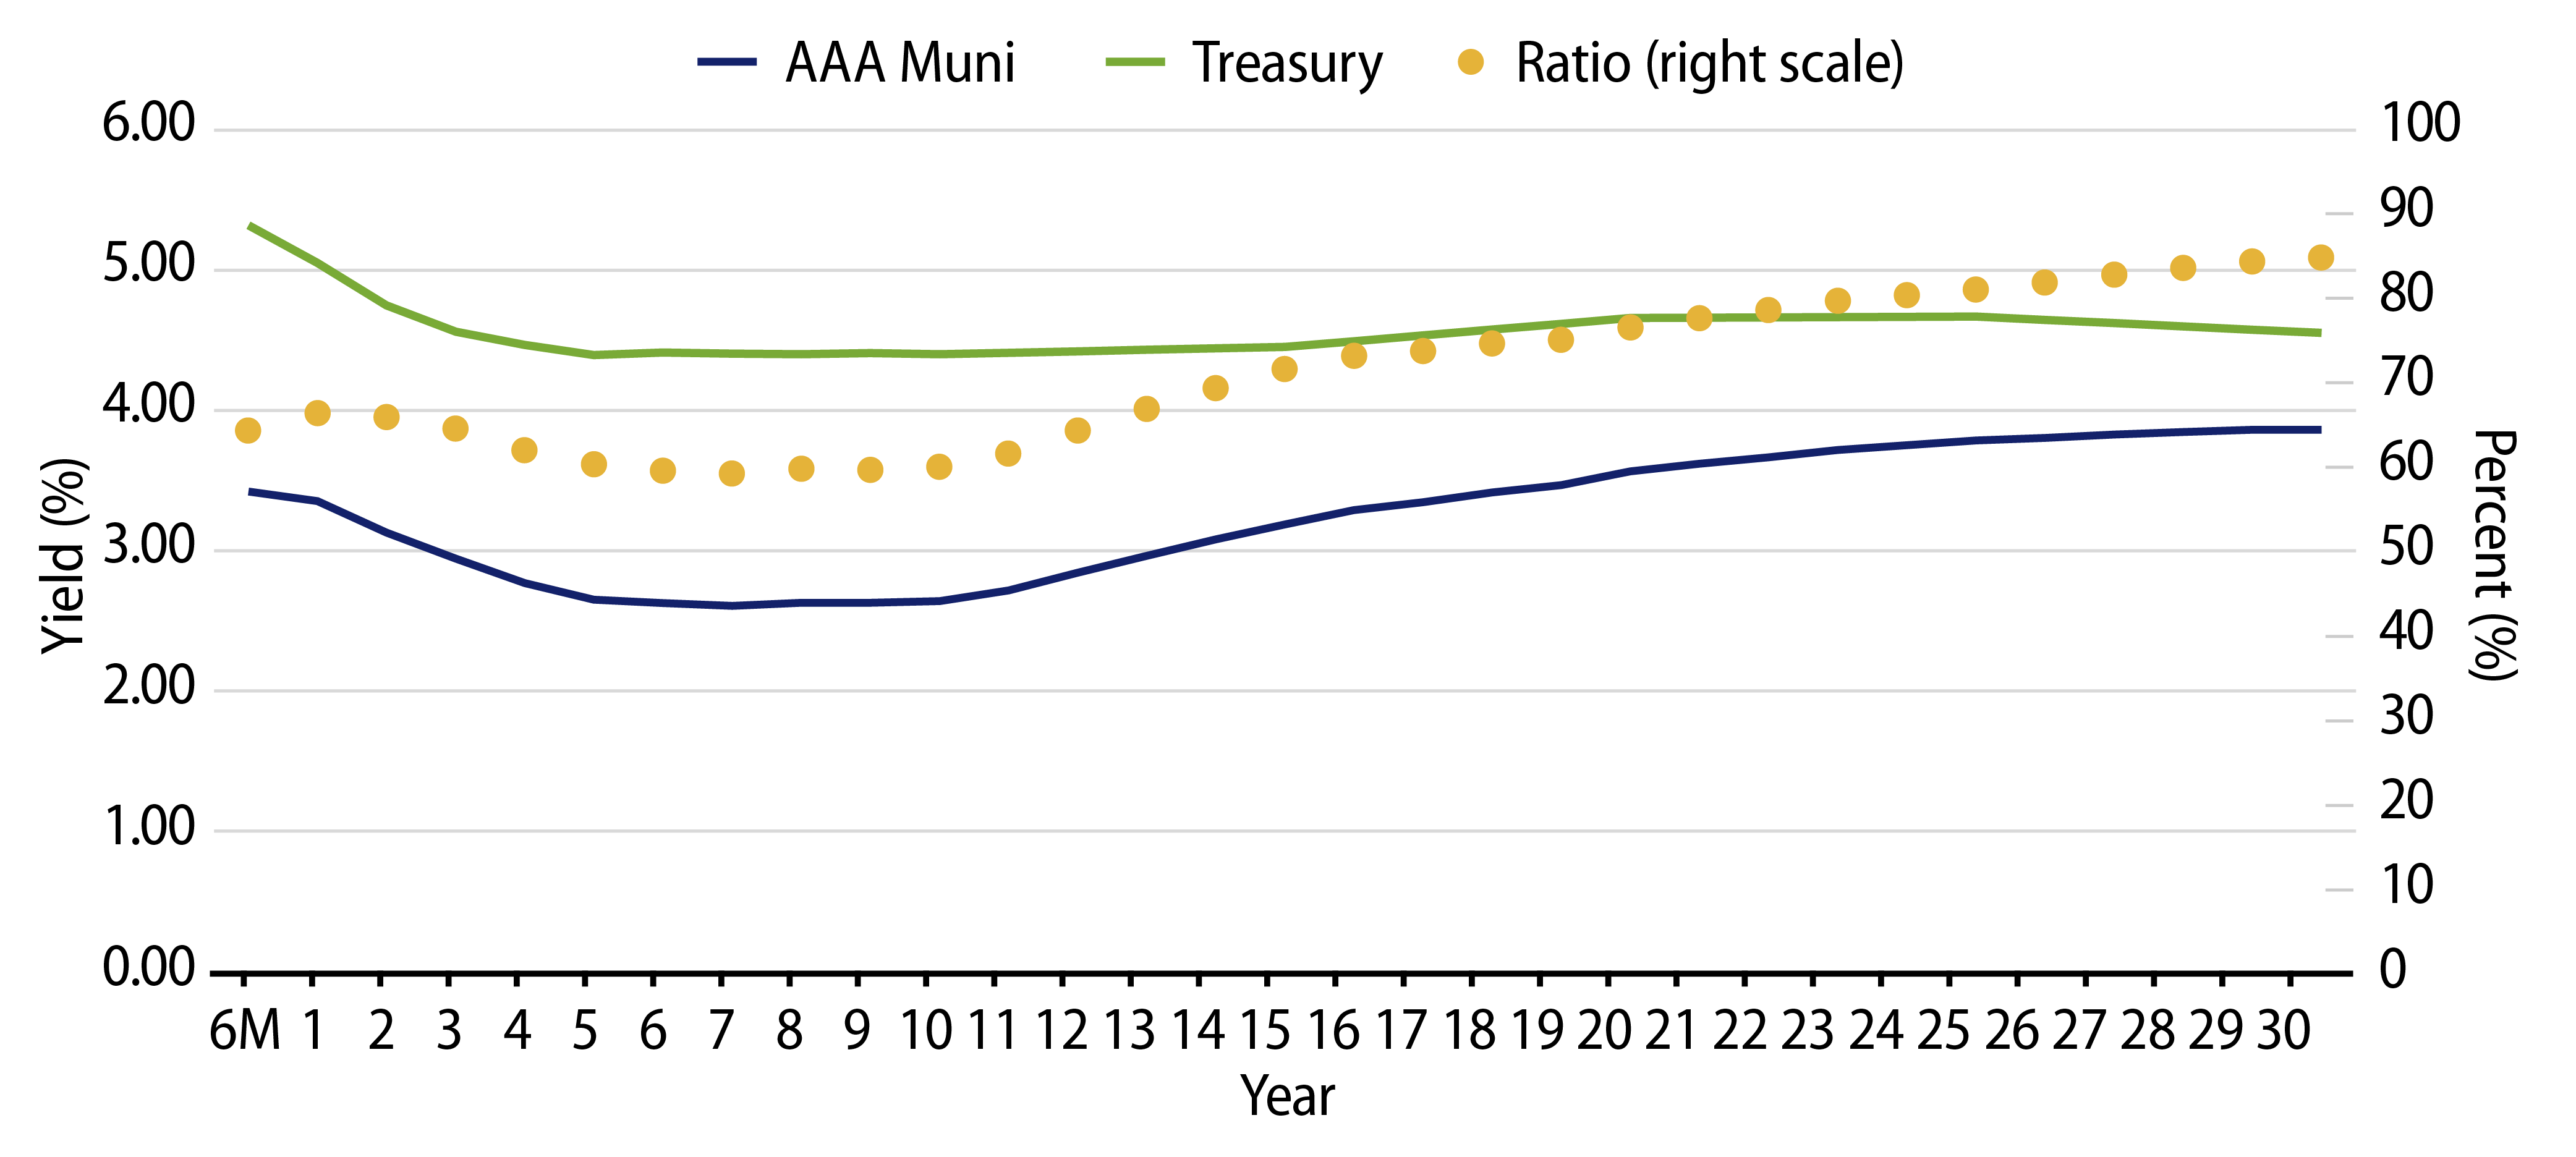
Theme #2: The inverted yield curve suggests less relative value in 5- and 10-year maturities.

Exhibit 9: AAA Municipal vs. Treasury Yield Curves
AAA Municipal vs. Treasury Yield Curves
Source: Bloomberg, Western Asset. As of 05 Apr 24 Bloomberg Valuation Service (BVAL) AAA Muni Curve and US On-/Off-the-Run Sovereign Curve. Indexes are unmanaged and one cannot directly invest in them. They do not include fees, expenses or sales charges. Past performance is not an indicator or a guarantee of future results. Select the image to expand the view.

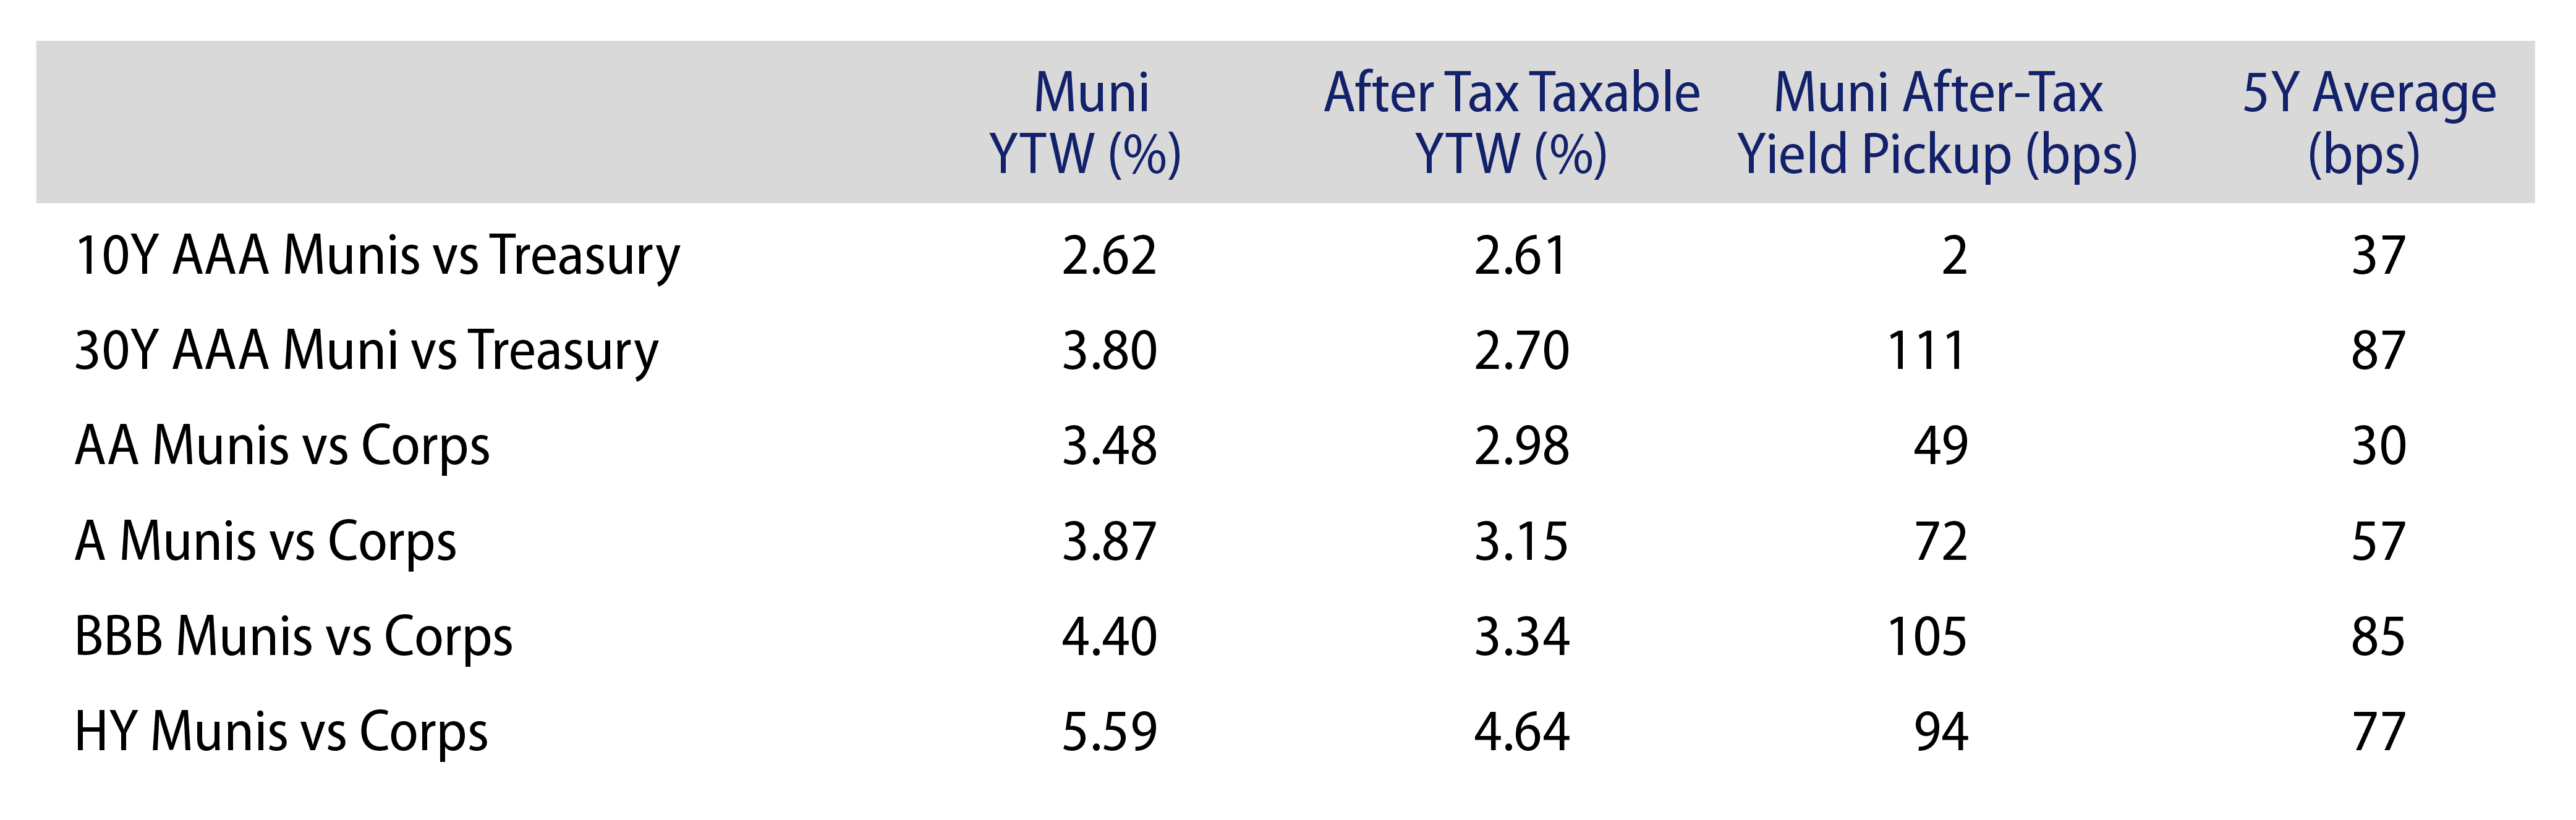
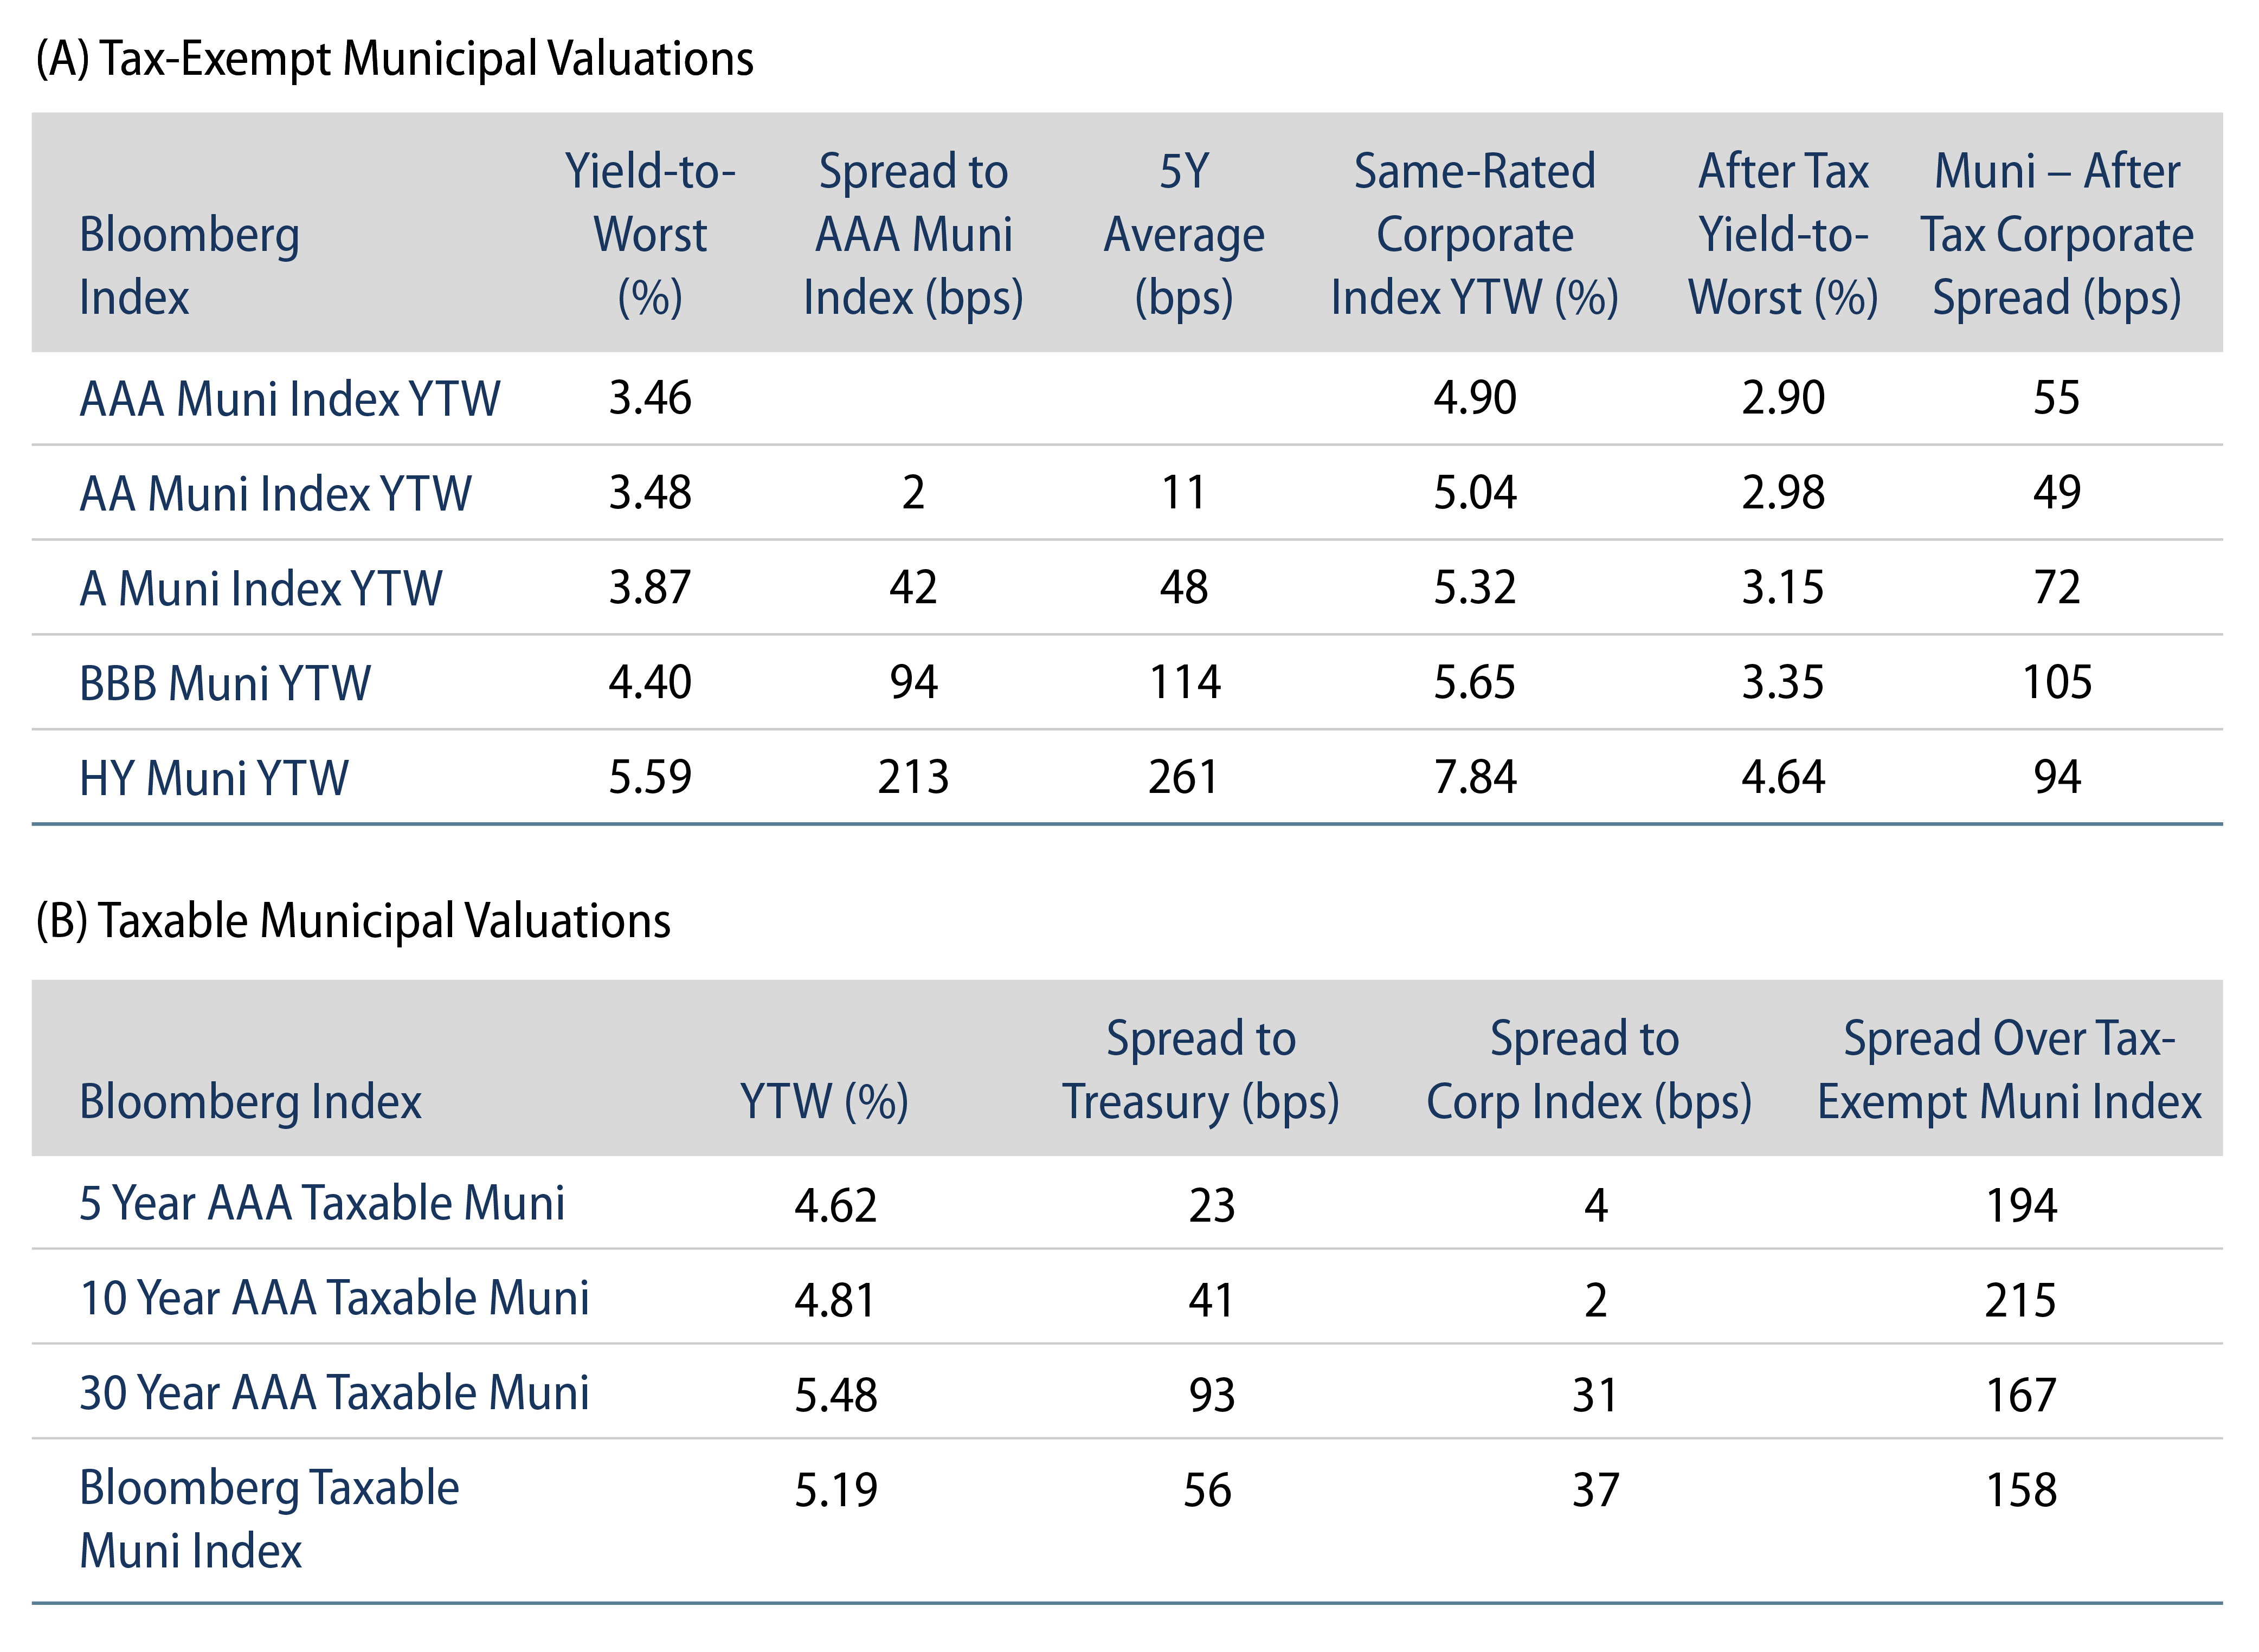
Theme #3: Munis offer attractive after-tax yield pickup versus long Treasuries and corporate credit.

Exhibit 10: Municipal vs. Taxable Fixed-Income Yields by Quality
Municipal vs. Taxable Fixed-Income Yields by Quality
Source: Western Asset, Bloomberg. As 05 Apr 24. 10- and 30-Year comparison reflects Bloomberg Valuation Service (BVAL) AAA Muni Curve and US On-/Off-the-Run Sovereign Curve. AA Muni reflects the Bloomberg AA Muni Bond Index. A Muni reflects the Bloomberg A Muni Bond Index. BBB Muni reflects the Bloomberg BBB Muni Bond Index. HY Muni reflects the Bloomberg High Yield Muni Bond Index. AA Corp reflects the Bloomberg AA Corporate Bond Index. A Corp reflects the Bloomberg A Corporate Bond Index. BBB Corp reflects the Bloomberg BBB Corporate Bond Index. After-tax yield considers top marginal tax rate of 40.8%. Indexes are unmanaged and one cannot directly invest in them. They do not include fees, expenses or sales charges. Past performance is not an indicator or a guarantee of future results. Select the image to expand the view.

© Western Asset Management Company, LLC 2024. The information contained in these materials ("the materials") is intended for the exclusive use of the designated recipient ("the recipient"). This information is proprietary and confidential and may contain commercially sensitive information, and may not be copied, reproduced or republished, in whole or in part, without the prior written consent of Western Asset Management Company ("Western Asset").
Past performance does not predict future returns. These materials should not be deemed to be a prediction or projection of future performance. These materials are intended for investment professionals including professional clients, eligible counterparties, and qualified investors only.
These materials have been produced for illustrative and informational purposes only. These materials contain Western Asset's opinions and beliefs as of the date designated on the materials; these views are subject to change and may not reflect real-time market developments and investment views.
Third party data may be used throughout the materials, and this data is believed to be accurate to the best of Western Asset's knowledge at the time of publication, but cannot be guaranteed. These materials may also contain strategy or product awards or rankings from independent third parties or industry publications which are based on unbiased quantitative and/or qualitative information determined independently by each third party or publication. In some cases, Western Asset may subscribe to these third party's standard industry services or publications. These standard subscriptions and services are available to all asset managers and do not influence rankings or awards in any way.
Investment strategies or products discussed herein may involve a high degree of risk, including the loss of some or all capital. Investments in any products or strategies described in these materials may be volatile, and investors should have the financial ability and willingness to accept such risks.
Unless otherwise noted, investment performance contained in these materials is reflective of a strategy composite. All other strategy data and information included in these materials reflects a representative portfolio which is an account in the composite that Western Asset believes most closely reflects the current portfolio management style of the strategy. Performance is not a consideration in the selection of the representative portfolio. The characteristics of the representative portfolio shown may differ from other accounts in the composite. Information regarding the representative portfolio and the other accounts in the composite are available upon request. Statements in these materials should not be considered investment advice. References, either general or specific, to securities and/or issuers in the materials are for illustrative purposes only and are not intended to be, and should not be interpreted as, recommendation to purchase or sell such securities. Employees and/or clients of Western Asset may have a position in the securities or issuers mentioned.
These materials are not intended to provide, and should not be relied on for, accounting, legal, tax, investment or other advice. The recipient should consult its own counsel, accountant, investment, tax, and any other advisers for this advice, including economic risks and merits, related to making an investment with Western Asset. The recipient is responsible for observing the applicable laws and regulations of their country of residence.
Founded in 1971, Western Asset Management Company is a global fixed-income investment manager with offices in Pasadena, New York, London, Singapore, Tokyo, Melbourne, São Paulo, Hong Kong, and Zürich. Western Asset is a wholly owned subsidiary of Franklin Resources, Inc. but operates autonomously. Western Asset is comprised of six legal entities across the globe, each with distinct regional registrations: Western Asset Management Company, LLC, a registered Investment Adviser with the Securities and Exchange Commission; Western Asset Management Company Distribuidora de Títulos e Valores Mobiliários Limitada is authorized and regulated by Comissão de Valores Mobiliários and Brazilian Central Bank; Western Asset Management Company Pty Ltd ABN 41 117 767 923 is the holder of the Australian Financial Services License 303160; Western Asset Management Company Pte. Ltd. Co. Reg. No. 200007692R is a holder of a Capital Markets Services License for fund management and regulated by the Monetary Authority of Singapore; Western Asset Management Company Ltd, a registered Financial Instruments Business Operator and regulated by the Financial Services Agency of Japan; and Western Asset Management Company Limited is authorised and regulated by the Financial Conduct Authority ("FCA") (FRN 145930). This communication is intended for distribution to Professional Clients only if deemed to be a financial promotion in the UK as defined by the FCA. This communication may also be intended for certain EEA countries where Western Asset has been granted permission to do so. For the current list of the approved EEA countries please contact Western Asset at +44 (0)20 7422 3000.