skip navigation
Blog

Stay up to date on timely topics and market events. Subscribe to our Blog now.

MARKETS
July 18, 2025

Weekly Municipal Monitor—Big Beautiful Bill Outcomes

By Sam Weitzman

Stay up to date on timely topics and market events. Subscribe to our Blog now.

Macros, Markets and Munis

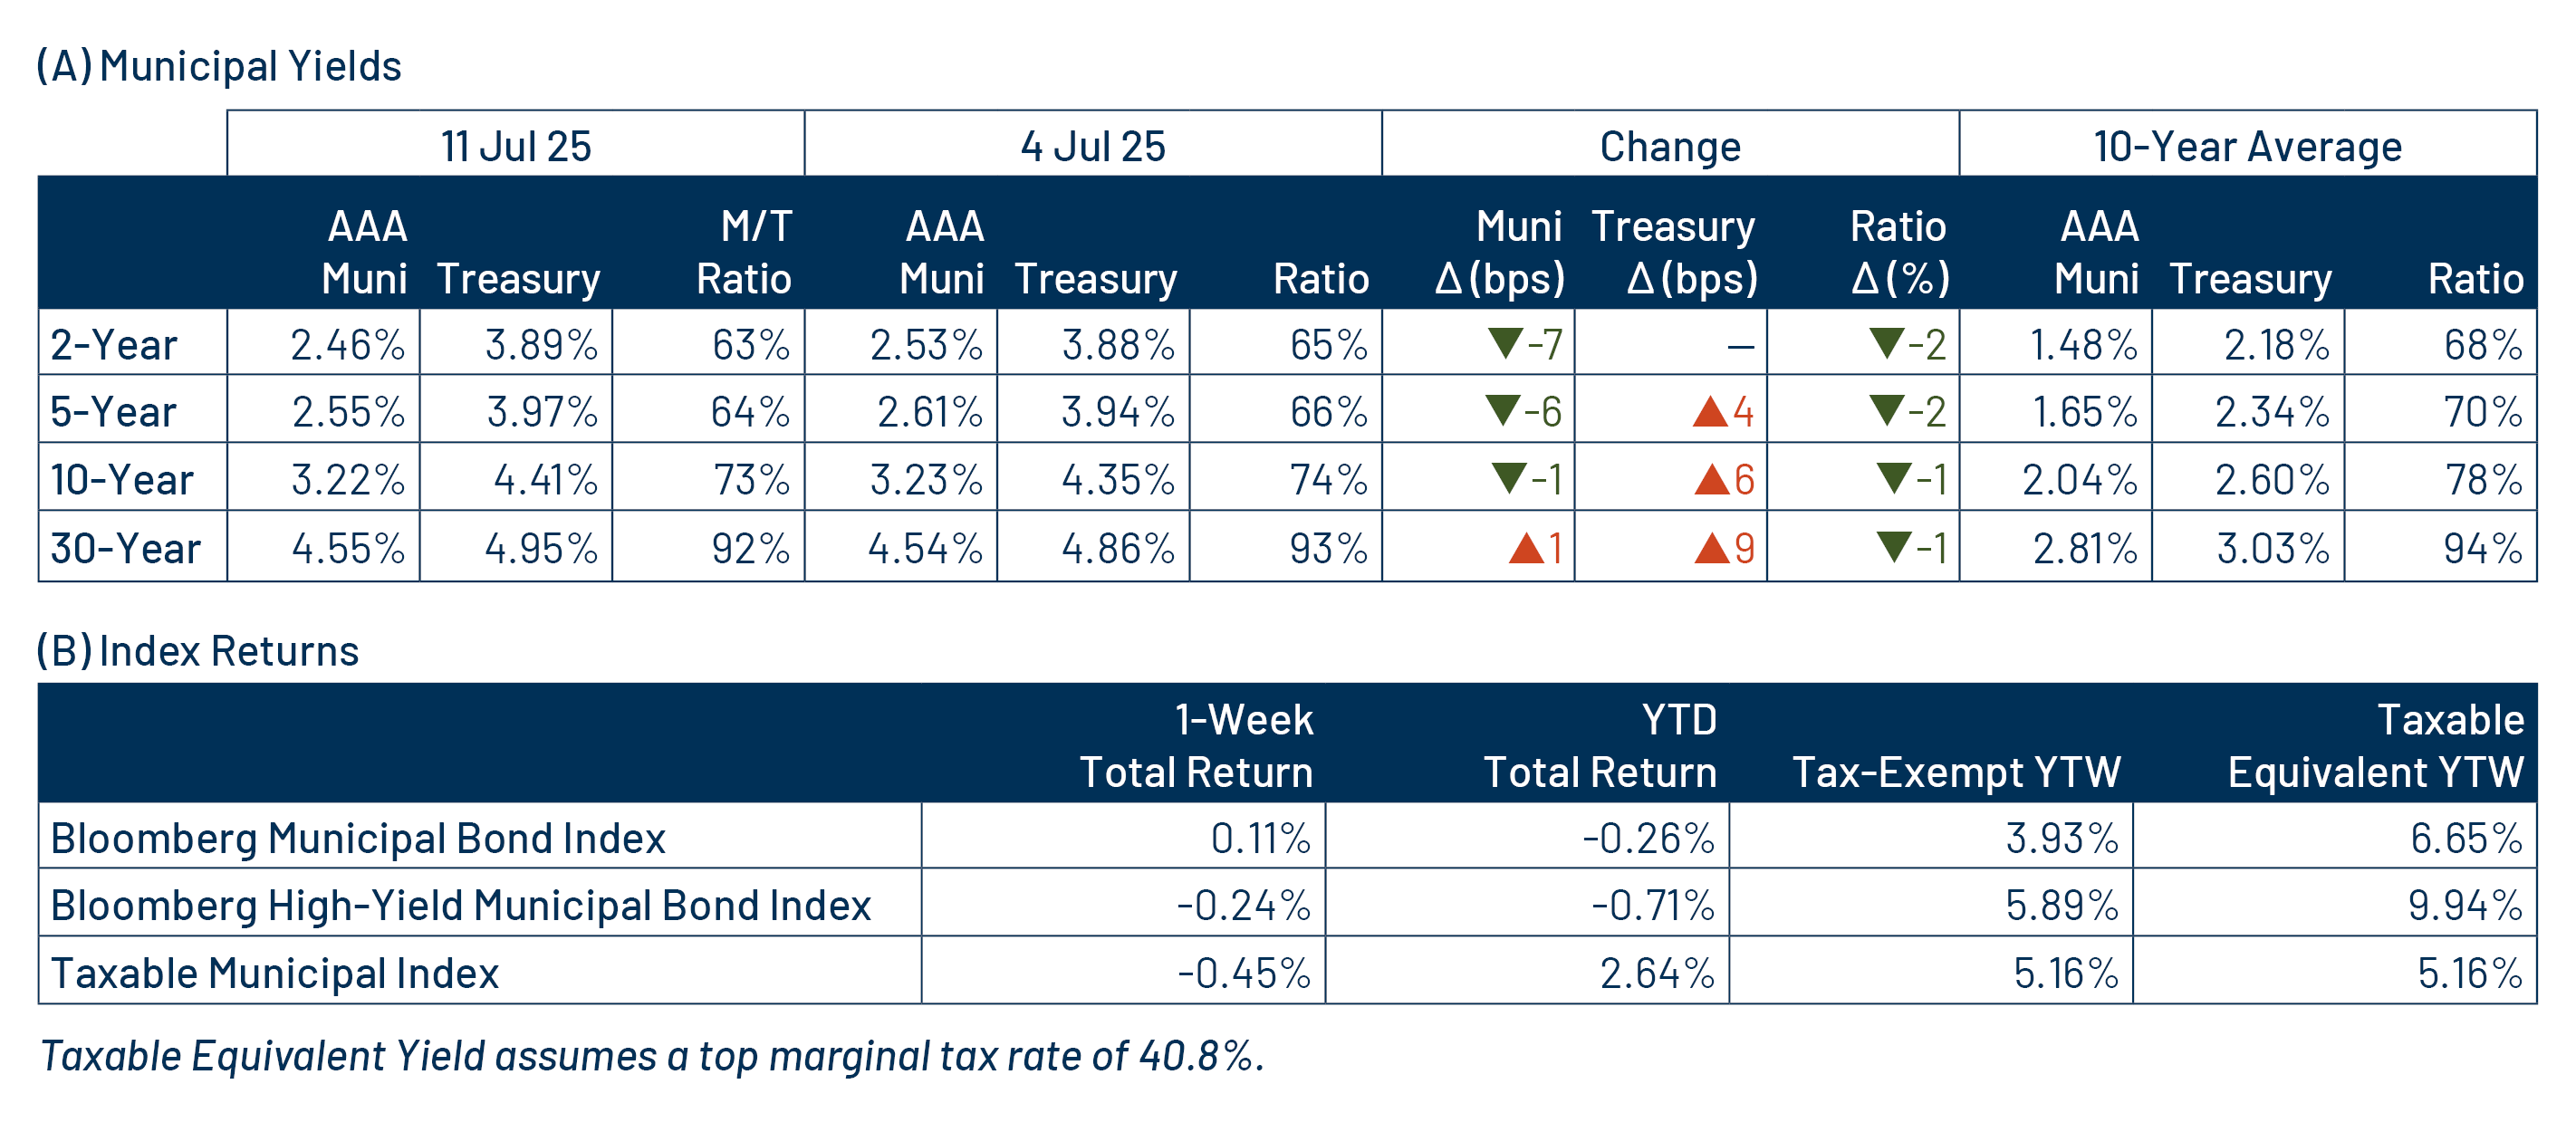
Municipals posted positive returns last week as yields moved 1-7 basis points lower across short and intermediate maturities, outperforming Treasuries which generally moved higher across the curve. Amid a light week of economic data, fixed-income volatility increased last week as tariffs and associated inflation concerns came back into focus as the original Liberation Day tariff deadlines approached. This week we highlight implications from the final “Big Beautiful Bill” legislation signed by President Trump on July 4.

Muni Issuance Rebounded to Elevated Levels

Fund Flows (up $432 million): During the week ending July 13, weekly reporting municipal mutual funds recorded $432 million of net inflows, according to Lipper. Short and short-intermediate categories recorded the majority inflows at $211 million, collectively. Long-term funds recorded $56 million of inflows, intermediate funds recorded $81 million of inflows and high-yield funds recorded $137 million of inflows. Last week’s inflows marked an 11th consecutive week of inflows and led year-to-date (YTD) inflows higher to $14 billion.

Supply (YTD supply of $305 billion; up 27% YoY): The muni market recorded $15 billion of new-issue supply last week, rebounding to elevated levels following the prior light holiday week. YTD new-issue supply of $305 billion is 27% higher than the prior year, with tax-exempt issuance up 11% and taxable issuance up 28%, respectively. This week’s calendar is expected to remain elevated at $15 billion. The largest deals include $1.4 billion New York Transportation Development Corporation and $2.4 billion New York State Thruway Authority transactions.

This Week in Munis: Big Beautiful Bill Outcomes

On July 4, President Trump signed the “Big Beautiful Tax Reconciliation” legislation, following a series of Senate amendments during the week leading up to the holiday. The bill extends key provisions of the 2017 Tax Cuts and Jobs Act (TCJA) and introduces additional measures, including increased border security and health care reform. According to CBO estimates, the legislation is expected to cost between $3.3 trillion and $3.4 trillion over the next decade. Implications for municipal investors extend across long-term tax policy and the relative value of municipal debt to credit implications stemming from funding changes.

  • Permanently Extending Individual Tax Rates: Of particular interest to municipal bond investors, the legislation permanently extends the individual income tax brackets established by the 2017 TCJA, keeping the top federal marginal rate at 37%. This maintains the current value of the municipal tax exemption for top earners in the muni market.
  • Increasing SALT Deduction: The bill increases the State and Local Tax (SALT) deduction cap from $10,000 to $40,000 and establishes an income limit of $250,000 for single filers and $500,000 for joint filers. While this will reduce tax liabilities for many in high-tax states, we expect the income limits to blunt the impact of the proposed relief and not materially reshape the demand profile of municipal investors. This provision is set to expire in December 2029.
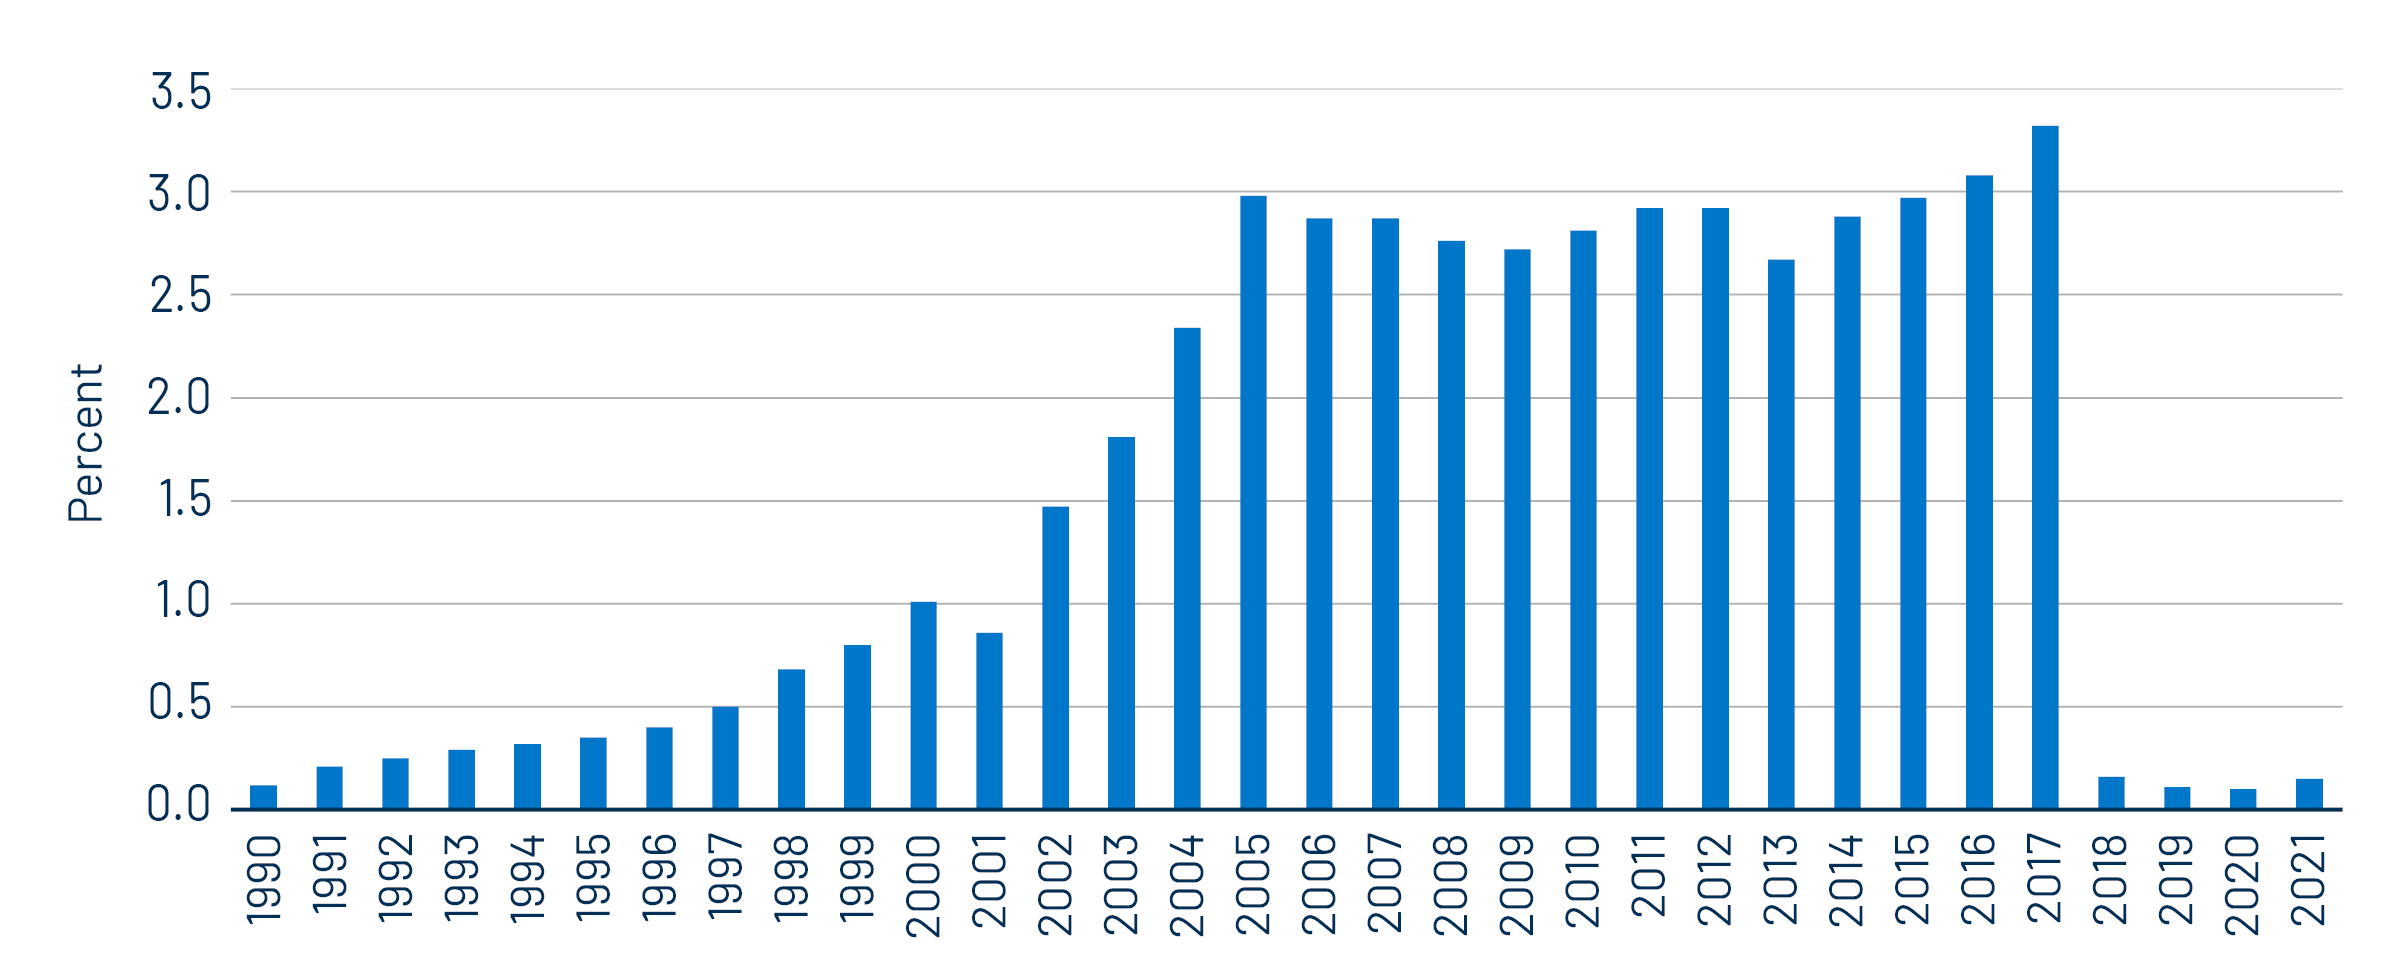
  • Extending AMT Provisions: Notably, the bill permanently extends the higher Alternative Minimum Tax (AMT) exemption amounts and phase-outs established by the 2017 TCJA, which reduced the number of taxpayers subject to the AMT by 96% from over five million to 200,000. Municipal securities subject to the AMT tend to offer excess income opportunities versus non-AMT counterparts, and the extension of this provision can provide higher after-tax income opportunities for a broader base of investors not subject to the AMT.

Exhibit 1: Percent of Taxpayer Returns Subject to AMT
Percent of Taxpayer Returns Subject to AMT
Source: Tax Foundation IRS Statistics of Income (SOI). As of 07 Aug 24. Figures shown are through tax-year 2021. Select the image to expand the view.
Exhibit 2: AMT Muni Bond Index YTW—Muni Bond Index YTW (%)
AMT Muni Bond Index YTW—Muni Bond Index YTW (%)
Source: Bloomberg, Western Asset. Yield-to-worst (YTW) is the lowest potential yield that can be received on a bond without the issuer actually defaulting. As of 11 Jun 25. Select the image to expand the view.

Throughout the presidential campaign and early Trump presidency, rhetoric around lower tax rates and the potential elimination of the municipal tax exemption created uncertainty regarding the sustained value of municipal securities. Western Asset believes this uncertainty weighed on market demand, as observed following the 2022−2023 outflow cycle. Specifically, we anticipate the municipal market will contend with greater rate volatility due to expanding deficits, as well as evolving credit implications associated with federal funding reductions, particularly in the health care sector which faces lower Medicaid spending. We believe these shifting market dynamics will create opportunities for active managers to deliver risk-adjusted value to municipal investors ahead.

Municipal Credit Curves and Relative Value

Exhibit 3: Muni Credit Curves
Muni Credit Curves
Source: Bloomberg, Western Asset. As of 11 Jul 25. Bloomberg Valuation Service (BVAL) Municipal Credit Indices (AAA, AA, A, BBB, respectively) and US Sovereign Curves. Taxable-Equivalent Muni Credit Curves consider the top marginal effective tax rate of 40.8%. AA Muni is represented by the US General Obligation AA Muni BVAL Yield Curve. The BVAL curve is populated with pricing from uninsured AA General Obligation bonds. A Muni is represented by the US General Obligation A Muni BVAL Yield Curve. The BVAL curve is populated with pricing from uninsured A General Obligation bonds. BBB Muni is represented by the US General Obligation BBB Muni BVAL Yield Curve. The BVAL curve is populated with pricing from uninsured BBB General Obligation bonds. Indices are unmanaged and one cannot directly invest in them. They do not include fees, expenses or sales charges. Past performance is not an indicator or a guarantee of future results. Select the image to expand the view.
Exhibit 4: Taxable-Equivalent Muni Credit Curves
Taxable-Equivalent Muni Credit Curves
Source: Bloomberg, Western Asset. As of 11 Jul 25. Bloomberg Valuation Service (BVAL) Municipal Credit Indices (AAA, AA, A, BBB, respectively) and US Sovereign Curves. Taxable-Equivalent Muni Credit Curves consider the top marginal effective tax rate of 40.8%. AA Muni is represented by the US General Obligation AA Muni BVAL Yield Curve. The BVAL curve is populated with pricing from uninsured AA General Obligation bonds. A Muni is represented by the US General Obligation A Muni BVAL Yield Curve. The BVAL curve is populated with pricing from uninsured A General Obligation bonds. BBB Muni is represented by the US General Obligation BBB Muni BVAL Yield Curve. The BVAL curve is populated with pricing from uninsured BBB General Obligation bonds. Indices are unmanaged and one cannot directly invest in them. They do not include fees, expenses or sales charges. Past performance is not an indicator or a guarantee of future results. Select the image to expand the view.
Exhibit 5: AAA Munis vs. Treasuries
AAA Munis vs. Treasuries
Source: Muni Yields: Thomson Reuters MMD, Treasury Yields: Bloomberg. As of 11 Jul 25. Past performance is not a guarantee of future results. It is not possible to invest directly in an index. Select the image to expand the view.
Exhibit 6: Tax-Exempt and Taxable Muni Valuations
Tax-Exempt and Taxable Muni Valuations
Source: Bloomberg, Western Asset. As of 11 Jul 25. Yield-to-worst (YTW) is the lowest potential yield that can be received on a bond without the issuer actually defaulting. AAA, AA, A, BBB Corporate Indices; After-Tax Yield assumes a top effective tax rate of 40.8%. Taxable Muni Index Corporate comparable used is the Global Corporate Aggregate (ex. BBB) to better align credit quality and duration. Select the image to expand the view.

Western Asset Key Themes for Muni Investors

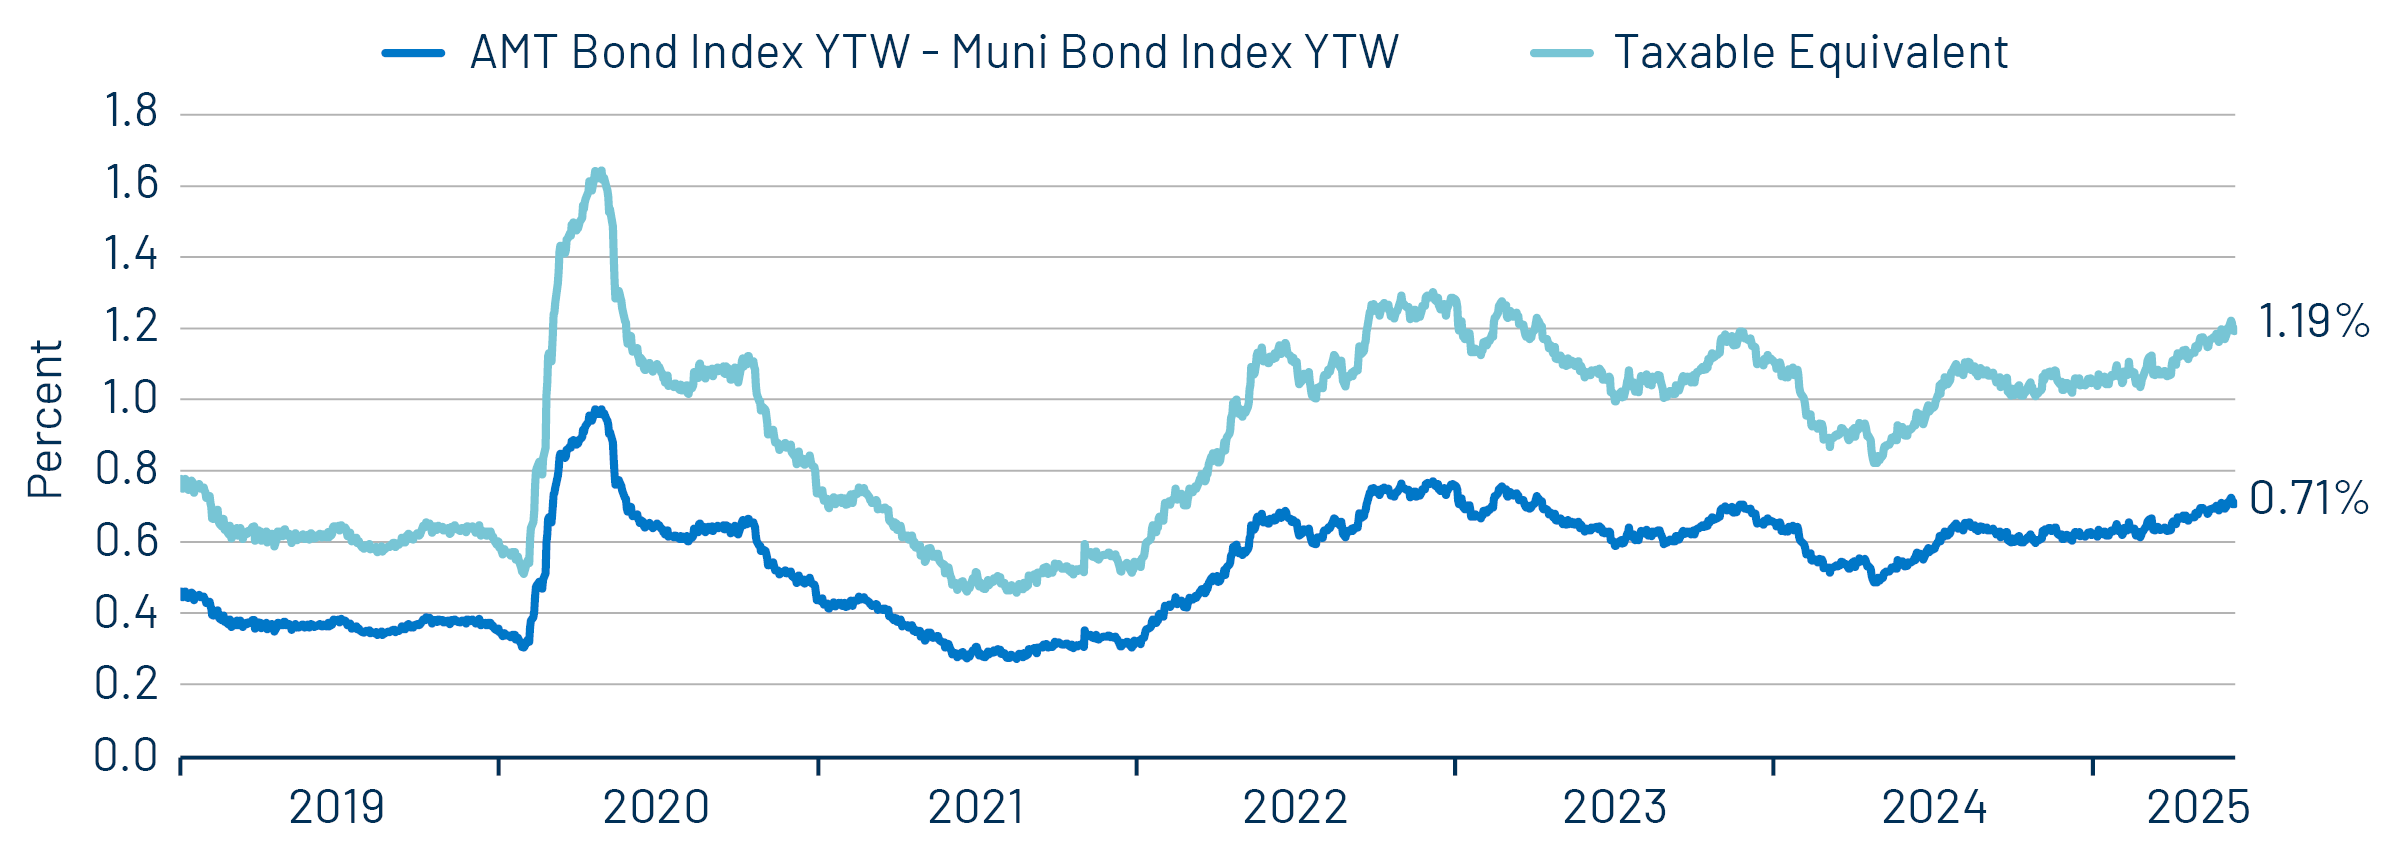
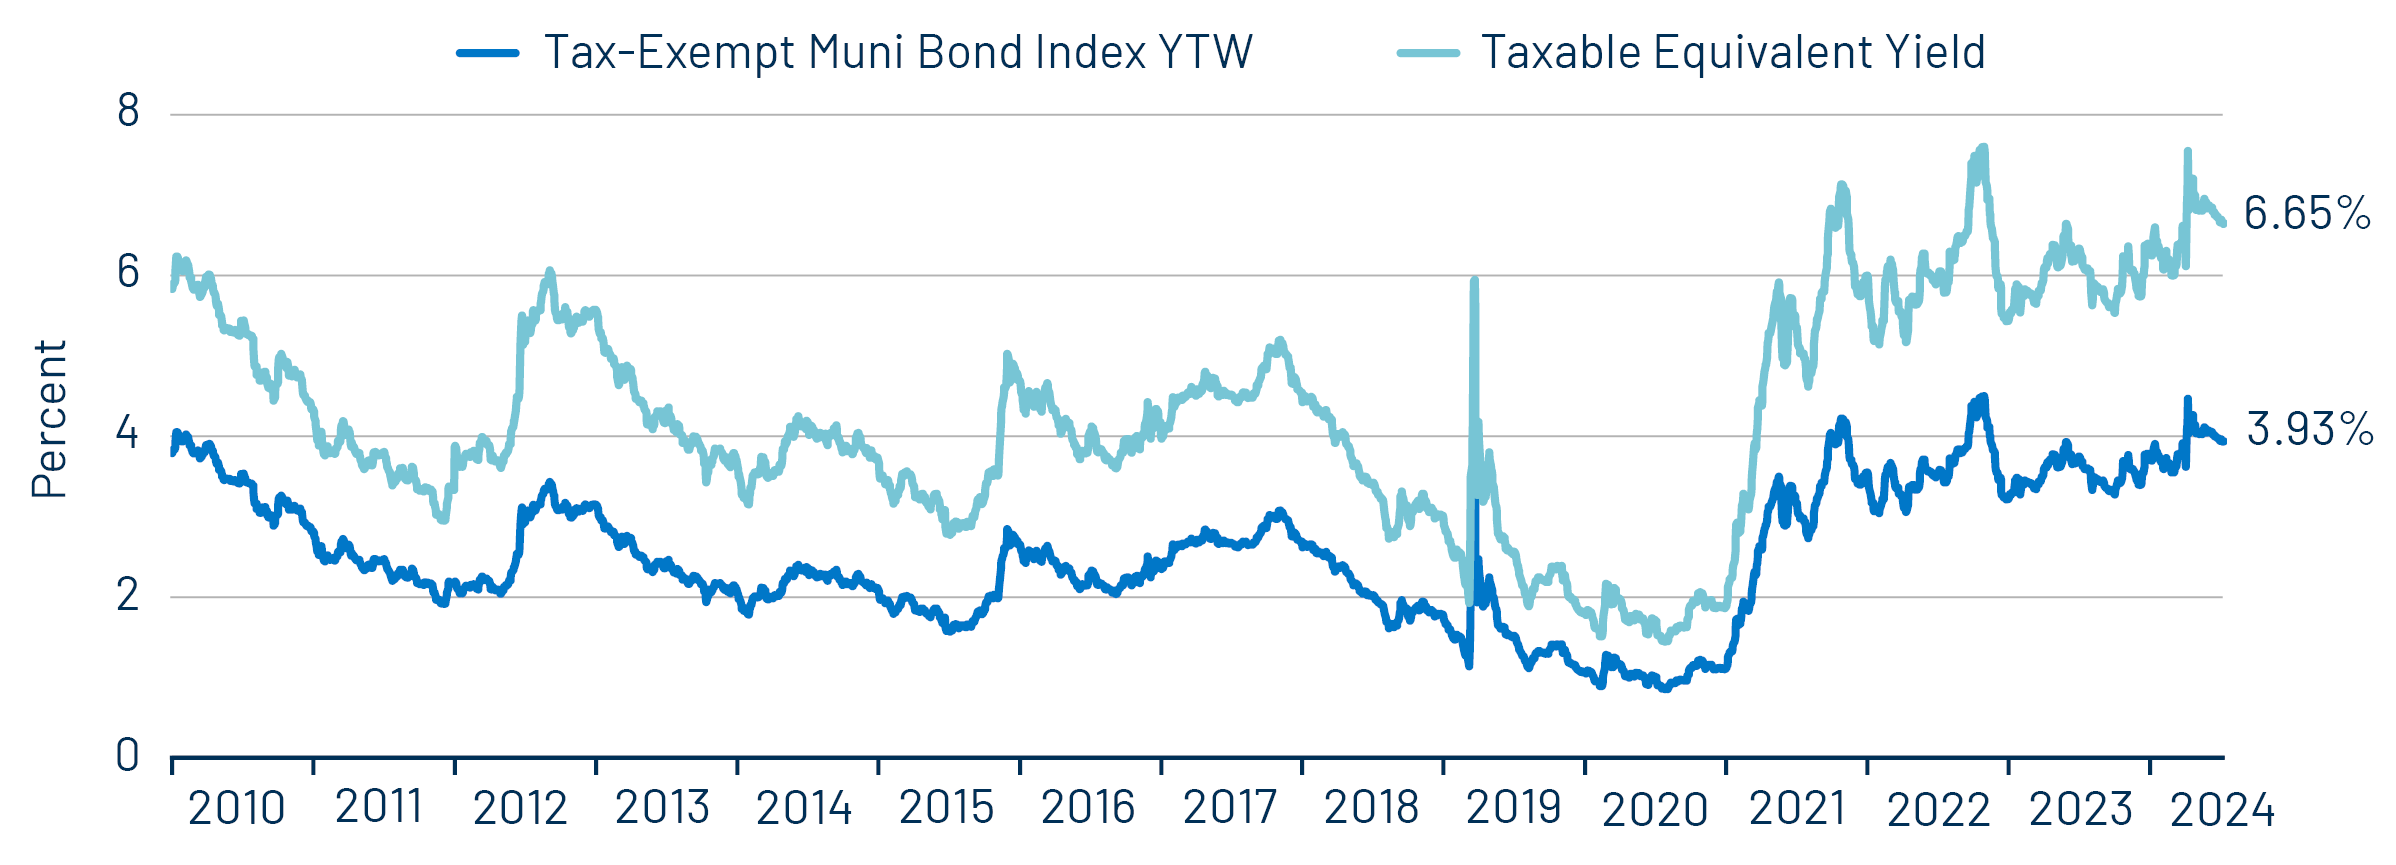
Theme #1: Municipal taxable-equivalent yields and income opportunities remain near decade-high levels.

Exhibit 7: Muni and Taxable-Equivalent Muni Yield-to-Worst
Muni and Taxable-Equivalent Muni Yield-to-Worst
Source: Bloomberg, Western Asset. As of 11 Jul 25. Bloomberg Municipal Bond Index yield considering highest marginal tax rate of 40.8%. Indexes are unmanaged and one cannot directly invest in them. They do not include fees, expenses or sales charges. Past performance is not an indicator or a guarantee of future results. Select the image to expand the view.

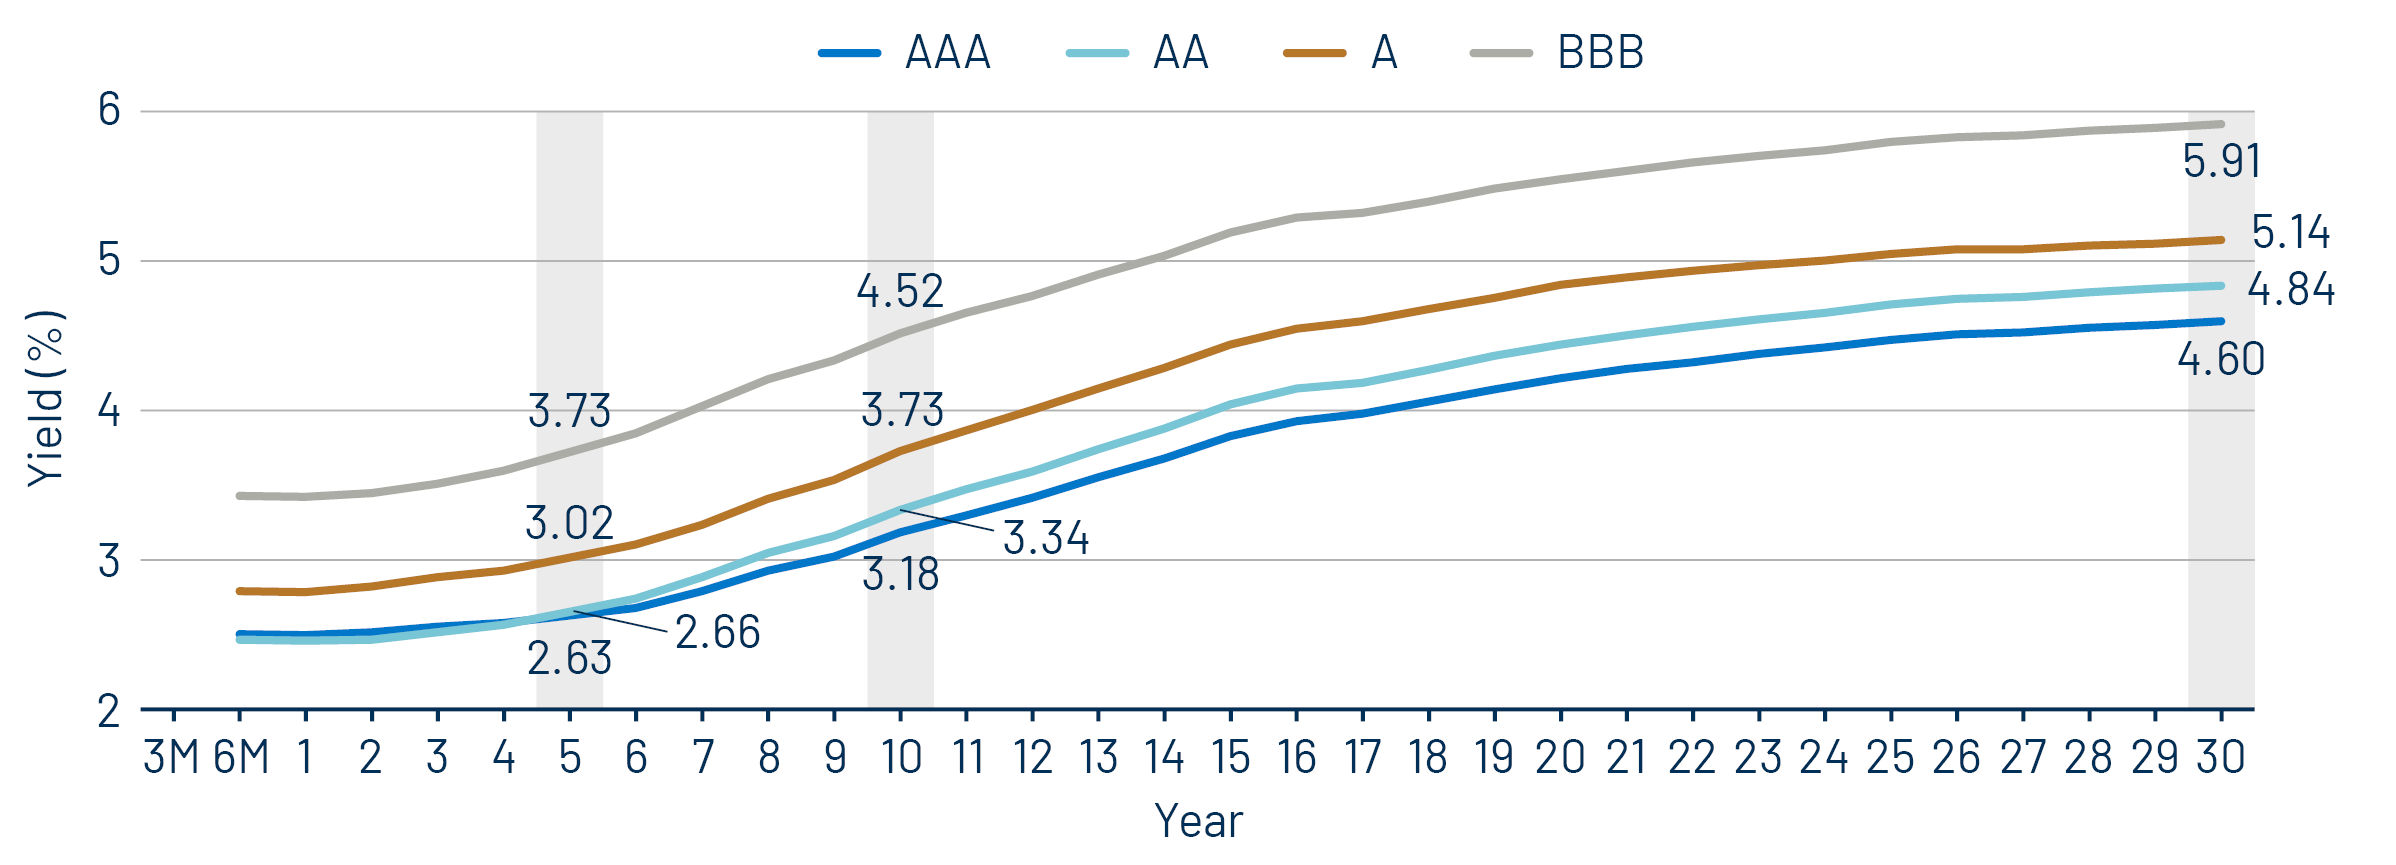
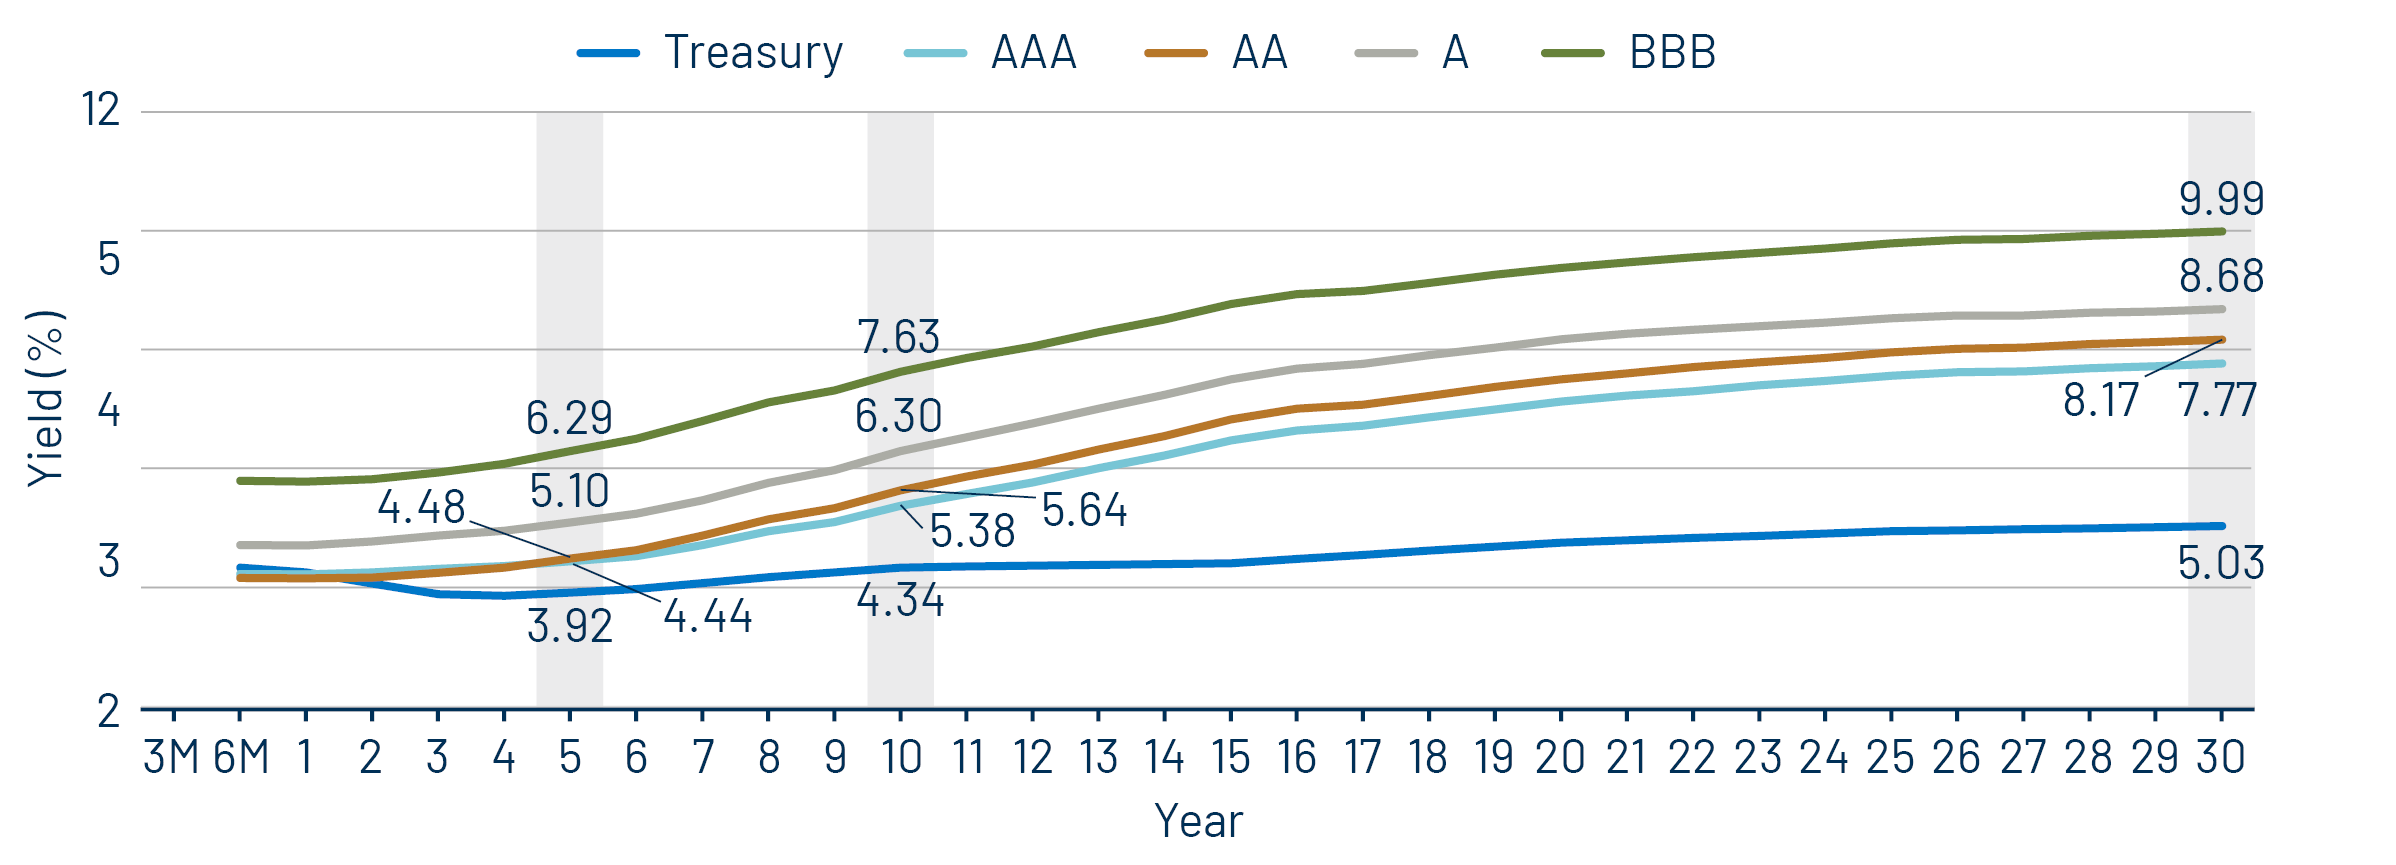
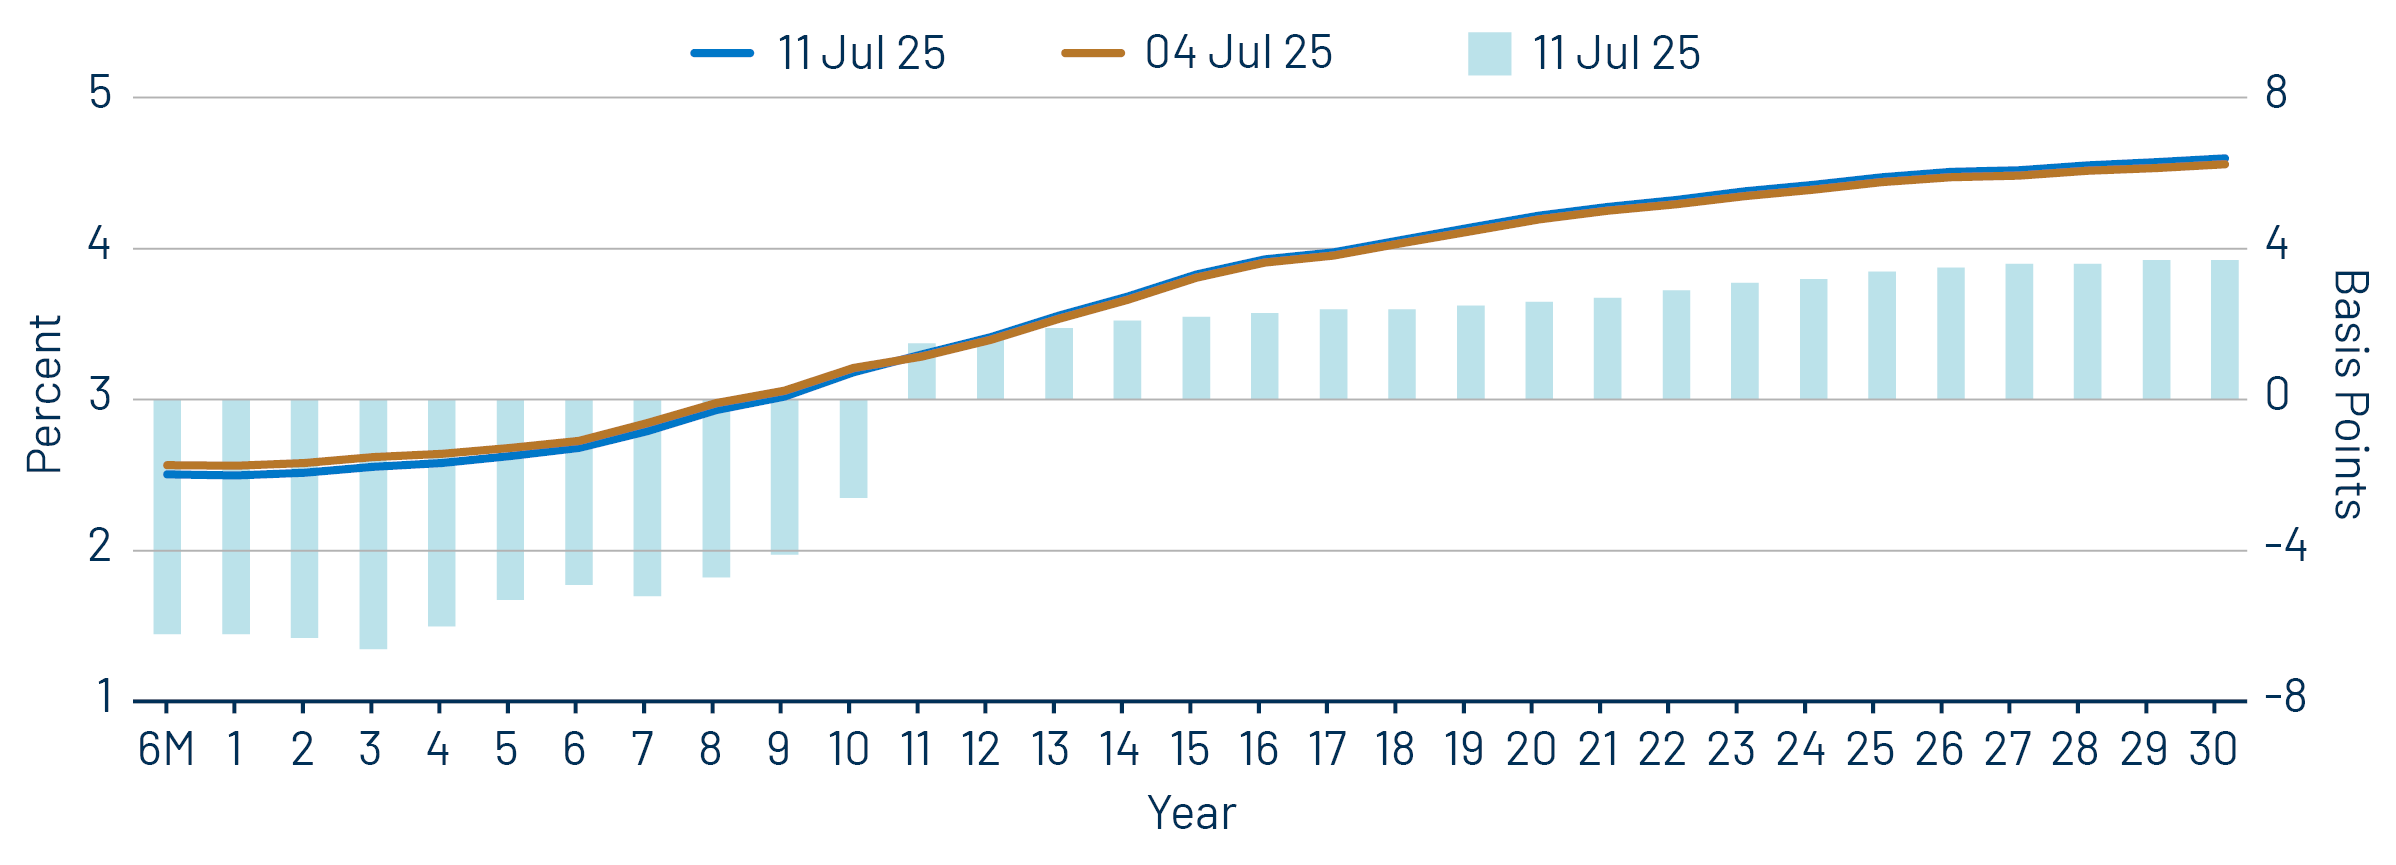
Theme #2: The AAA muni curve has steepened, offering better value in intermediate and longer maturities.

Exhibit 8: AAA Municipal vs. Treasury Yield Curves
AAA Municipal vs. Treasury Yield Curves
Source: Bloomberg, Western Asset. As of 11 Jul 25. Bloomberg Valuation Service (BVAL) AAA Muni Curve and US On-/Off-the-Run Sovereign Curve. Indexes are unmanaged and one cannot directly invest in them. They do not include fees, expenses or sales charges. Past performance is not an indicator or a guarantee of future results. Select the image to expand the view.

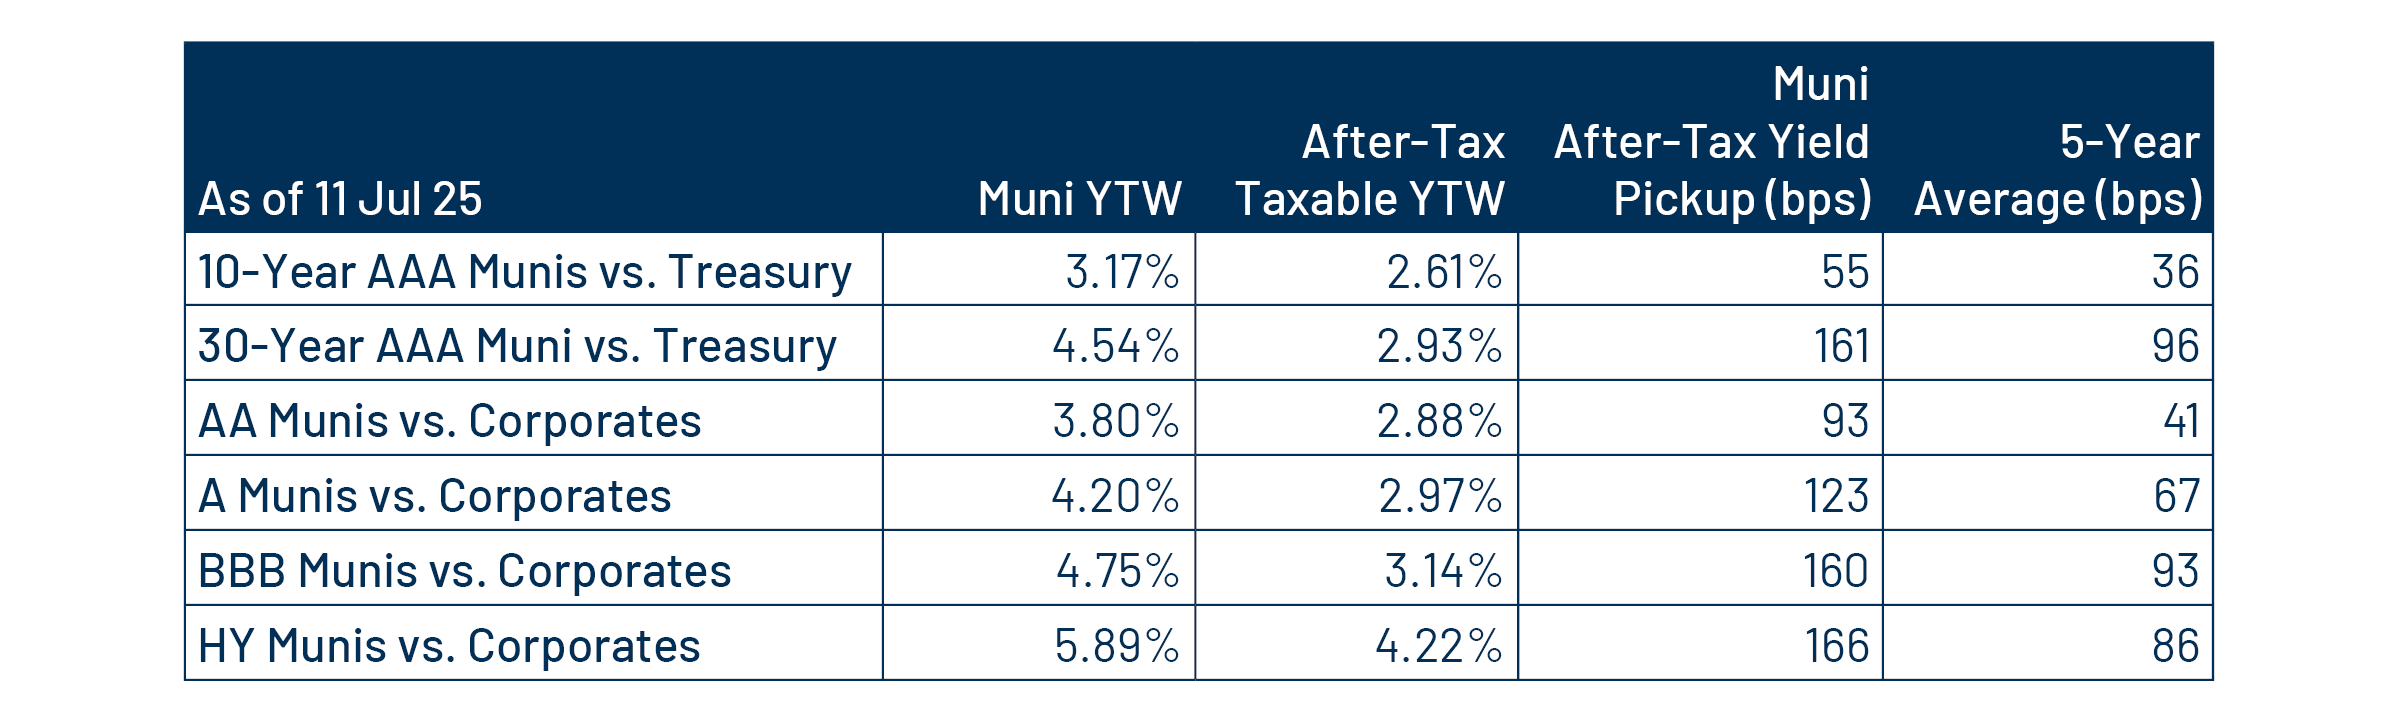
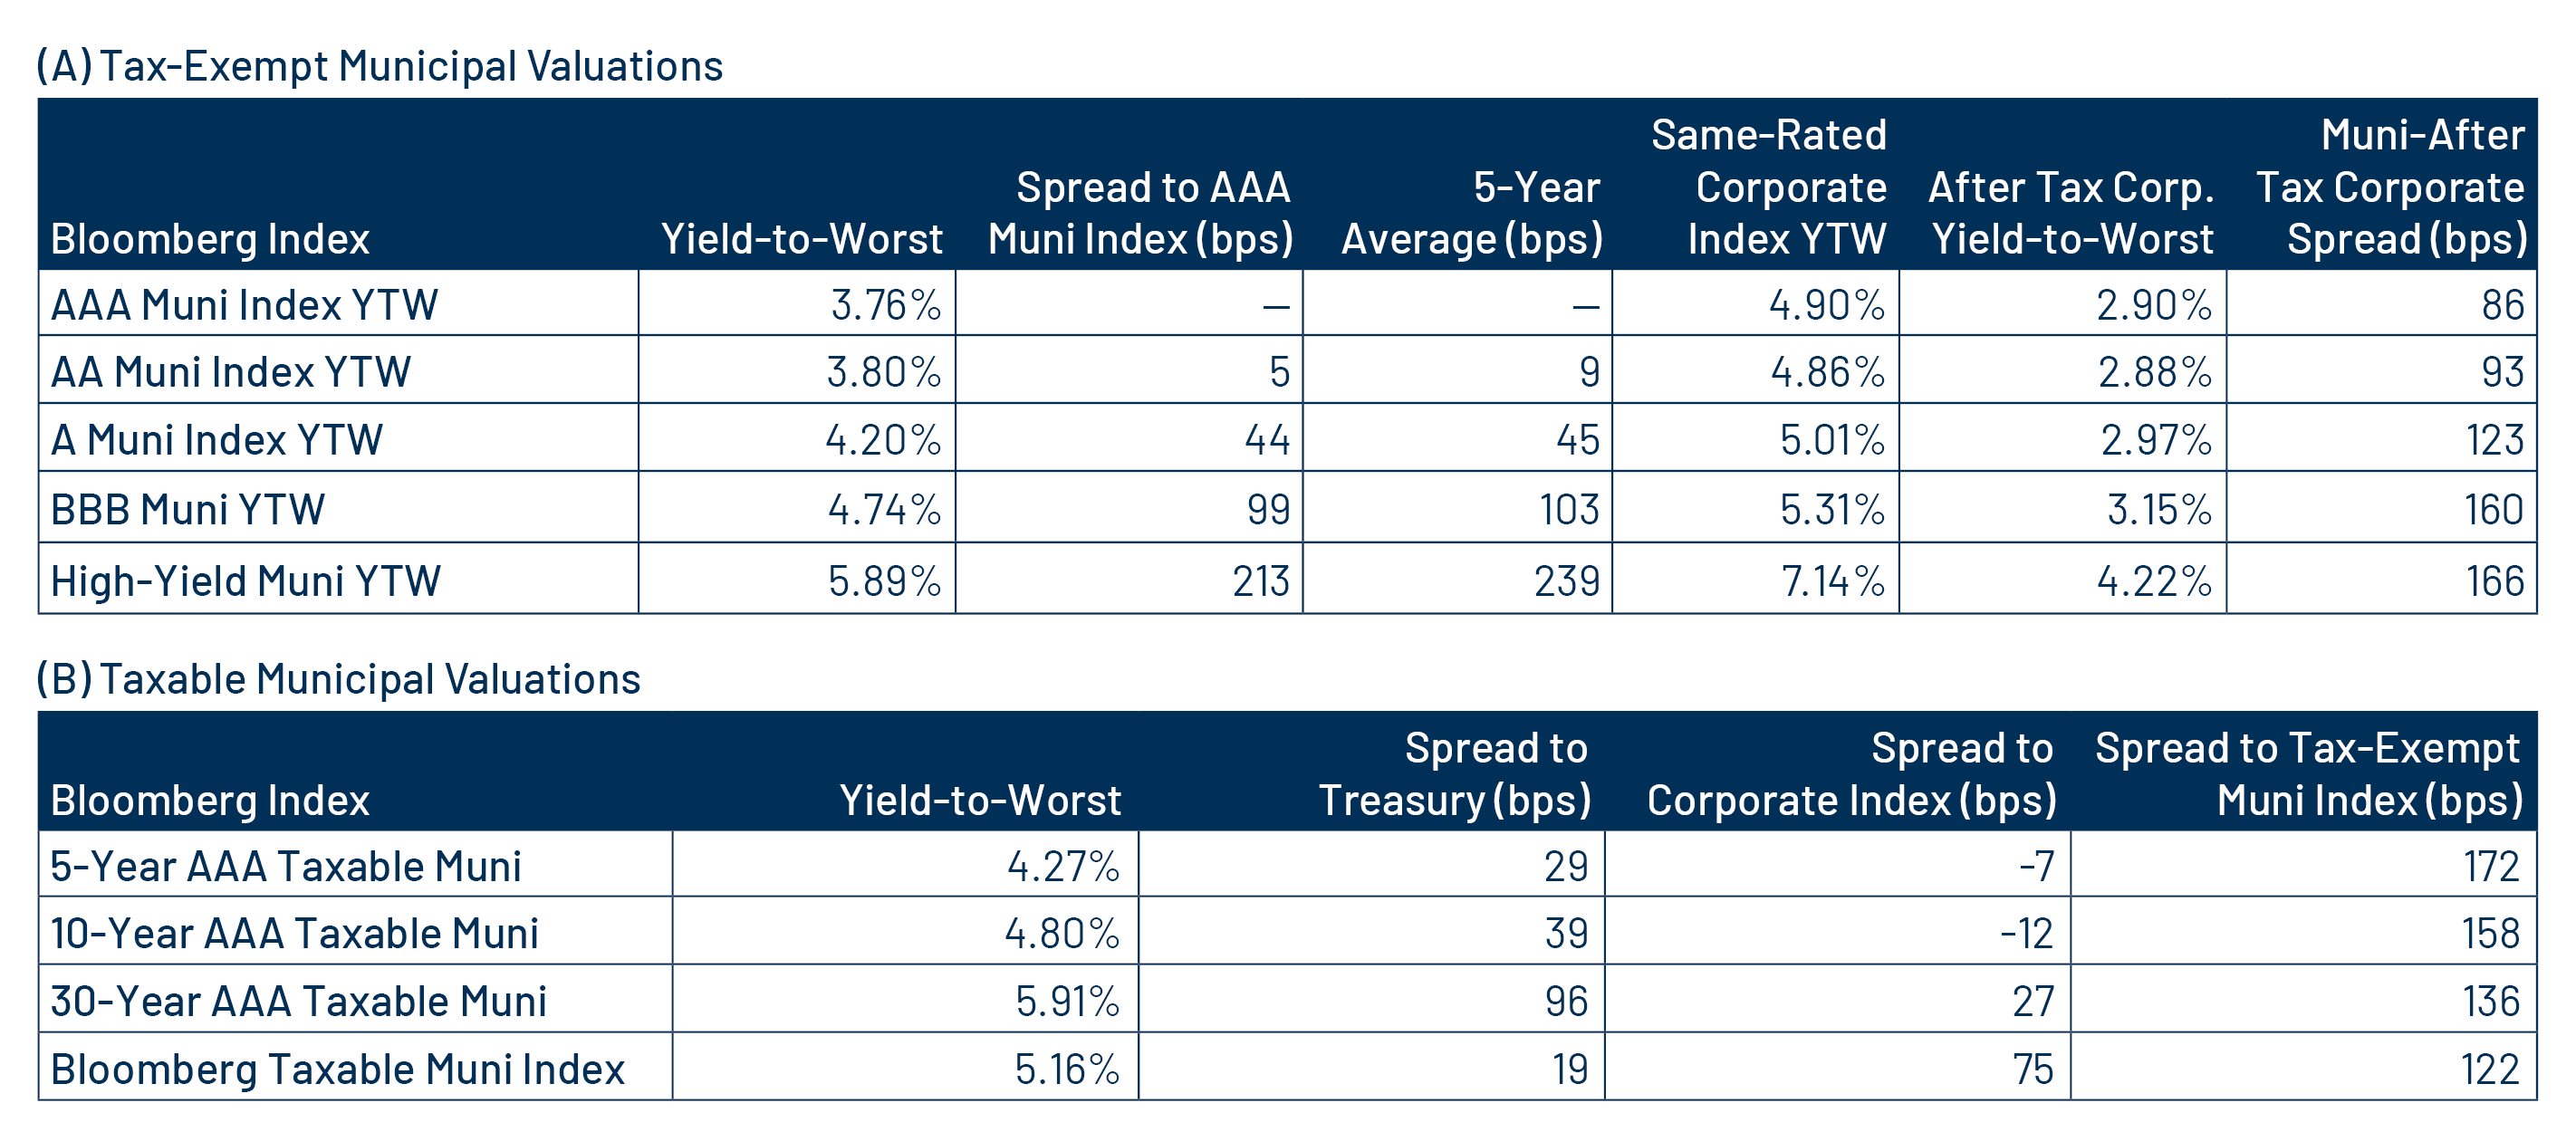
Theme #3: Munis offer attractive after-tax yield compared to taxable alternatives.

Exhibit 9: Municipal vs. Taxable Fixed-Income Yields by Quality
Municipal vs. Taxable Fixed-Income Yields by Quality
Source: Western Asset, Bloomberg. As 11 Jul 25. 10- and 30-Year comparison reflects Bloomberg Valuation Service (BVAL) AAA Muni Curve and US On-/Off-the-Run Sovereign Curve. AA Muni reflects the Bloomberg AA Muni Bond Index. A Muni reflects the Bloomberg A Muni Bond Index. BBB Muni reflects the Bloomberg BBB Muni Bond Index. HY Muni reflects the Bloomberg High Yield Muni Bond Index. AA Corp reflects the Bloomberg AA Corporate Bond Index. A Corp reflects the Bloomberg A Corporate Bond Index. BBB Corp reflects the Bloomberg BBB Corporate Bond Index. After-tax yield considers the top marginal tax rate of 40.8%. Indexes are unmanaged and one cannot directly invest in them. They do not include fees, expenses or sales charges. Past performance is not an indicator or a guarantee of future results. Select the image to expand the view.

© Western Asset Management Company, LLC 2025. The information contained in these materials ("the materials") is intended for the exclusive use of the designated recipient ("the recipient"). This information is proprietary and confidential and may contain commercially sensitive information, and may not be copied, reproduced or republished, in whole or in part, without the prior written consent of Western Asset Management Company ("Western Asset").
Past performance does not predict future returns. These materials should not be deemed to be a prediction or projection of future performance. These materials are intended for investment professionals including professional clients, eligible counterparties, and qualified investors only.
These materials have been produced for illustrative and informational purposes only. These materials contain Western Asset's opinions and beliefs as of the date designated on the materials; these views are subject to change and may not reflect real-time market developments and investment views.
Third party data may be used throughout the materials, and this data is believed to be accurate to the best of Western Asset's knowledge at the time of publication, but cannot be guaranteed. These materials may also contain strategy or product awards or rankings from independent third parties or industry publications which are based on unbiased quantitative and/or qualitative information determined independently by each third party or publication. In some cases, Western Asset may subscribe to these third party's standard industry services or publications. These standard subscriptions and services are available to all asset managers and do not influence rankings or awards in any way.
Investment strategies or products discussed herein may involve a high degree of risk, including the loss of some or all capital. Investments in any products or strategies described in these materials may be volatile, and investors should have the financial ability and willingness to accept such risks.
Unless otherwise noted, investment performance contained in these materials is reflective of a strategy composite. All other strategy data and information included in these materials reflects a representative portfolio which is an account in the composite that Western Asset believes most closely reflects the current portfolio management style of the strategy. Performance is not a consideration in the selection of the representative portfolio. The characteristics of the representative portfolio shown may differ from other accounts in the composite. Information regarding the representative portfolio and the other accounts in the composite are available upon request. Statements in these materials should not be considered investment advice. References, either general or specific, to securities and/or issuers in the materials are for illustrative purposes only and are not intended to be, and should not be interpreted as, recommendation to purchase or sell such securities. Employees and/or clients of Western Asset may have a position in the securities or issuers mentioned.
These materials are not intended to provide, and should not be relied on for, accounting, legal, tax, investment or other advice. The recipient should consult its own counsel, accountant, investment, tax, and any other advisers for this advice, including economic risks and merits, related to making an investment with Western Asset. The recipient is responsible for observing the applicable laws and regulations of their country of residence.
Founded in 1971, Western Asset Management Company is a global fixed-income investment manager with offices in Pasadena, New York, London, Singapore, Tokyo, Melbourne, São Paulo, Hong Kong, and Zürich. Western Asset is a wholly owned subsidiary of Franklin Resources, Inc. but operates autonomously. Western Asset is comprised of six legal entities across the globe, each with distinct regional registrations: Western Asset Management Company, LLC, a registered Investment Adviser with the Securities and Exchange Commission; Western Asset Management Company Ltda. is regulated by Comissão de Valores Mobiliários; Western Asset Management Company Pty Ltd ABN 41 117 767 923 is the holder of the Australian Financial Services License 303160; Western Asset Management Company Pte. Ltd. Co. Reg. No. 200007692R is a holder of a Capital Markets Services License for fund management and regulated by the Monetary Authority of Singapore; Western Asset Management Company Ltd, a registered Financial Instruments Business Operator and regulated by the Financial Services Agency of Japan; and Western Asset Management Company Limited is authorised and regulated by the Financial Conduct Authority ("FCA") (FRN 145930). This communication is intended for distribution to Professional Clients only if deemed to be a financial promotion in the UK as defined by the FCA. This communication may also be intended for certain EEA countries where Western Asset has been granted permission to do so. For the current list of the approved EEA countries please contact Western Asset at +44 (0)20 7422 3000.