skip navigation
Blog

Stay up to date on timely topics and market events. Subscribe to our Blog now.

ECONOMY
January 30, 2025

US Consumer Report Card—Fourth Quarter 2024

By Alba Abourjeili, CFA

Stay up to date on timely topics and market events. Subscribe to our Blog now.

Overall Score: B+
Trend: Stable
Our outlook for the US consumer remains strong since last quarter based on improved labor market data and consumer sentiment. The overall Western Asset Consumer Report Card grade has remained B+ for two quarters in a row. Although the recent positive consumer trend has been cooling from exceptionally strong readings during the time of peak pandemic stimulus, the current score of B+ (76%) is well above the average score of C+ (55%) seen from 2010 to 2019.
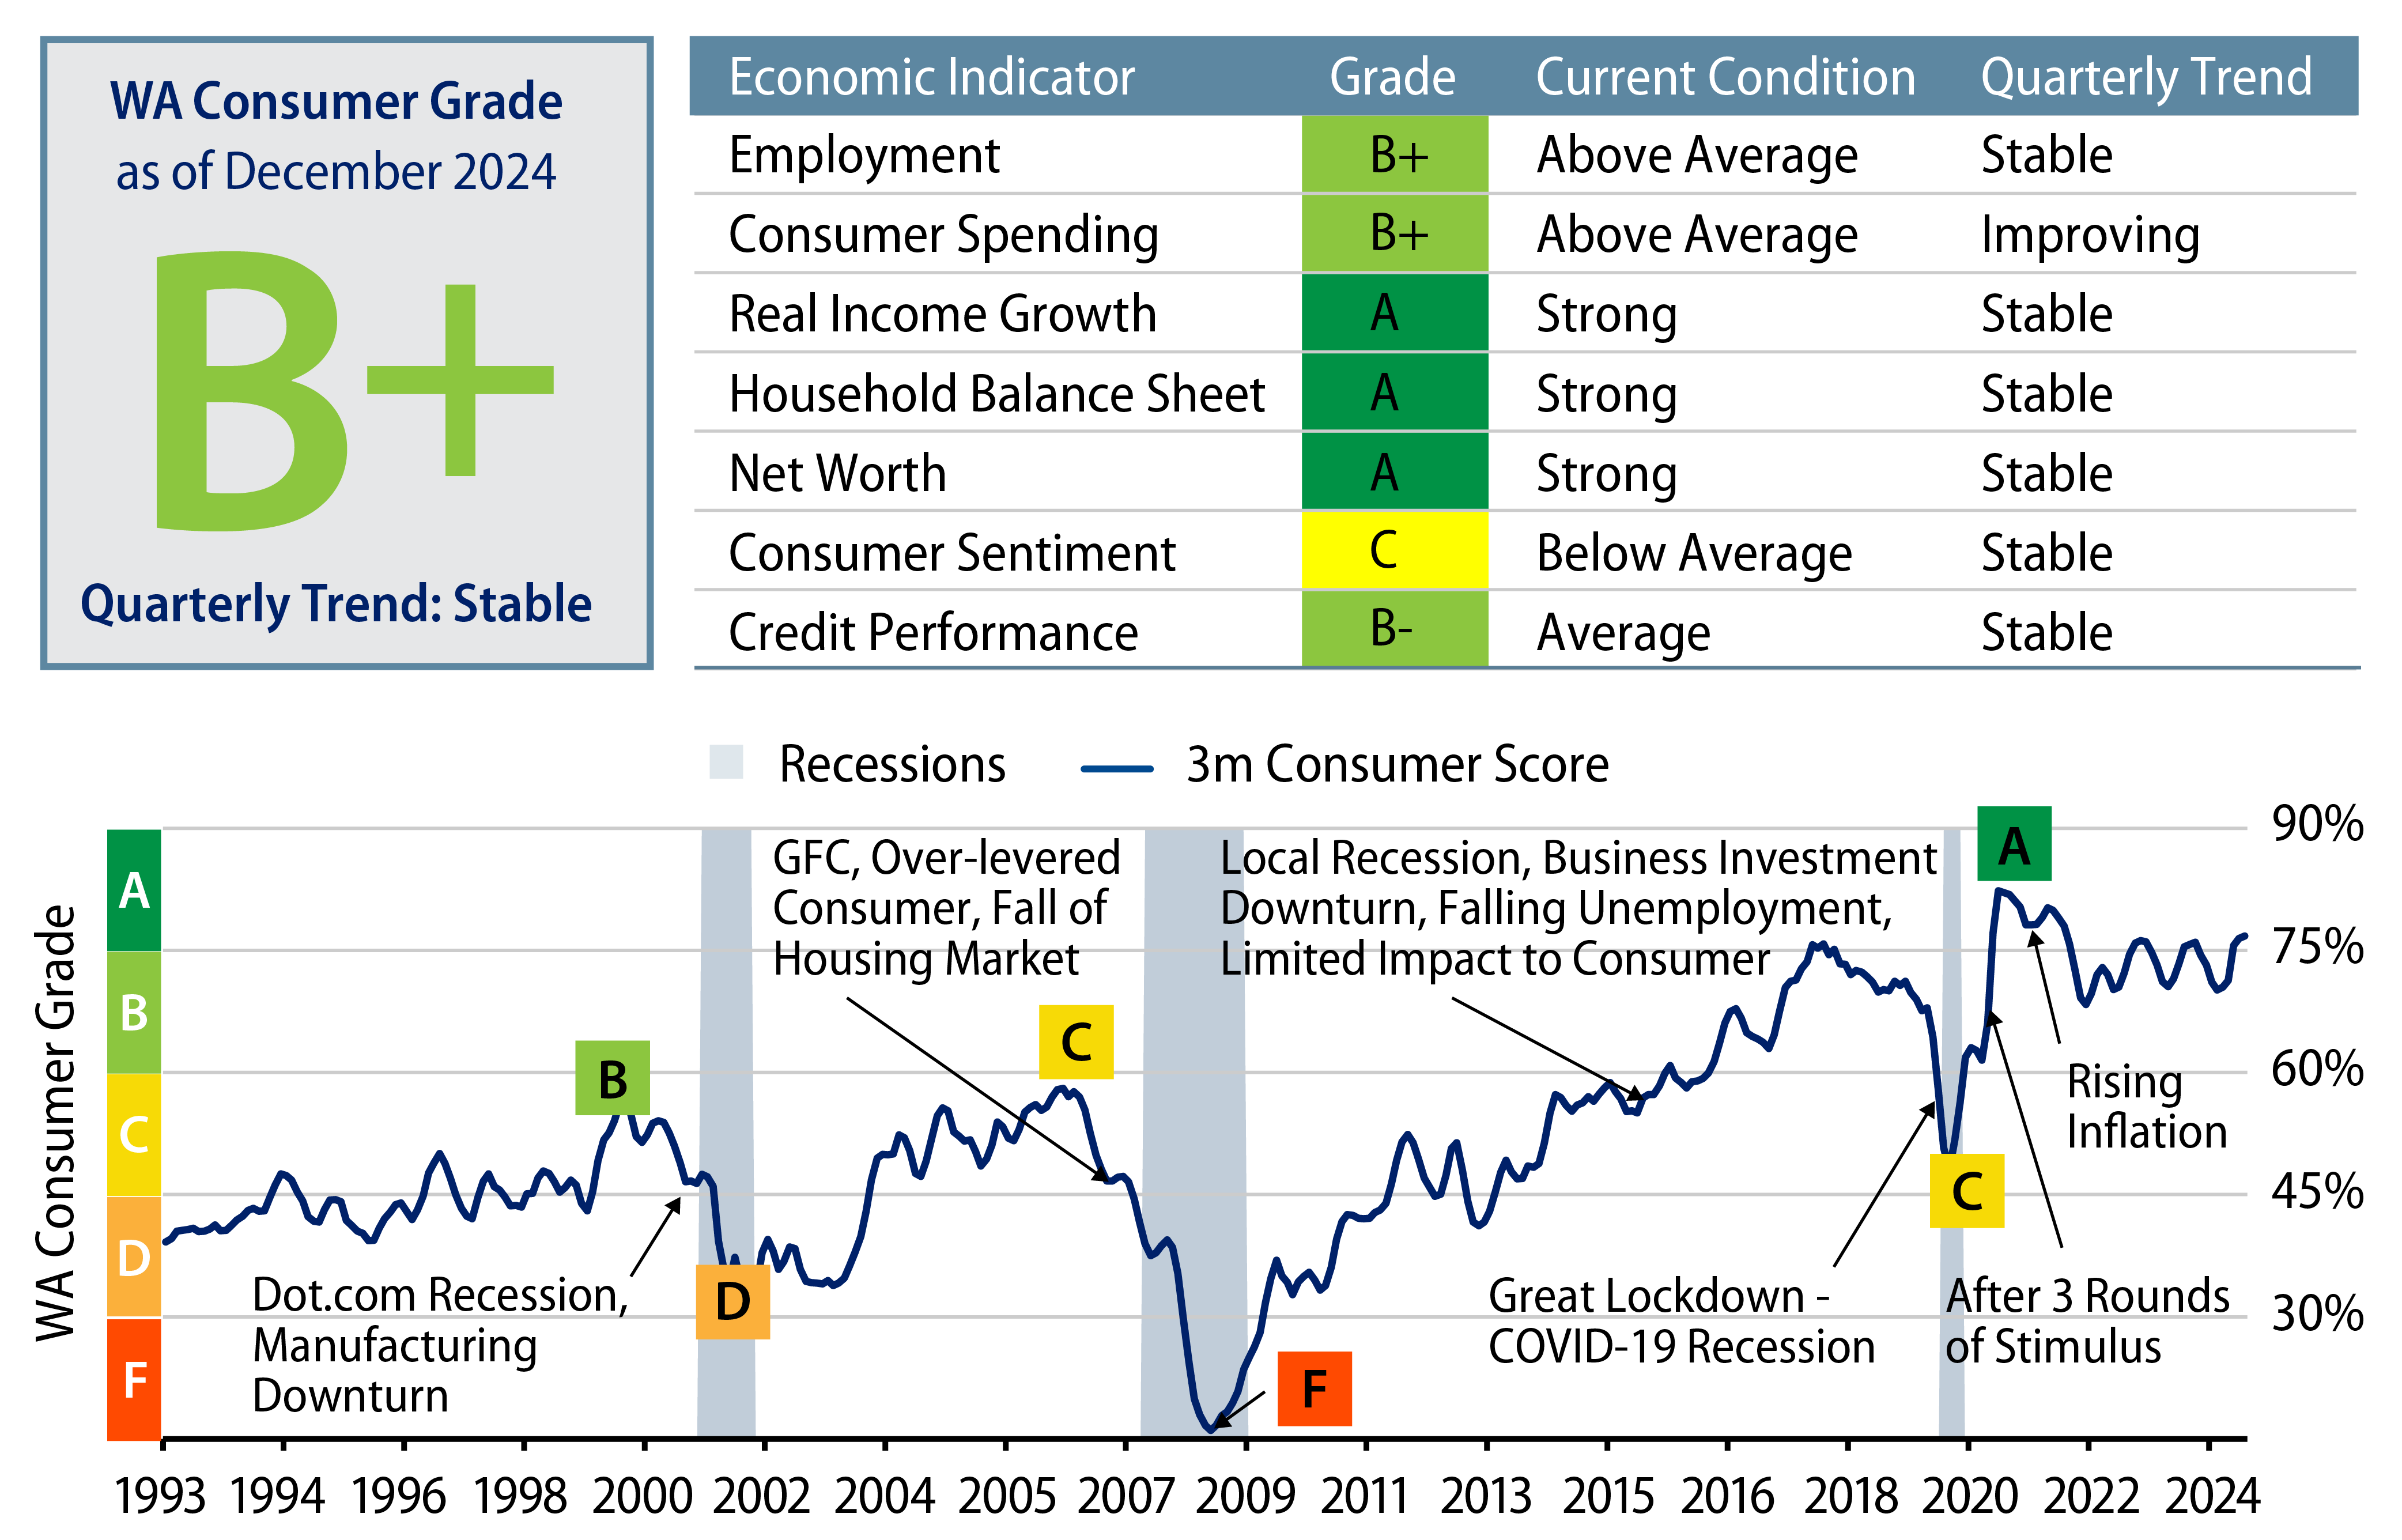
Exhibit 1: US Consumer Report Card—Fourth Quarter 2024
US Consumer Report Card—Fourth Quarter 2024
Source: Bureau of Economic Analysis, Federal Reserve Bank of New York, Federal Reserve Bank of St. Louis, Western Asset. The Western Asset Consumer Grade rating is based on a proprietary scoring system. We analyze economic variables that are most impactful toward consumer health (the unemployment rate, consumer spending, real income growth, the debt service coverage ratio, net worth, consumer sentiment and credit card delinquencies). For each variable time series, we rank the most recent print versus historical ranges and use a weighted average across these variables to come up with a score. We then map the score to a grade according to the following scale: A= 75-100; B= 60-75; C= 45-60; D= 30-45; F= <30. As of 31 Dec 24. Select the image to expand the view.

Employment: B+
Trend: Stable
The December unemployment rate fell to 4.1%, reversing the deterioration of the past two months and reducing concerns about a labor market slowdown. Job growth estimates also improved from last quarter as job openings increased in Q4, but the hiring rate is reflecting a weak labor market and lower than levels seen in the past decade. The quits rate also remains depressed at 1.9%. However, the rise in job openings signals further progress toward a lower unemployment rate and suggests that the labor market will continue to support household income and spending in 2025.

Consumer Spending: B+
Trend: Stable
Real consumer spending remained robust with a growth rate of 2.9% year-over-year (YoY). Recent data signaled strong spending growth as nominal retail sales rose by 0.4% in December and core retail sales rose by 0.8% in real terms. The US consumer continues to be a source of strength.

Real Income Growth: A
Trend: Stable
Real disposable income growth declined to 2.6% YoY in November due to slower growth of transfer income (i.e., government program income) and asset income following the declining trend since 2023 highs. Continued job gains and strong real wage growth are expected to drive continued real income growth in 2025, with all income quartiles falling in a narrow range.

Household Balance Sheets: A
Trend: Stable
The annualized rate of growth in consumer credit picked up to 1.7% YoY, led by growth in fixed-rate debt, but continues to grow below long-term trends. Household leverage and debt servicing costs remain low by historical standards despite high consumer financing rates.

Wealth/Net Worth: A
Trend: Stable
The net worth to disposable personal income ratio remains close to the all-time high due to strong asset price appreciation over the past year, skewed toward higher-income households. The savings rate ticked down to 4.4% in November and remains at a level consistent with strong balance sheets and a healthy labor market. It’s expected to remain rangebound for the rest of 2025.

Consumer Sentiment: C
Trend: Stable
University of Michigan’s consumer sentiment index increased by 2.2 points in December from November, but the January preliminary print declined 0.8 points. The Conference Board’s index declined by 8.1 points in December. The January preliminary decline comes from consumers expecting higher rates and tariffs to increase the cost of living. However, both indices showed incremental improvement from September.

Credit Performance: B-
Trend: Stable
Credit card delinquency rates showed signs of leveling off in Q4 as new seriously delinquent and new delinquent credit card balances ticked down. Credit performance deteriorated at a slower pace than in prior quarters, indicating that tighter lending standards are having the desired impact on the high credit consumer.

Consumers saw steady credit utilization reflecting cautious spending trends in November and December. Consumer performance for the 2023 vintage is now on par with that of 2022, which was the worst to date for prime and subprime auto loans. The termination of pandemic-related relief programs, higher inflation, and rising debt levels and interest rates along with looser post-pandemic lending standards have pressured performance for the 2022 and first half of 2023 consumer vintages. We expect performance to stabilize as we begin 2025, supported by tight lending standards, persistently strong household balance sheets and the possibility that a meaningful portion of expected weakness in credit performance has already occurred.

The US consumer remains a source of strength for the US economy, and significant deterioration would be required to return to historical averages. However, bifurcation between the lower- and higher-income consumer is more pronounced in the current economic environment. Affordability remains pressured for lower-income cohorts due to higher asset prices, persistently higher rates, increased insurance premiums and the potential for rising prices amid new tariffs. In this environment, we favor investing in high-quality consumer credit, including private student loans, housing-adjacent consumer sectors and prime auto loans. We remain cautious of subprime consumer assets.

Background on Methodology

Our methodology rationale for creating the US Consumer Report Card first involves ranking economic indicators versus a historical dataset, with tracked periodic changes going back to 1990. We then calculate a weighted average score for each month. Assigned weights range from 24% at the highest to 10% at the lowest. Employment, consumer spending and real income growth make up 40%, while the remaining indicators comprise 60%. The consumer score is mapped against letter grades, normalized for historical experience.

© Western Asset Management Company, LLC 2025. The information contained in these materials ("the materials") is intended for the exclusive use of the designated recipient ("the recipient"). This information is proprietary and confidential and may contain commercially sensitive information, and may not be copied, reproduced or republished, in whole or in part, without the prior written consent of Western Asset Management Company ("Western Asset").
Past performance does not predict future returns. These materials should not be deemed to be a prediction or projection of future performance. These materials are intended for investment professionals including professional clients, eligible counterparties, and qualified investors only.
These materials have been produced for illustrative and informational purposes only. These materials contain Western Asset's opinions and beliefs as of the date designated on the materials; these views are subject to change and may not reflect real-time market developments and investment views.
Third party data may be used throughout the materials, and this data is believed to be accurate to the best of Western Asset's knowledge at the time of publication, but cannot be guaranteed. These materials may also contain strategy or product awards or rankings from independent third parties or industry publications which are based on unbiased quantitative and/or qualitative information determined independently by each third party or publication. In some cases, Western Asset may subscribe to these third party's standard industry services or publications. These standard subscriptions and services are available to all asset managers and do not influence rankings or awards in any way.
Investment strategies or products discussed herein may involve a high degree of risk, including the loss of some or all capital. Investments in any products or strategies described in these materials may be volatile, and investors should have the financial ability and willingness to accept such risks.
Unless otherwise noted, investment performance contained in these materials is reflective of a strategy composite. All other strategy data and information included in these materials reflects a representative portfolio which is an account in the composite that Western Asset believes most closely reflects the current portfolio management style of the strategy. Performance is not a consideration in the selection of the representative portfolio. The characteristics of the representative portfolio shown may differ from other accounts in the composite. Information regarding the representative portfolio and the other accounts in the composite are available upon request. Statements in these materials should not be considered investment advice. References, either general or specific, to securities and/or issuers in the materials are for illustrative purposes only and are not intended to be, and should not be interpreted as, recommendation to purchase or sell such securities. Employees and/or clients of Western Asset may have a position in the securities or issuers mentioned.
These materials are not intended to provide, and should not be relied on for, accounting, legal, tax, investment or other advice. The recipient should consult its own counsel, accountant, investment, tax, and any other advisers for this advice, including economic risks and merits, related to making an investment with Western Asset. The recipient is responsible for observing the applicable laws and regulations of their country of residence.
Founded in 1971, Western Asset Management Company is a global fixed-income investment manager with offices in Pasadena, New York, London, Singapore, Tokyo, Melbourne, São Paulo, Hong Kong, and Zürich. Western Asset is a wholly owned subsidiary of Franklin Resources, Inc. but operates autonomously. Western Asset is comprised of six legal entities across the globe, each with distinct regional registrations: Western Asset Management Company, LLC, a registered Investment Adviser with the Securities and Exchange Commission; Western Asset Management Company Distribuidora de Títulos e Valores Mobiliários Limitada is authorized and regulated by Comissão de Valores Mobiliários and Brazilian Central Bank; Western Asset Management Company Pty Ltd ABN 41 117 767 923 is the holder of the Australian Financial Services License 303160; Western Asset Management Company Pte. Ltd. Co. Reg. No. 200007692R is a holder of a Capital Markets Services License for fund management and regulated by the Monetary Authority of Singapore; Western Asset Management Company Ltd, a registered Financial Instruments Business Operator and regulated by the Financial Services Agency of Japan; and Western Asset Management Company Limited is authorised and regulated by the Financial Conduct Authority ("FCA") (FRN 145930). This communication is intended for distribution to Professional Clients only if deemed to be a financial promotion in the UK as defined by the FCA. This communication may also be intended for certain EEA countries where Western Asset has been granted permission to do so. For the current list of the approved EEA countries please contact Western Asset at +44 (0)20 7422 3000.