skip navigation
Blog

Stay up to date on timely topics and market events. Subscribe to our Blog now.

ECONOMY
June 02, 2025

US Consumer Report Card—First Quarter 2025

By Alba Abourjeili, CFA

Stay up to date on timely topics and market events. Subscribe to our Blog now.

Overall Score: B
Trend: Deteriorating
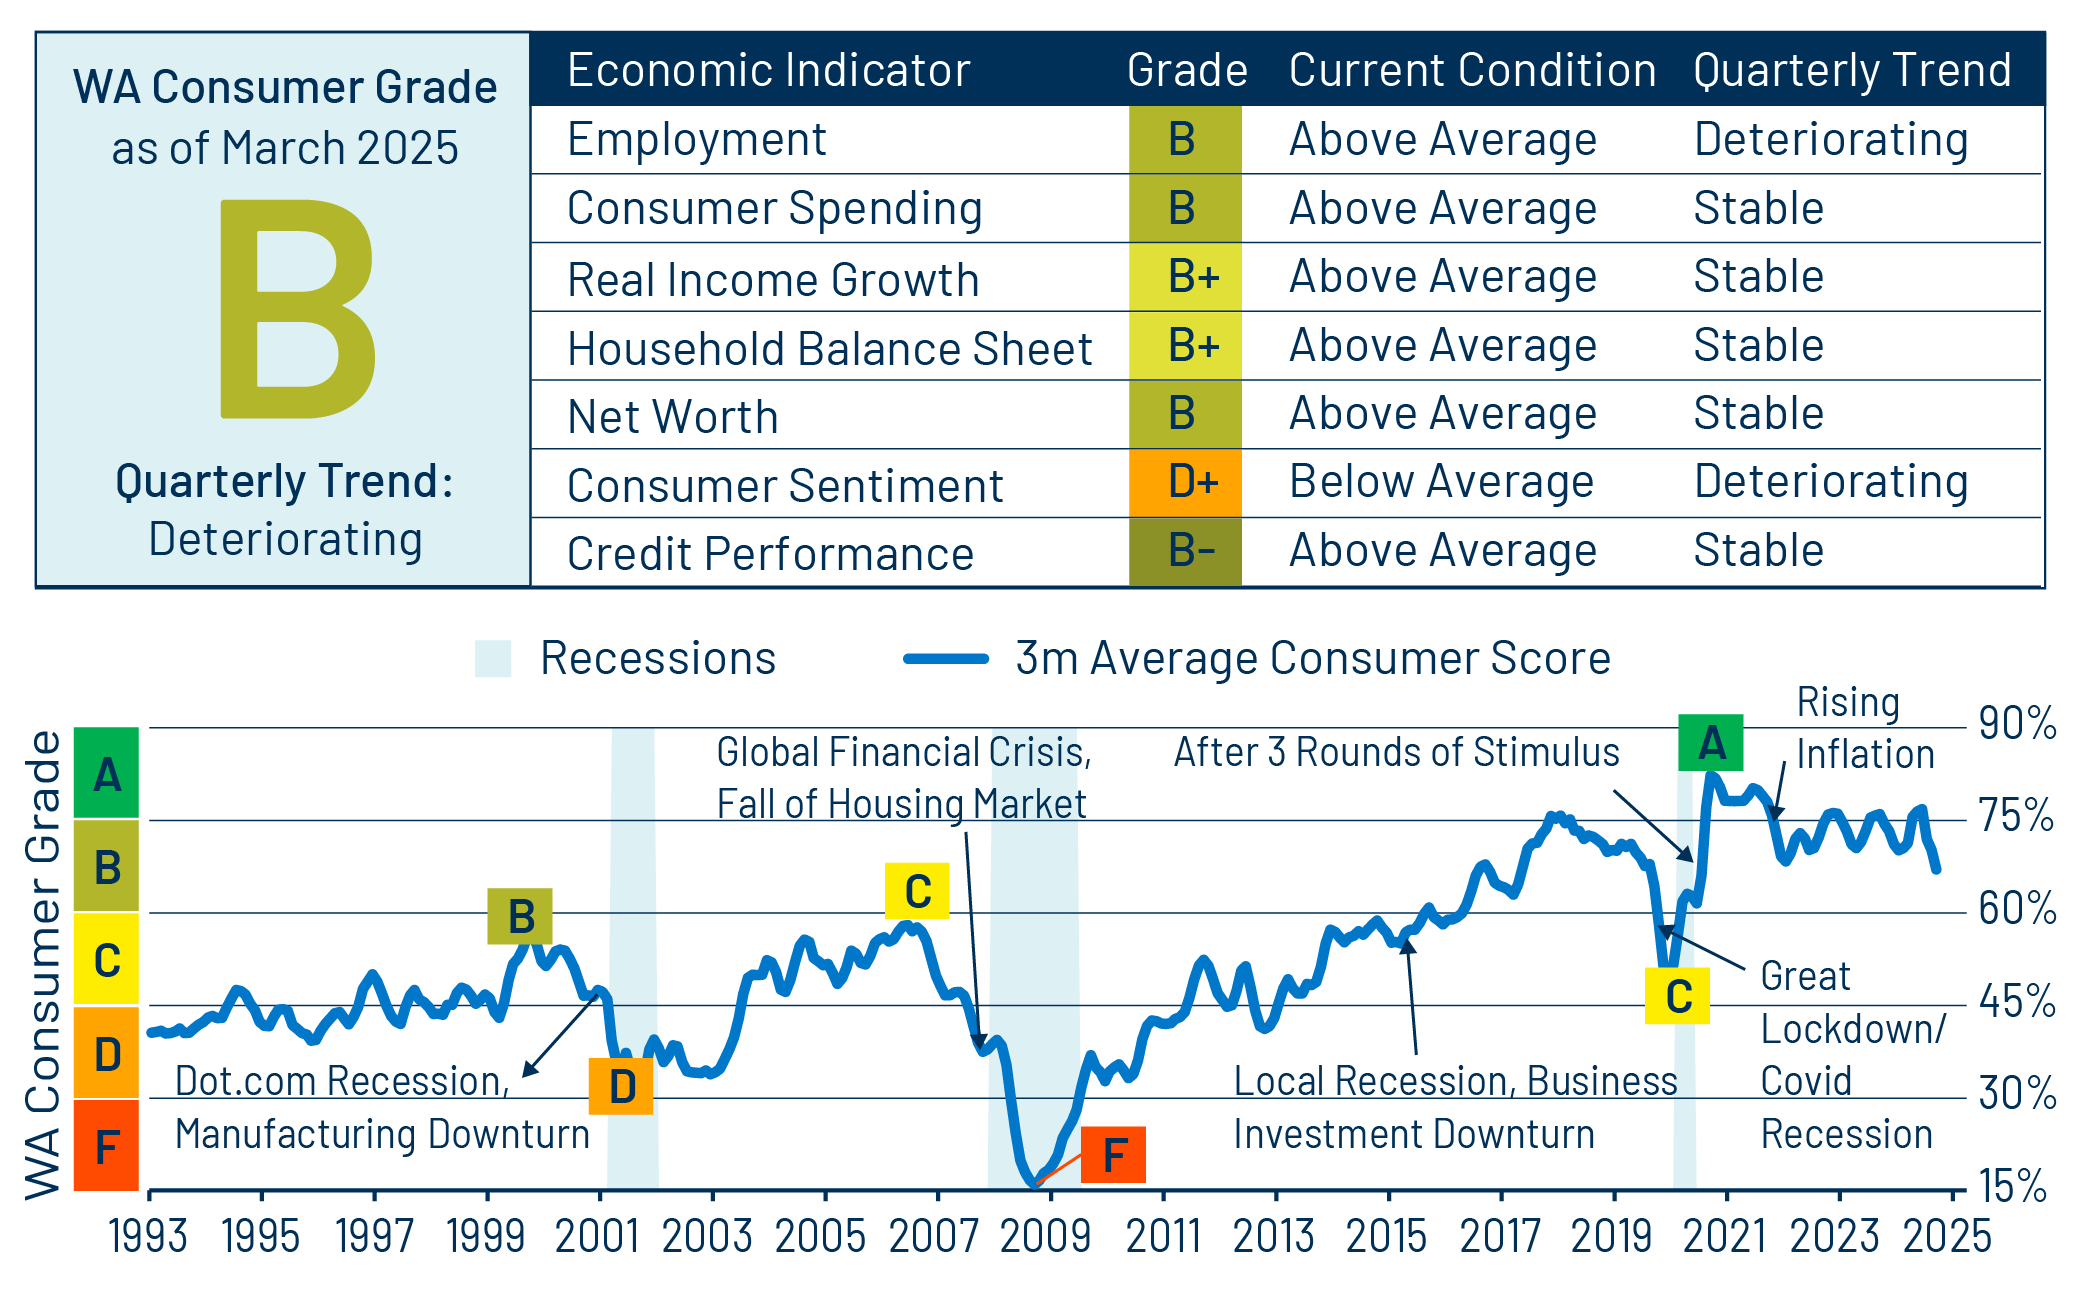
Our outlook for the US consumer has deteriorated since last quarter, notching down from B+ to B. Most metrics show a gradual decline, with the largest impact on consumer sentiment due to uncertainty over the policy and inflation outlook. Although the recent consumer trend has been cooling from exceptionally strong readings at the time of peak stimulus during the pandemic, the current score of B (68%) remains well above the average score of C+ (55%) seen from 2010 to 2019. The quarterly trend is on the decline, and we expect further deterioration in economic indicators over the next few quarters given the challenging macroeconomic backdrop due to the uncertainty regarding tariffs along with higher inflation putting further pressure on US consumer health.

Exhibit 1: US Consumer Report Card—First Quarter 2025
US Consumer Report Card—First Quarter 2025
Source: Bureau of Economic Analysis, Federal Reserve Bank of New York, Federal Reserve Bank of St. Louis, Western Asset. As of 30 Mar 25. The Western Asset Consumer Grade rating is based on a proprietary scoring system. We analyze economic variables that are most impactful toward consumer health (the unemployment rate, consumer spending, real income growth, the debt service coverage ratio, net worth, consumer sentiment and credit card delinquencies). For each variable time series, we rank the most recent print versus historical ranges and use a weighted average across these variables to come up with a score. We then map the score to a grade according to the following scale: A= 75-100; B= 60-75; C= 45-60; D= 30-45; F= <30. Select the image to expand the view.

Employment: B
Trend: Deteriorating
The unemployment rate for March rose to 4.2%, reversing any improvement seen early in the year, increasing 0.2% from January. The labor market remains weak. The job openings rate declined in March, marking a four-year low, and part-time employment increased meaningfully, reflecting a challenging hiring environment. The hiring rate remains lower than it has been during the past decade. Expect further pressure due to a slowdown in immigration and government hiring, which will likely affect payroll growth.

Consumer Spending: B
Trend: Stable
Real consumer spending ticked down and the growth trend slowed to a 2.6% six-month annualized rate. March retail sales were stronger than expected, +1.4% month-over-month, as consumers frontloaded purchases led by motor vehicles ahead of expected higher prices due to impending tariff increases. Despite the slowdown, spending remains robust. Real consumer spending is expected to slow down following the administration’s tariff increases.

Real Income Growth: B+
Trend: Stable
Real disposable income growth continued to decline by 0.4% in Q1 to 1.8% on a year-over-year (YoY) basis due to slower growth of transfer income (i.e., government program income) and asset income, following the declining trend since 2023 highs. Expectations for higher inflation due to tariffs and the slower pace of job growth point toward a further slowing of real income growth.

Household Balance Sheets: B+
Trend: Stable
The rate of growth in consumer credit declined 0.85% YoY. Both revolving and fixed-rate debt declined in Q1 on an annualized basis, as demand for credit cooled. Household leverage and debt servicing costs remain low by historical standards, even though bifurcation between higher-income and lower-income consumers persists, and the lower-credit/lower-income subset of consumers remains under pressure.

Wealth/Net Worth: B
Trend: Stable
The net-worth-to-disposable-personal-income ratio and household equity remain elevated despite the pullback in equity prices. The savings rate ticked up to 3.9% in March, rising from a restated 3.3% rate in December 2024, and is expected to remain rangebound around 4% for the rest of the year.

Consumer Sentiment: D+
Trend: Deteriorating
University of Michigan’s consumer sentiment pulled back by 17 points since December 2024; the Conference Board’s index similarly declined by 15 points in December. These are both significant declines reflecting policy uncertainty and consumers’ concerns about rising inflation due to expected tariff increases. As a result, consumer sentiment is expected to remain volatile.

Credit Performance: B-
Trend: Stable
Credit card delinquency rates continued to level off in 1Q25, as new and seriously delinquent balances ticked down from December. Credit performance deteriorated at a slower pace than in prior quarters, which is a positive outcome, indicating that tighter lending standards are having the desired impact for the high-credit consumer.

1Q25 US Consumer Credit Summary

US consumer new credit originations for personal loans and credit cards slowed in Q1, reflecting cautious spending trends and tighter bank lending standards. Consumer credit utilization ratios fell slightly, indicating that borrowers are paying down balances. We expect to see credit scores falling for borrowers with defaulted student loans, as the administration has resumed collections. Later in the year, a larger subset of federal student loan borrowers who are currently in forbearance are expected to resume payments, and delinquencies are likely to increase, putting upward pressure on delinquencies for other consumer debt such as unsecured consumer loans, buy-now-pay-later and subprime auto loans.

Bifurcation between higher- and lower-income consumers is becoming more pronounced in the current economic environment. Affordability remains pressured for lower-income cohorts due to higher asset prices, higher financing rates and expectations for rising prices given increased tariffs. For challenged consumer credit, delinquencies are trending higher, but are not translating into higher losses, which we view as a sign of manageable stress. Persistent inflation, higher asset prices and a higher unemployment rate could translate to higher loss rates.

In this environment, we favor investing in high-quality consumer credit—such as private student loans, consumer sectors related to housing and prime auto loans—and we prefer positions higher up in the capital structure. We remain cautious about subprime consumer assets.

Background on Methodology

Our methodology rationale for creating the US Consumer Report Card first involves ranking economic indicators versus a historical dataset, with tracked periodic changes going back to 1990. We then calculate a weighted average score for each month. Assigned weights range from a high of 23% to a low of 10%. Employment, consumer spending and real income growth make up 60%, while the remaining indicators comprise 40%. The consumer score is mapped against letter grades, normalized for historical experience.

© Western Asset Management Company, LLC 2025. The information contained in these materials ("the materials") is intended for the exclusive use of the designated recipient ("the recipient"). This information is proprietary and confidential and may contain commercially sensitive information, and may not be copied, reproduced or republished, in whole or in part, without the prior written consent of Western Asset Management Company ("Western Asset").
Past performance does not predict future returns. These materials should not be deemed to be a prediction or projection of future performance. These materials are intended for investment professionals including professional clients, eligible counterparties, and qualified investors only.
These materials have been produced for illustrative and informational purposes only. These materials contain Western Asset's opinions and beliefs as of the date designated on the materials; these views are subject to change and may not reflect real-time market developments and investment views.
Third party data may be used throughout the materials, and this data is believed to be accurate to the best of Western Asset's knowledge at the time of publication, but cannot be guaranteed. These materials may also contain strategy or product awards or rankings from independent third parties or industry publications which are based on unbiased quantitative and/or qualitative information determined independently by each third party or publication. In some cases, Western Asset may subscribe to these third party's standard industry services or publications. These standard subscriptions and services are available to all asset managers and do not influence rankings or awards in any way.
Investment strategies or products discussed herein may involve a high degree of risk, including the loss of some or all capital. Investments in any products or strategies described in these materials may be volatile, and investors should have the financial ability and willingness to accept such risks.
Unless otherwise noted, investment performance contained in these materials is reflective of a strategy composite. All other strategy data and information included in these materials reflects a representative portfolio which is an account in the composite that Western Asset believes most closely reflects the current portfolio management style of the strategy. Performance is not a consideration in the selection of the representative portfolio. The characteristics of the representative portfolio shown may differ from other accounts in the composite. Information regarding the representative portfolio and the other accounts in the composite are available upon request. Statements in these materials should not be considered investment advice. References, either general or specific, to securities and/or issuers in the materials are for illustrative purposes only and are not intended to be, and should not be interpreted as, recommendation to purchase or sell such securities. Employees and/or clients of Western Asset may have a position in the securities or issuers mentioned.
These materials are not intended to provide, and should not be relied on for, accounting, legal, tax, investment or other advice. The recipient should consult its own counsel, accountant, investment, tax, and any other advisers for this advice, including economic risks and merits, related to making an investment with Western Asset. The recipient is responsible for observing the applicable laws and regulations of their country of residence.
Founded in 1971, Western Asset Management Company is a global fixed-income investment manager with offices in Pasadena, New York, London, Singapore, Tokyo, Melbourne, São Paulo, Hong Kong, and Zürich. Western Asset is a wholly owned subsidiary of Franklin Resources, Inc. but operates autonomously. Western Asset is comprised of six legal entities across the globe, each with distinct regional registrations: Western Asset Management Company, LLC, a registered Investment Adviser with the Securities and Exchange Commission; Western Asset Management Company Ltda. is regulated by Comissão de Valores Mobiliários; Western Asset Management Company Pty Ltd ABN 41 117 767 923 is the holder of the Australian Financial Services License 303160; Western Asset Management Company Pte. Ltd. Co. Reg. No. 200007692R is a holder of a Capital Markets Services License for fund management and regulated by the Monetary Authority of Singapore; Western Asset Management Company Ltd, a registered Financial Instruments Business Operator and regulated by the Financial Services Agency of Japan; and Western Asset Management Company Limited is authorised and regulated by the Financial Conduct Authority ("FCA") (FRN 145930). This communication is intended for distribution to Professional Clients only if deemed to be a financial promotion in the UK as defined by the FCA. This communication may also be intended for certain EEA countries where Western Asset has been granted permission to do so. For the current list of the approved EEA countries please contact Western Asset at +44 (0)20 7422 3000.