

Cash Flow Matching Is Within Reach of Most Plans and Offers a Viable Alternative to
Pension Risk Transfer
The Cruise Control Option
Cash flow matching, which is better known as cash flow driven investment (CDI) in the UK, has been an integral part of liability-driven investing (LDI) solutions for the last decade and a half. Adoption of cash flow matching has mostly been reserved to only well-funded mature plans in the past. Recent aggressive Federal Reserve (Fed) policy has not only led to some of the highest yields for short-term government bonds and investment-grade credit in the last decade and a half, but also resulted in a very flat investment-grade credit yield curve. The current combination of higher yields, a flat credit curve and lower liability durations presents an opportunity for some corporate pension plans to cash flow match their liabilities with the smallest upfront investment in the last 15 years. However, this window of opportunity might not last very long if the futures market is correct and a normal sloping credit curve returns.
In this blog post we explore the following:
- What is the minimum required funded ratio to implement cash flow matching?
- Can cash flow matching be used as a cheaper alternative to pension risk transfer (PRT)?
- The case for partial cash flow matching
Cash Flow Matching Eliminates Rebalancing, Drawdown and Liquidity Risk
Most corporate pension plans in the US still have a significant allocation to risk assets1 and are subject to funded status and contribution volatility due to the less correlated nature of those assets to the liabilities. Implementing a traditional LDI strategy reduces the duration mismatch between the pension plan’s assets and liabilities, but does not completely eliminate funded status volatility. Benefit payments still need to be made irrespective of market performance and traditional LDI does not address the risk of forced sales (also known as liquidity risk) in distressed markets to help pay for benefits.
Cash flow match investing is another form of LDI, but it differs from traditional LDI in that it goes beyond simply reducing the overall duration and key-rate duration mismatches between assets and liabilities. Cash flow matching is an investment approach that closely aligns a portfolio’s cash flows (coupons plus principal repayments) with a plan’s anticipated benefit payments. For example, corporate bonds offer a series of coupon payments with a final principal payment. These predictable cashflows from a laddered bond portfolio can be used to self-fund benefit payments. This lessens the administrative burden of frequent manager withdrawal requests and reduces transaction cost of asset allocation recalibration.
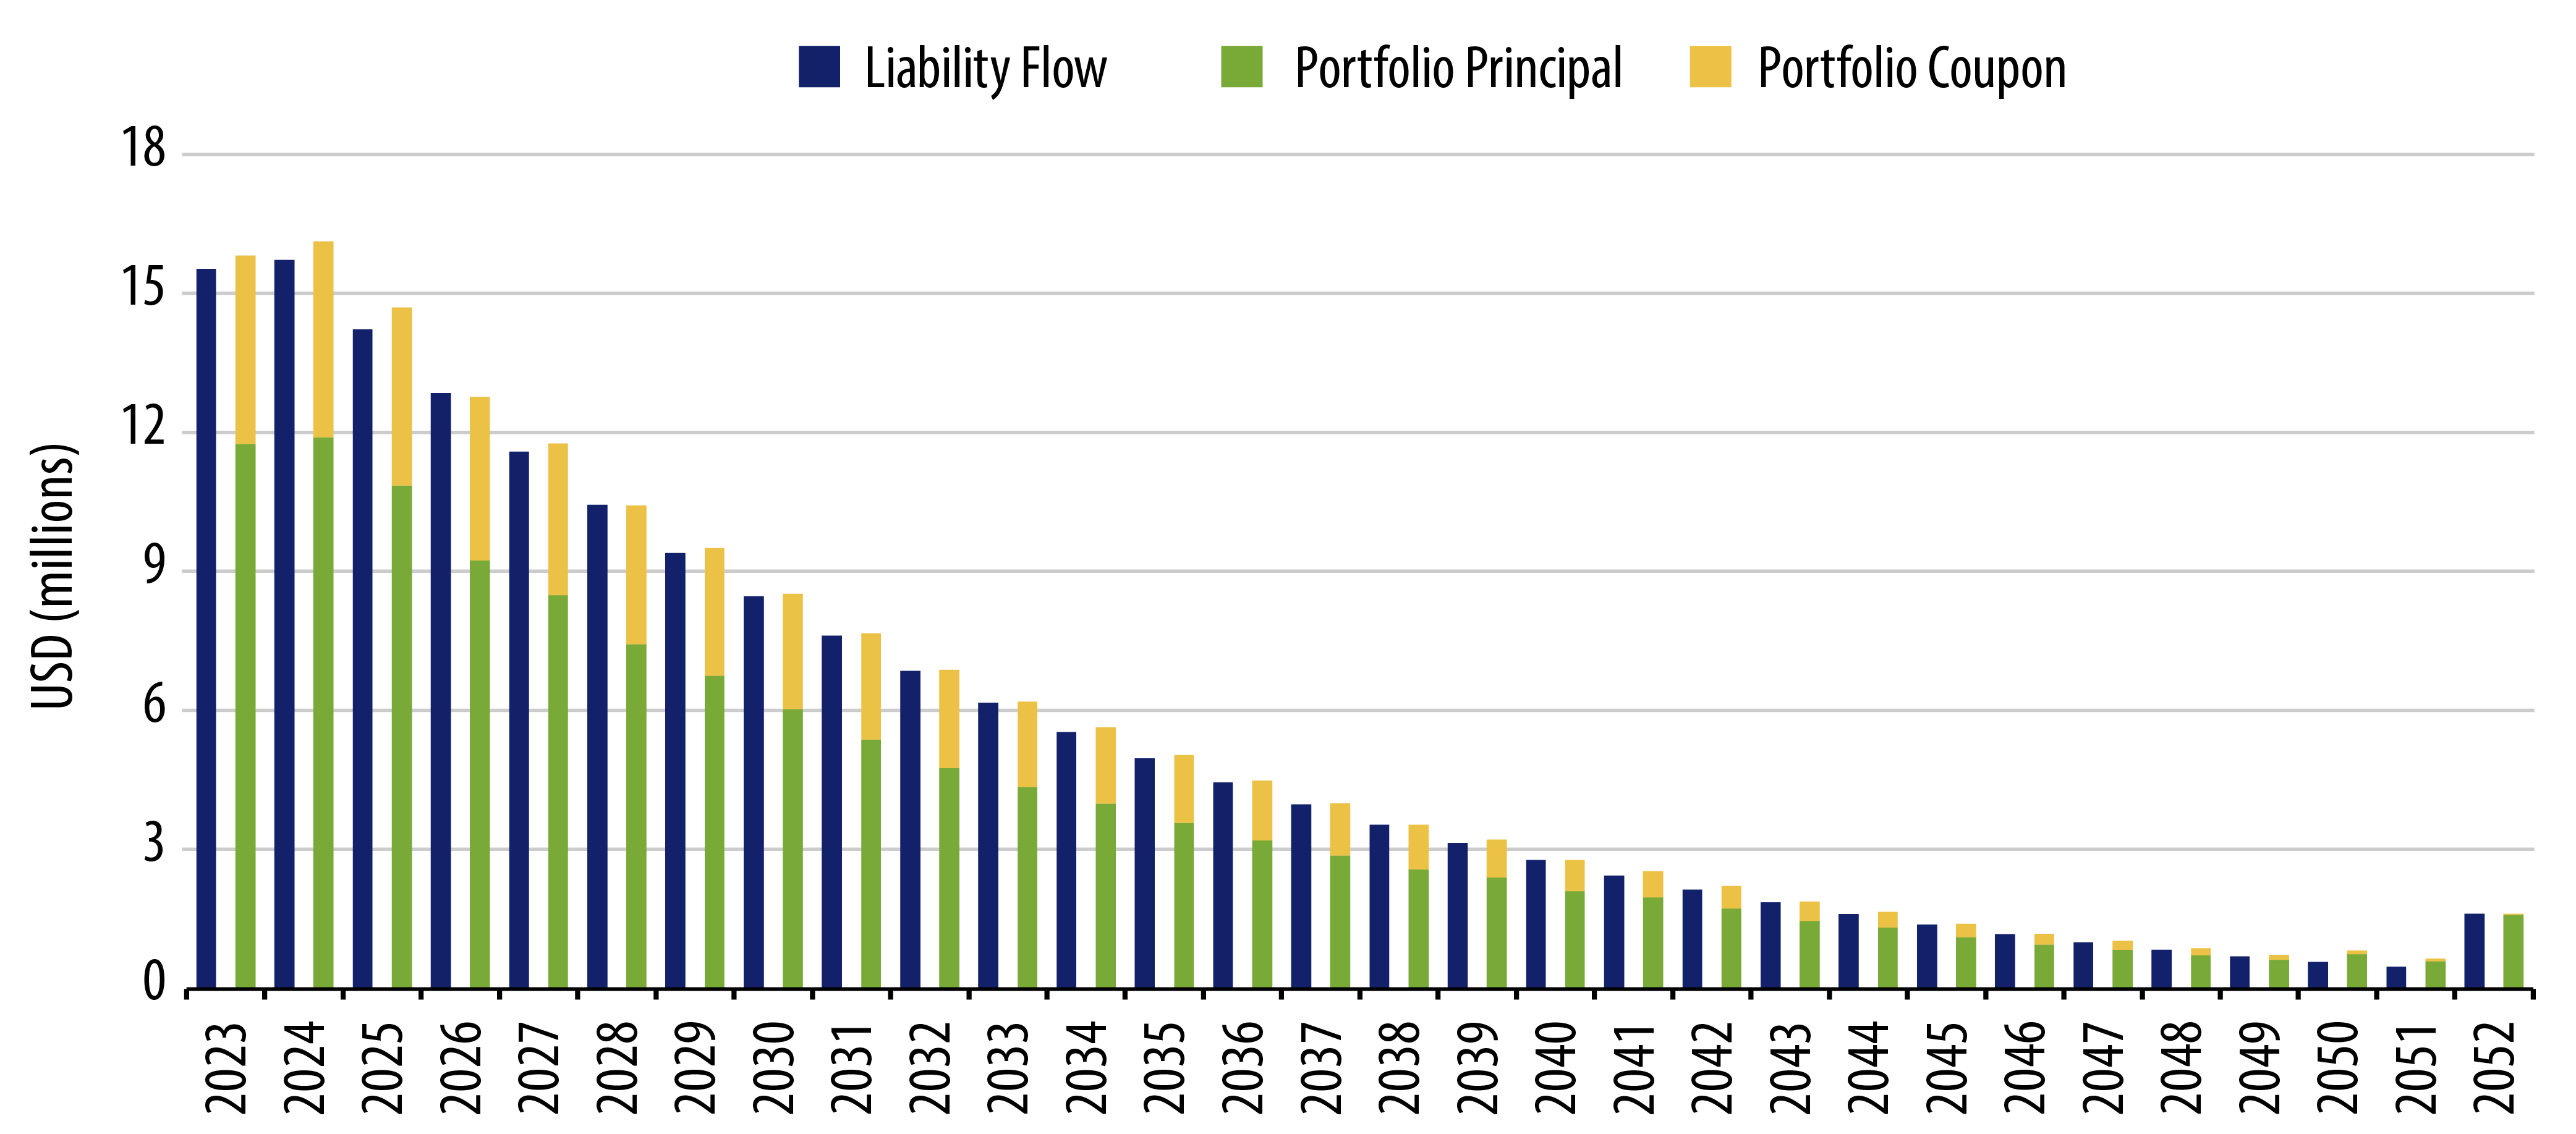
Exhibit 1 illustrates an example of a well-constructed cash flow matching portfolio where the principal and coupon payments slightly exceed the projected benefit payments annually.
Why Now and What Has Changed?
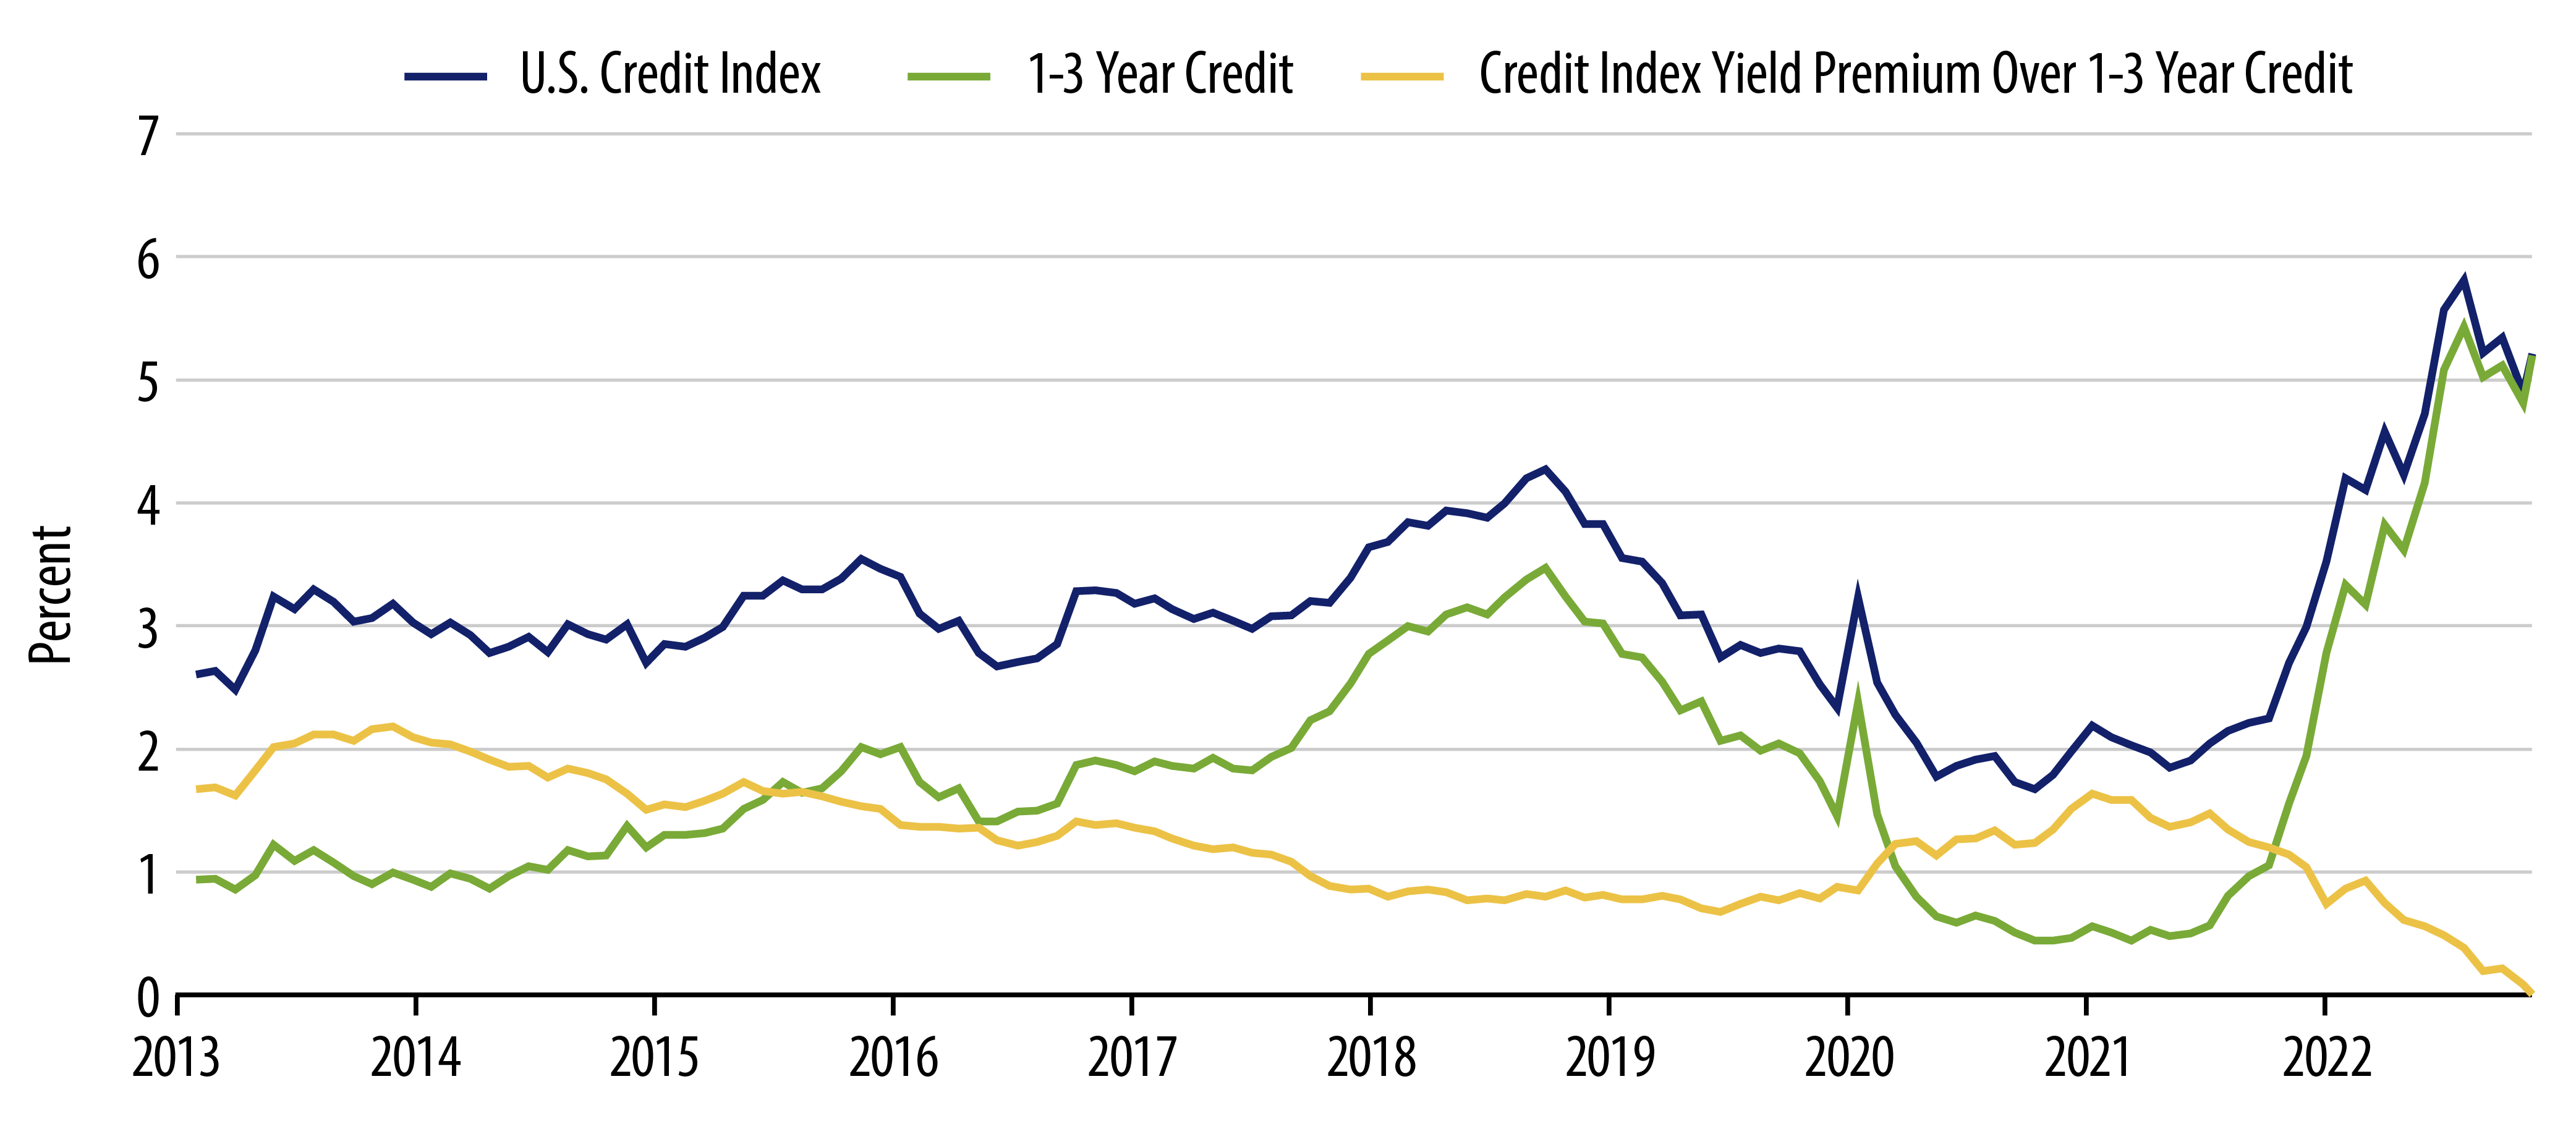
Over the last 12 months the Fed has increased the target fed funds rate by a cumulative 4.50%, the most since 1980. At the same time, the yield on the Bloomberg U.S. Credit Index increased by 2.96% to 5.20% from December 31, 2021 to February 14, 2023. The change in shorter maturity credit yields is even more pronounced, with current yields at 5.20% for the Bloomberg 1-3 Year U.S. Credit Index, an increase of 3.79%.
Another way to look at the opportunity is to compare the yields on individual securities today with those of a year ago. For example, General Motors Financial bonds maturing on 10/15/2024 (rated BBB and Baa3) are yielding 5.60% today compared to only 1.50% in January 2022, according to Bloomberg.
This increase in yields means pension plans can defease the same projected liability payments today with substantially less funds compared to any time during the previous decade and a half.
As you can see in Exhibit 2, there is currently no liquidity premium or yield advantage for going out on the credit curve.
Exploring Three Different Cash Flow Matching Options
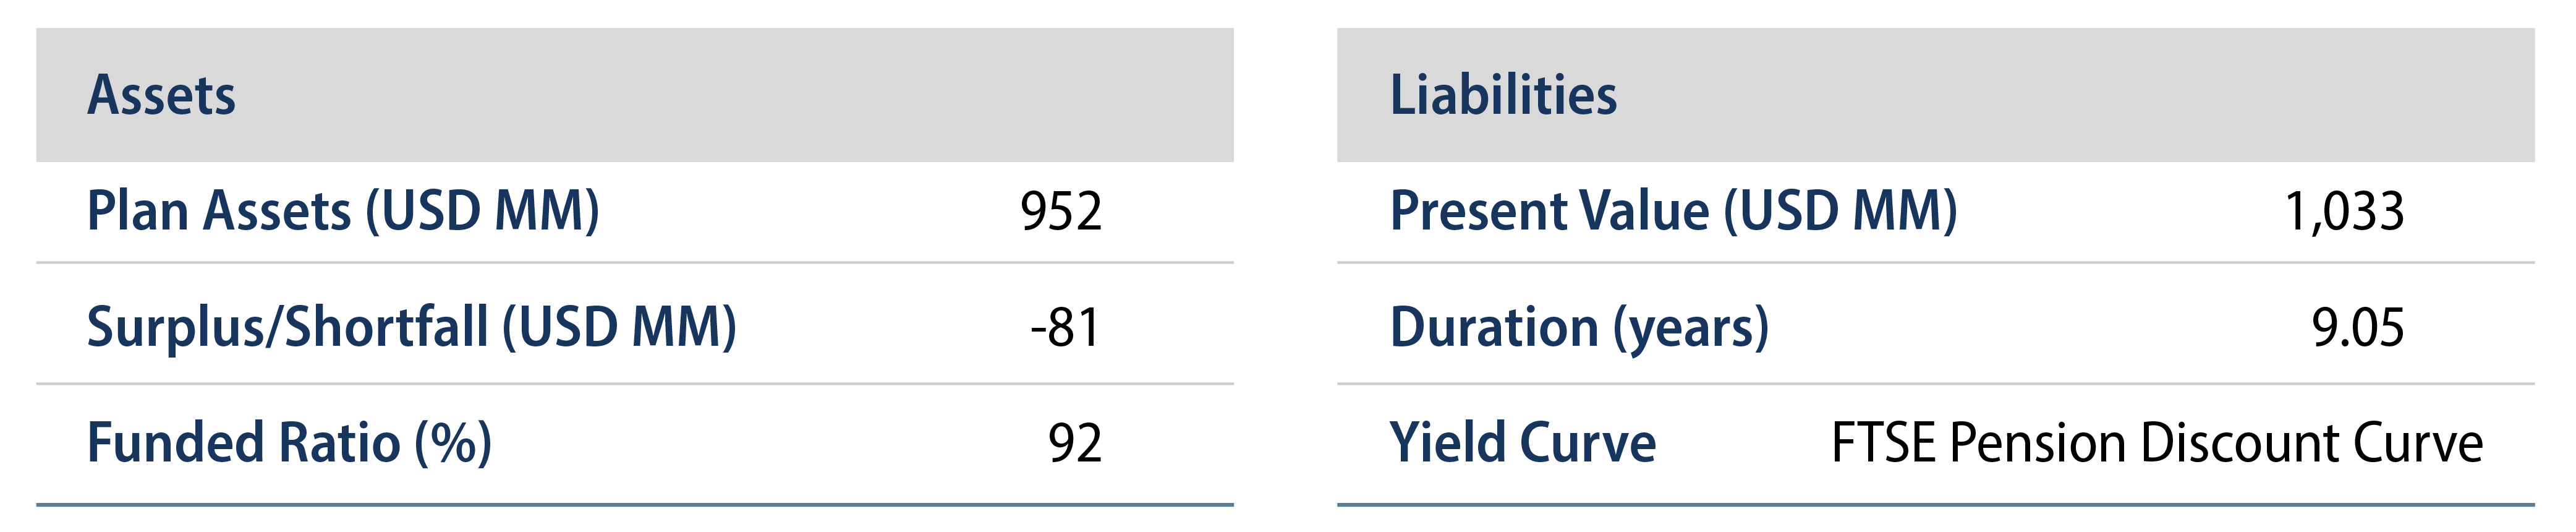
Let’s look at three cash flow matching options available to the following pension plan with $952 million in assets compared to a liability with a present value of $1.033 billion.
Option 1: What Is the Minimum Required Funded Ratio to Implement Cash Flow Matching?
This scenario determines the minimum amount of assets needed to satisfy the cash flow needs without incorporating any client-specific restrictions on issuers, subsectors, ratings or Western Asset’s bottom-up research.
In the model portfolio we limit issuers to Treasuries and investment-grade credit securities (2% max per security) and limit BBB rated securities to no more than 35% of the portfolio (compared to 44.8% for the Bloomberg U.S. Credit Index) to create an A- rated portfolio. Liability cash flows beyond 30 years are discounted to the 30-year point using a conservative 2.82% discount factor.
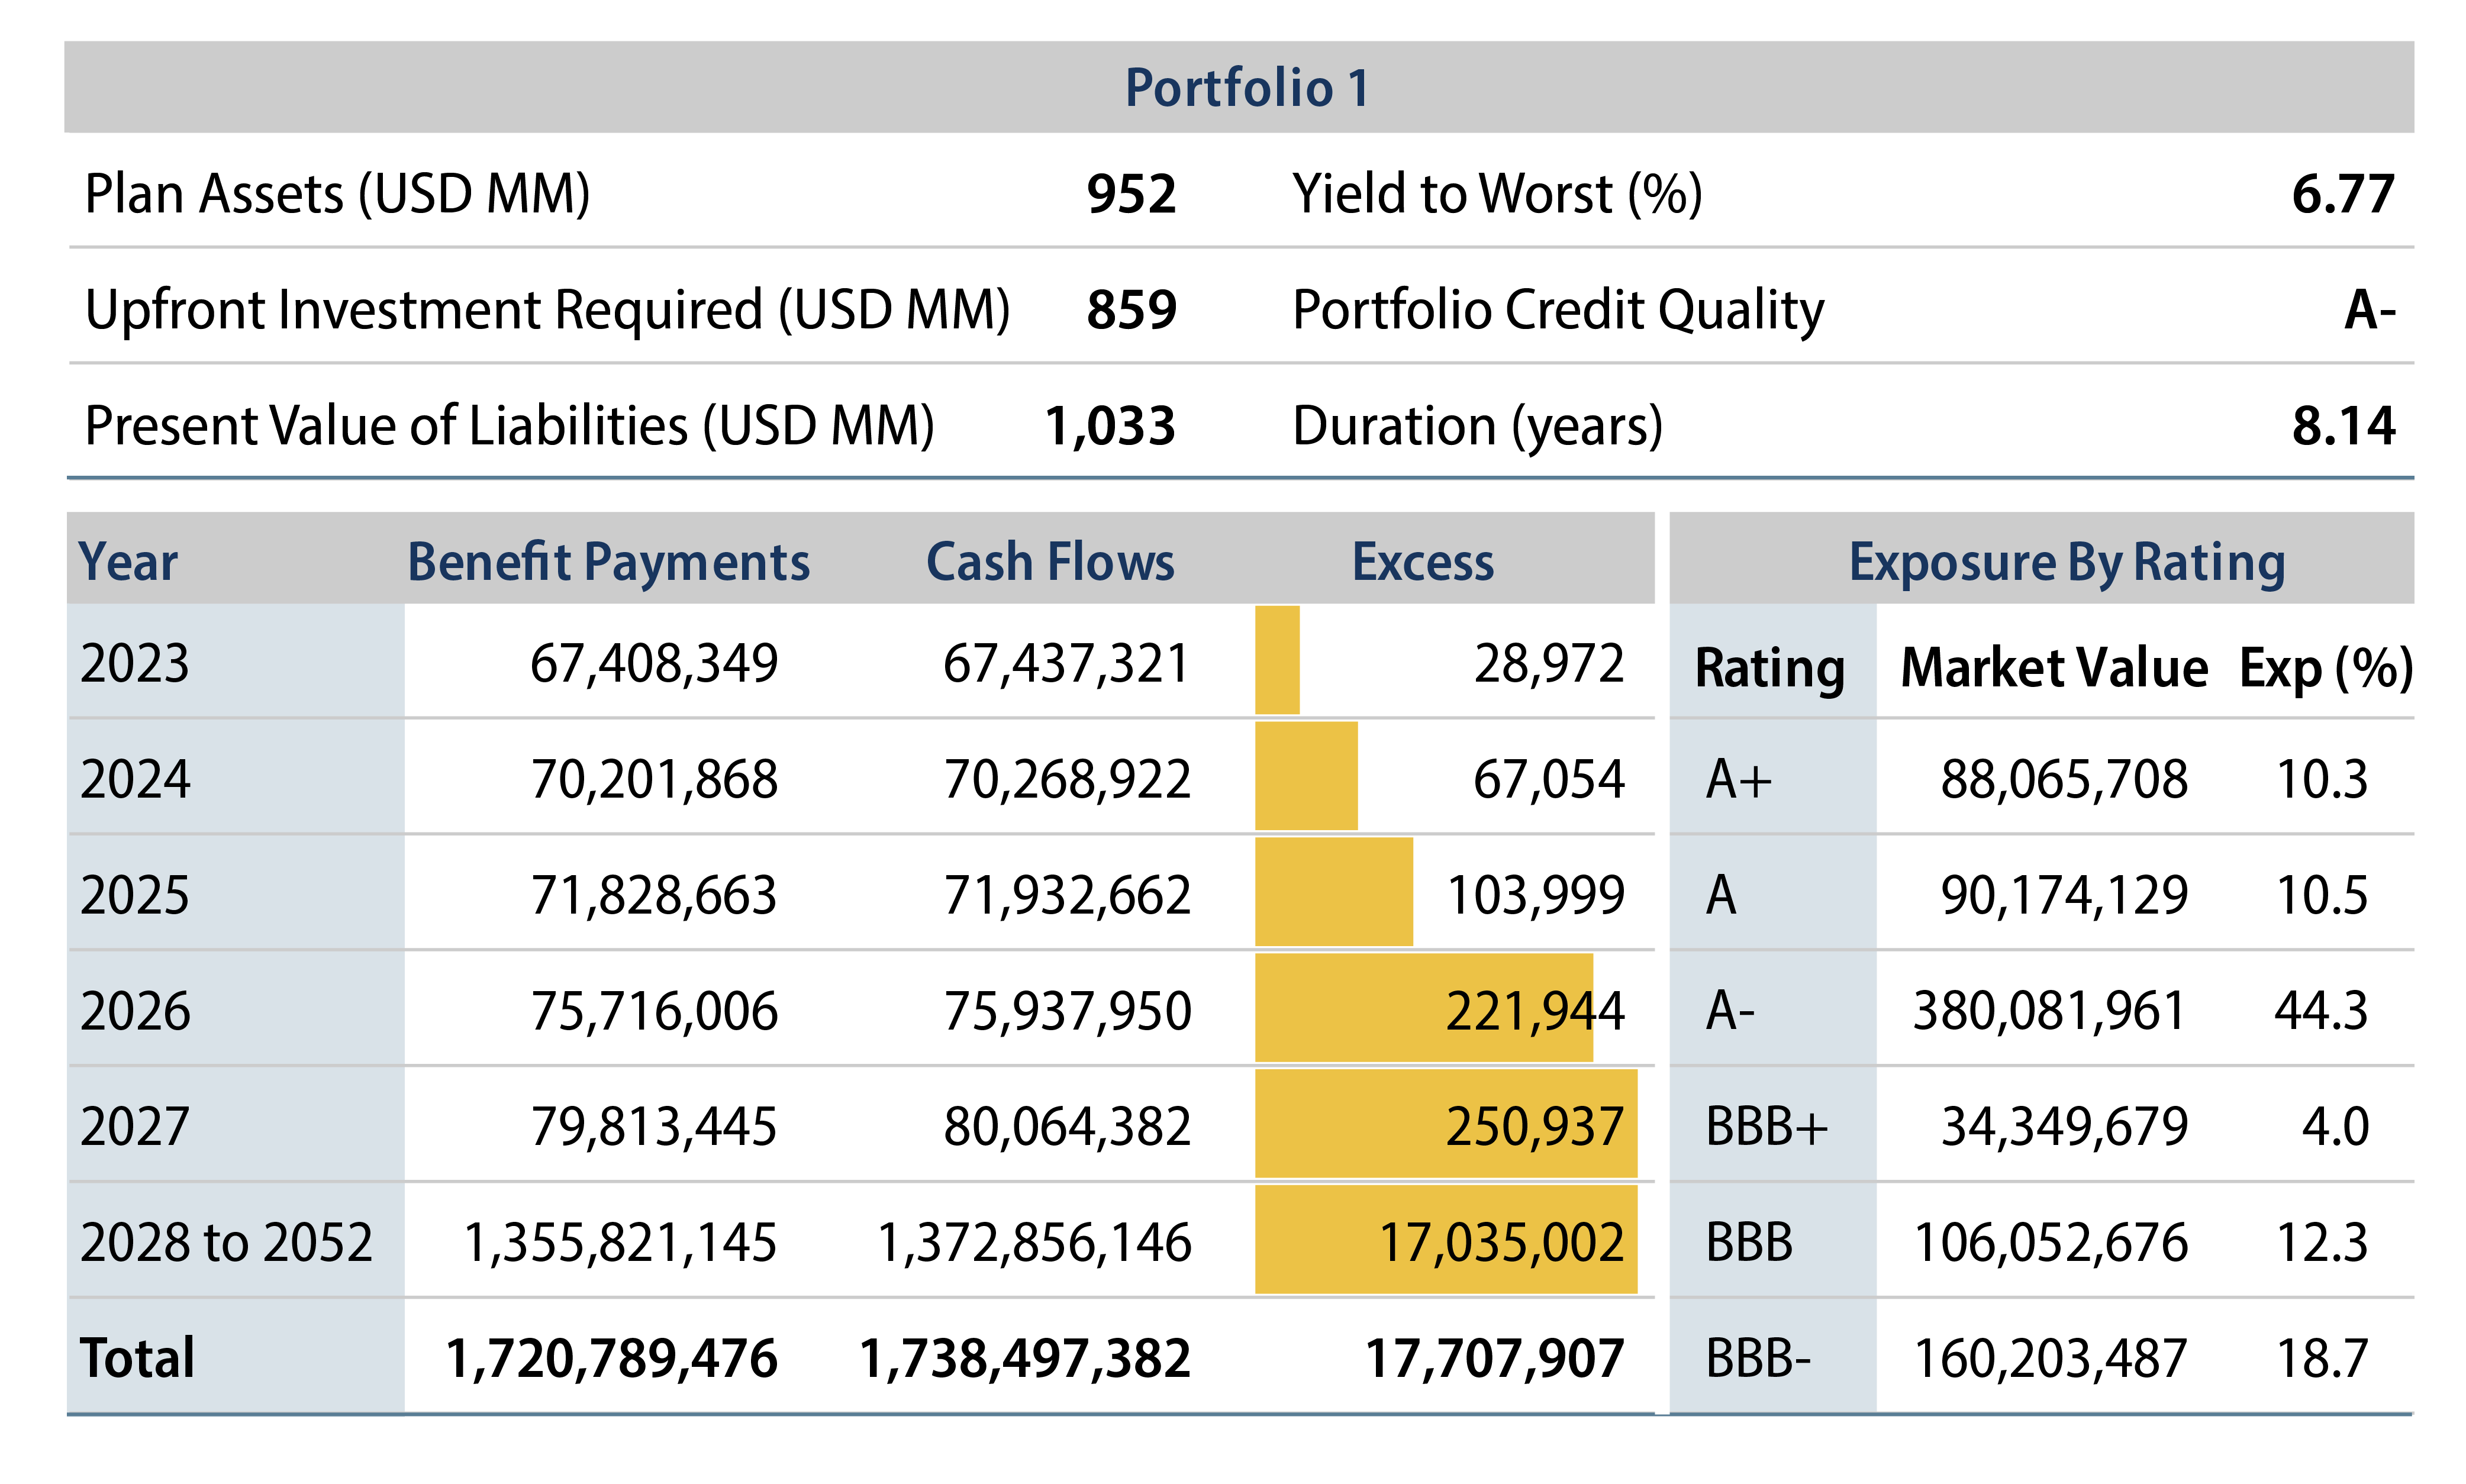
The upfront investment required to create an A- average credit quality cash flow matching portfolio is only $859 million compared to $952 million in assets and a present value of $1.033 billion for the liabilities2 (the equivalent of a funded ratio of only 83%). Conceptually this makes sense as the liabilities are being discounted with an AA yield, while the assets are being invested in higher yielding AA, A and BBB securities.
We looked at all available investment-grade bonds in the Bloomberg U.S. Investment Grade and Bloomberg U.S. Treasury indexes to create a model portfolio that produced enough cash flows to satisfy the projected benefit payments. Over the life of the portfolio the expected cash flows equals $1.738 billion compared to $1.721 billion in projected benefit payments.
Similar to other LDI strategies, a cash flow matching strategy is still subject to potential default risk on the asset side, as well as longevity and other actuarial risk on the liabilities side, but this approach leaves the plan with a cash cushion of $93 million (the difference between available plan assets of $952 million and upfront minimum investment of $859 million) to invest in a growth portfolio or to compensate for any default and/or other risks.
Default risk, which cannot be eliminated, has been very low historically with the Moody’s 5-year cumulative default rate for US investment-grade securities of 0.2%, as December 31, 2021. The final portfolio will likely require a higher upfront investment after incorporating client specific guidelines, risk appetites and bottom-up manager research that will eliminate some higher-yielding bonds. However, given current yields, it is clear that it is possible to defease benefit payments with a cash flow matching strategy even for plans that are meaningfully underfunded.
Option 2: Can Cash Flow Matching Be Used as a Cheaper Alternative to PRT?
Here we kept the same ratings and minimum issue requirements as option 1, but invest all available assets ($952 million) and increase the annual cash flow target by 10% to account for ongoing administrative and regulatory (i.e. PBGC premiums) expenses.
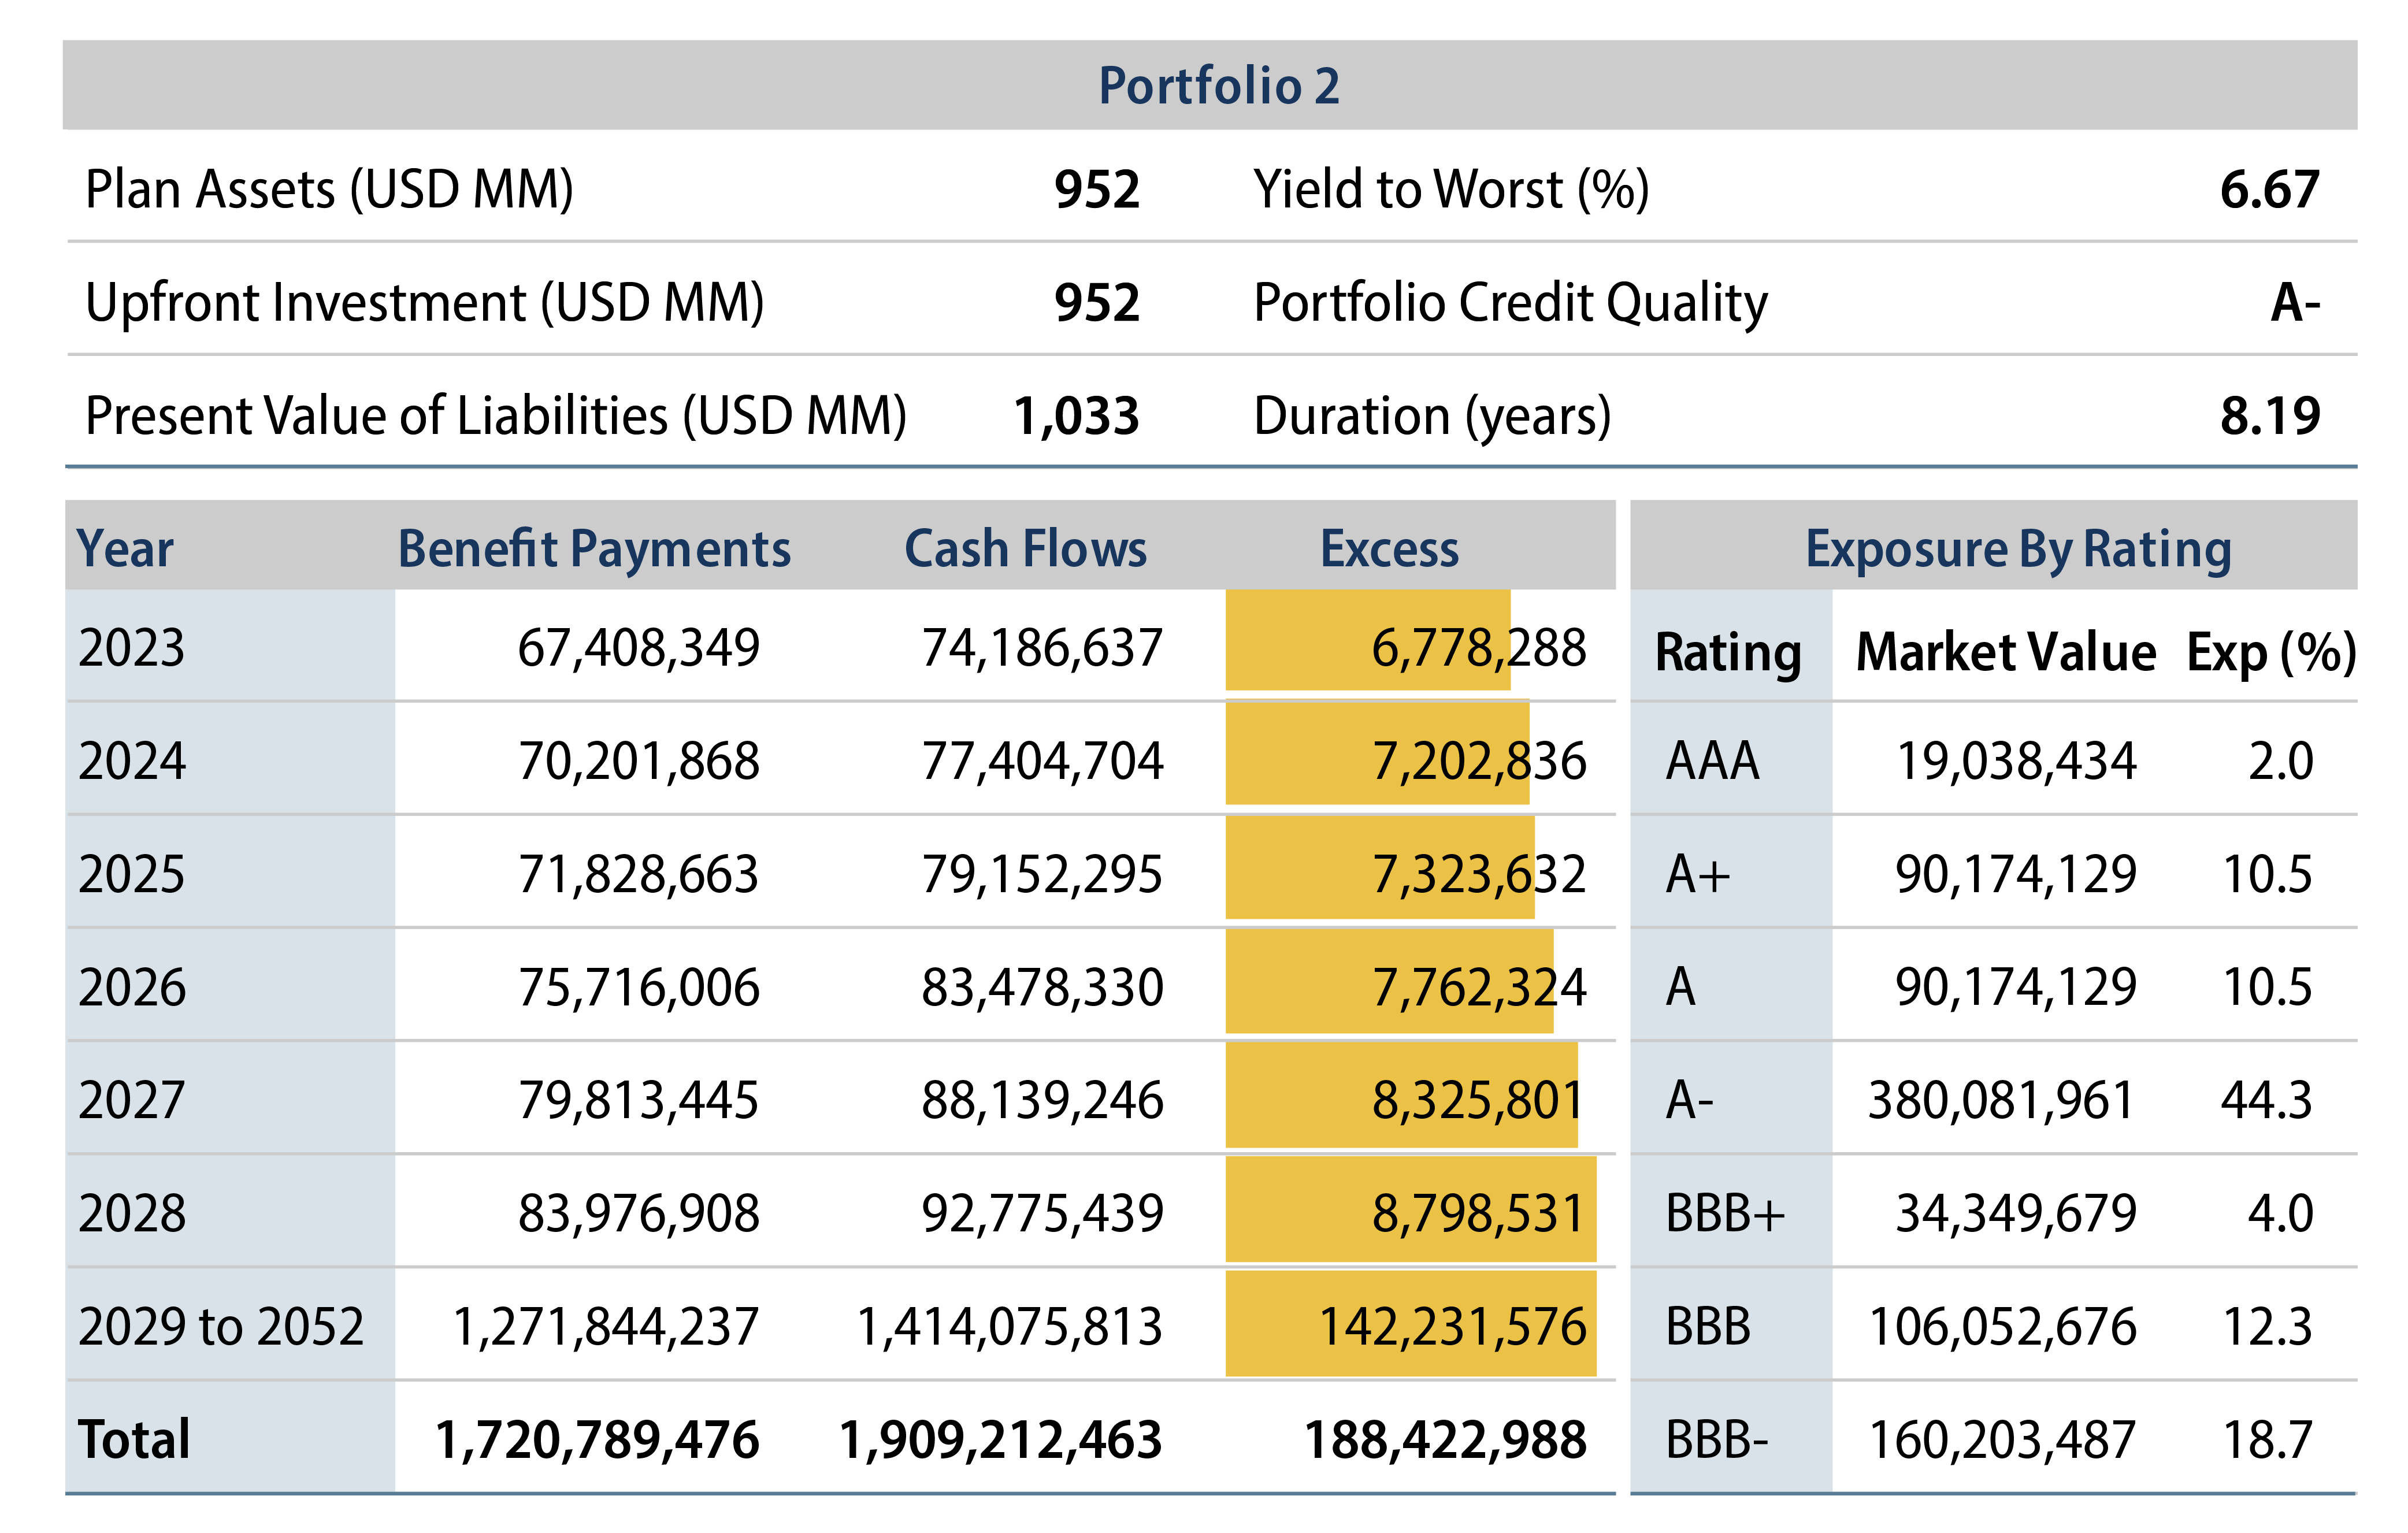
Cash Flow Buffer
The 10% annual cash flow buffer (cash flows in excess of the projected liability payments) averages ~$7.5 million per year. The expected cash flows from the $952 million portfolio equals $ 1.909 billion compared to $1.721 billion in projected benefit payments over the plan’s lifetime, an excess of $188 million over the projected benefits.
Proponents of PRT have often used the high cost of PBGC premiums as a reason to consider annuitization. Per our example, the annual $7.5 million cash flow buffer can be used to pay for PBGC premiums, salaries and other administrative related plan costs. More importantly, cash flow matching also does not require large upfront contributions that are typically required for both partial and full plan buyouts.
No Upfront Contributions
With partial PRT transactions, most plans’ funded ratios actually decrease as plans have to transfer more than 100% of the correspondent liability present value out of the plan assets to the insurance companies, reducing the funded ratio of the plan after the partial PRT. Restoring the funded ratio to the pre-PRT level for the remaining participants would require a make-whole contribution by the plan sponsor.
Fully terminating a plan via PRT is not only very time consuming and labor intensive, but also very costly as these transactions are usually executed at a premium over the present value of the liabilities to compensate for fees and the insurer’s built-in profit margin.
Cash flow match investing does not require any upfront contributions and is a viable, cheaper and potentially better alternative to PRT.
Option 3: The Case for Partial Cash Flow Matching
This approach removes liquidity needs/risks over the short-intermediate term, allowing plans to more easily take on illiquidity risk elsewhere, while eliminating the operational burden of raising cash every month to pay for benefits. The following hypothetical portfolio matches the first three years of benefit payments only, while using the same minimum portfolio criteria as Option 1 and Option 2.
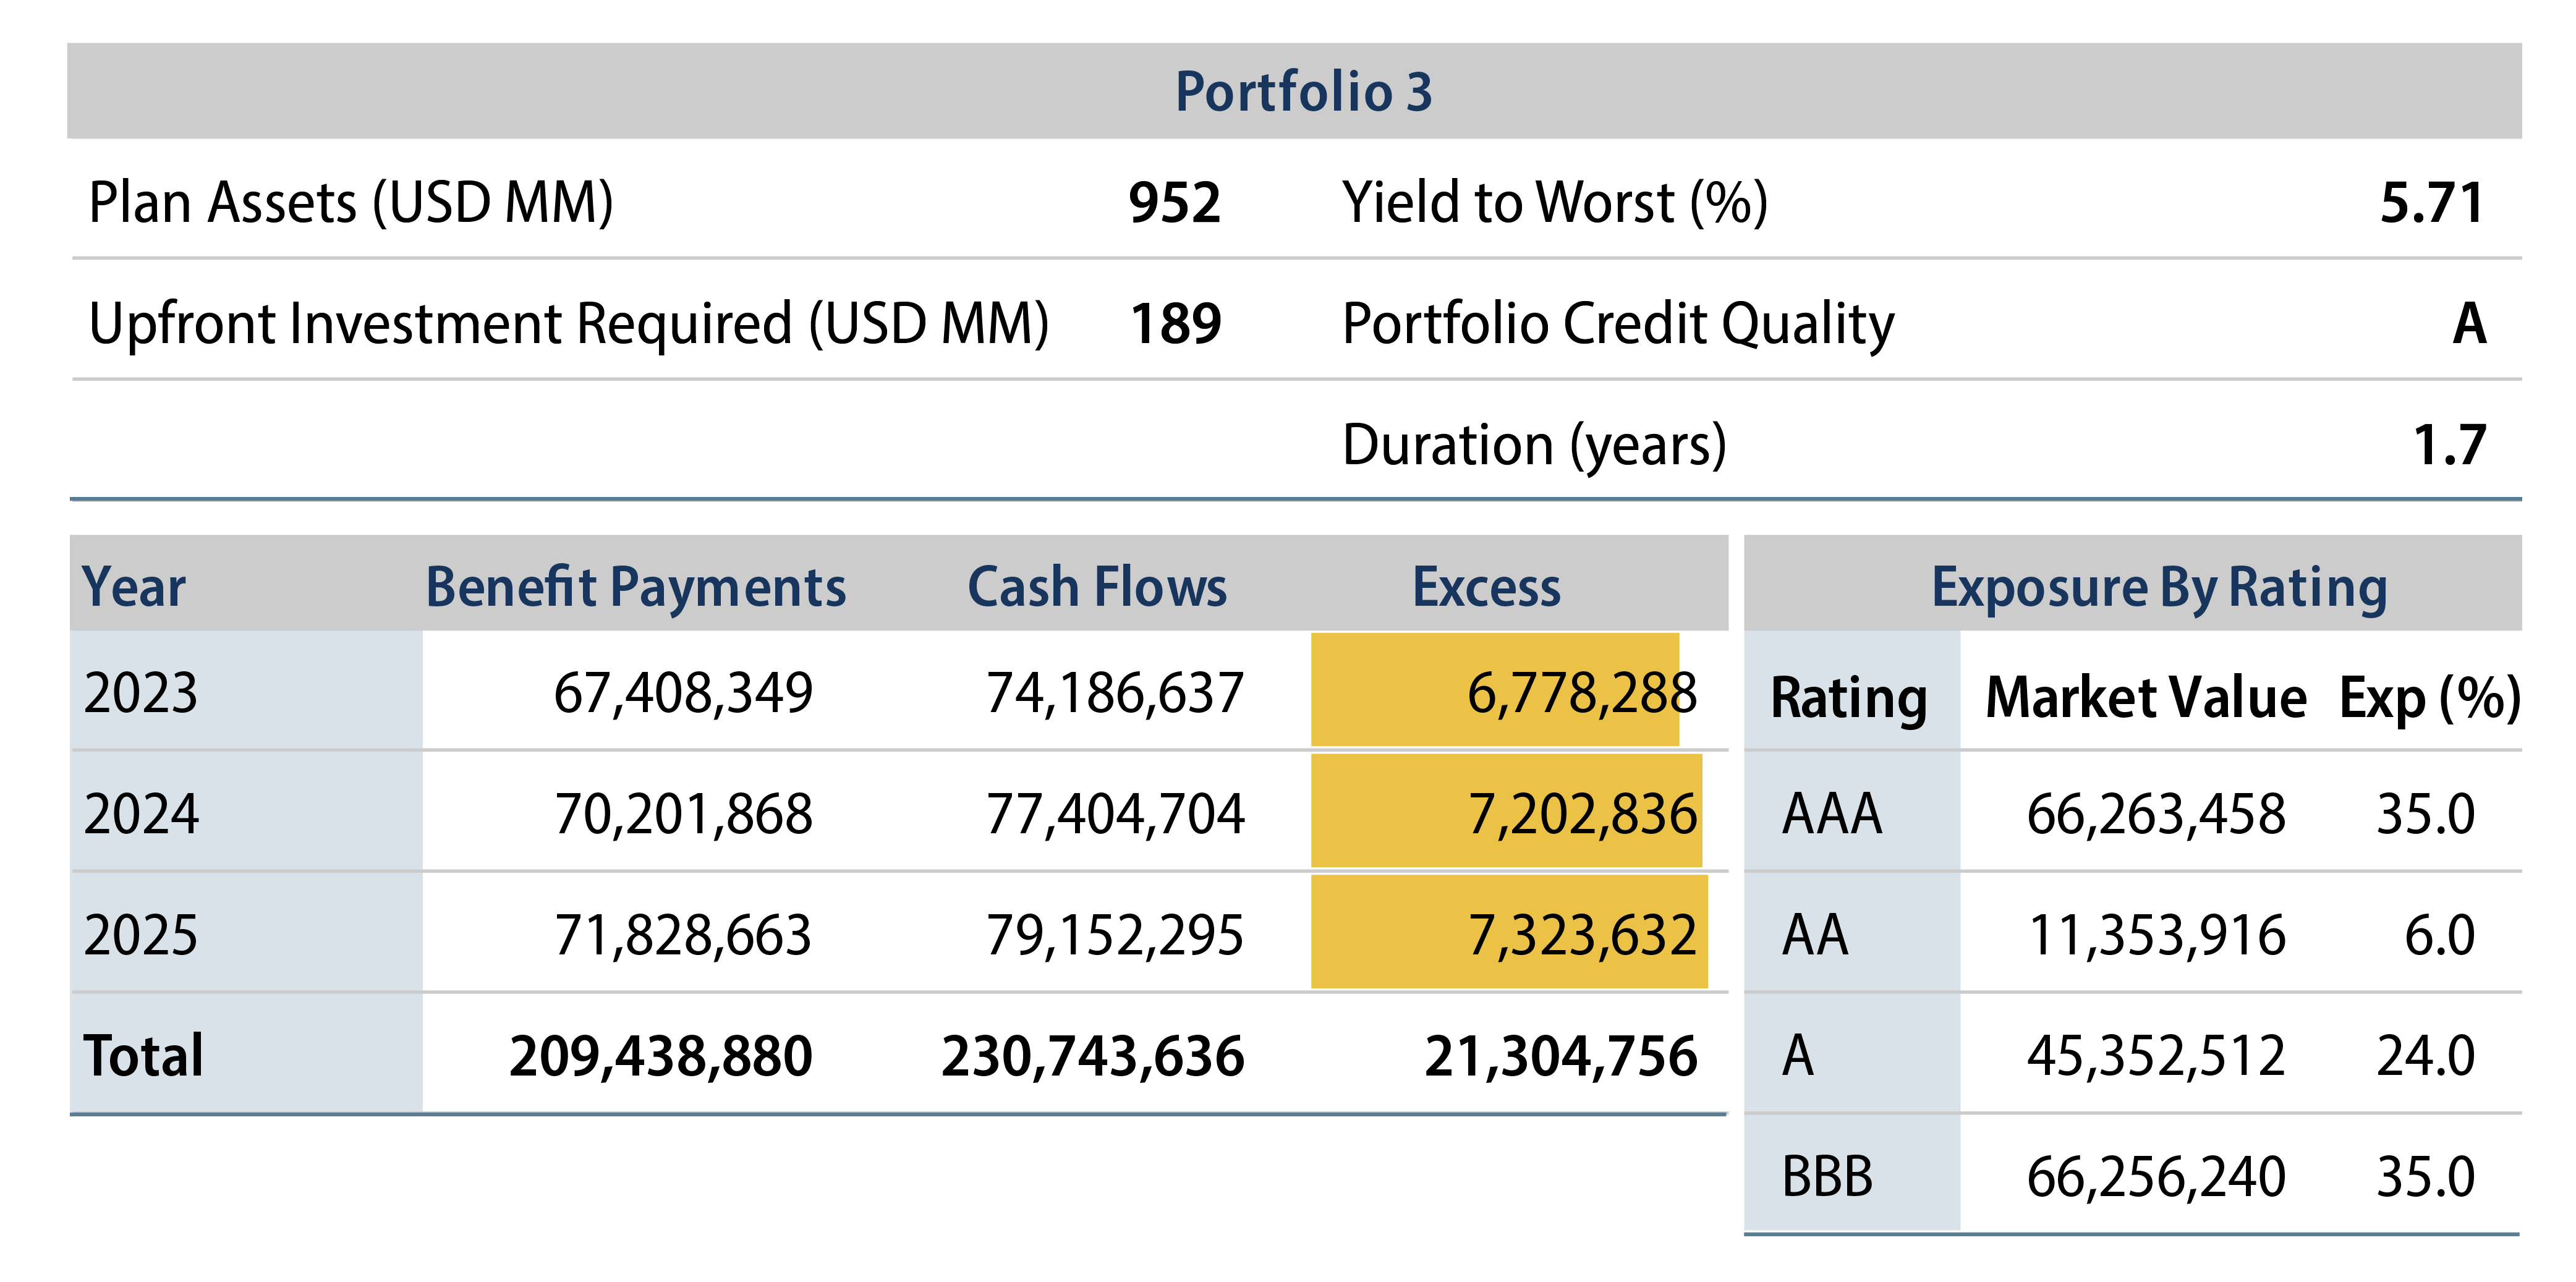
The plan is able to “lock in” a yield of 5.71% to satisfy an estimated $209 million in benefit payments over the next three years with an upfront investment of $189 million. The average credit quality of the model portfolio above is A/A2 and the portfolio breakdown is 27% Treasuries, 8% cash and 65% investment-grade credit. Adding a small allocation to below-investment-grade-rated securities will further reduce the amount of upfront investment. This could make sense for some plans as managers have more visibility in the financial health of corporations in the short term.
Summary
Cash flow matching has always been considered the last phase of a well-funded LDI program. However, the current drastic increase in yields has presented even underfunded pension plans an attractive opportunity to cash flow match the first few years, or all of the projected benefit payments today with the fewest amount of assets in the last decade and a half.
With a cash flow matching strategy, plans can eliminate the operational burden of raising cash every month to pay for benefits, while also reducing the risk of forced liquidation during market selloffs, eliminate regular allocation recalibrating, reduce funded status volatility and reduce the risk of having to make future contributions to the plan.
Pension plans can seize the opportunity to lock in yields above 5.5% today, which is close to the long-term expected rate of return of certain risk assets. Implementing a cash flow match or partial cash flow match program will not materially alter the overall plan’s expected rate of return, though it will eliminate the volatility and downside risk of investing in certain risk assets. Given current market conditions, maybe it is time to start referring to cash flow matching as “today’s opportunity in LDI” and no longer “the final phase of LDI.”
ENDNOTES