

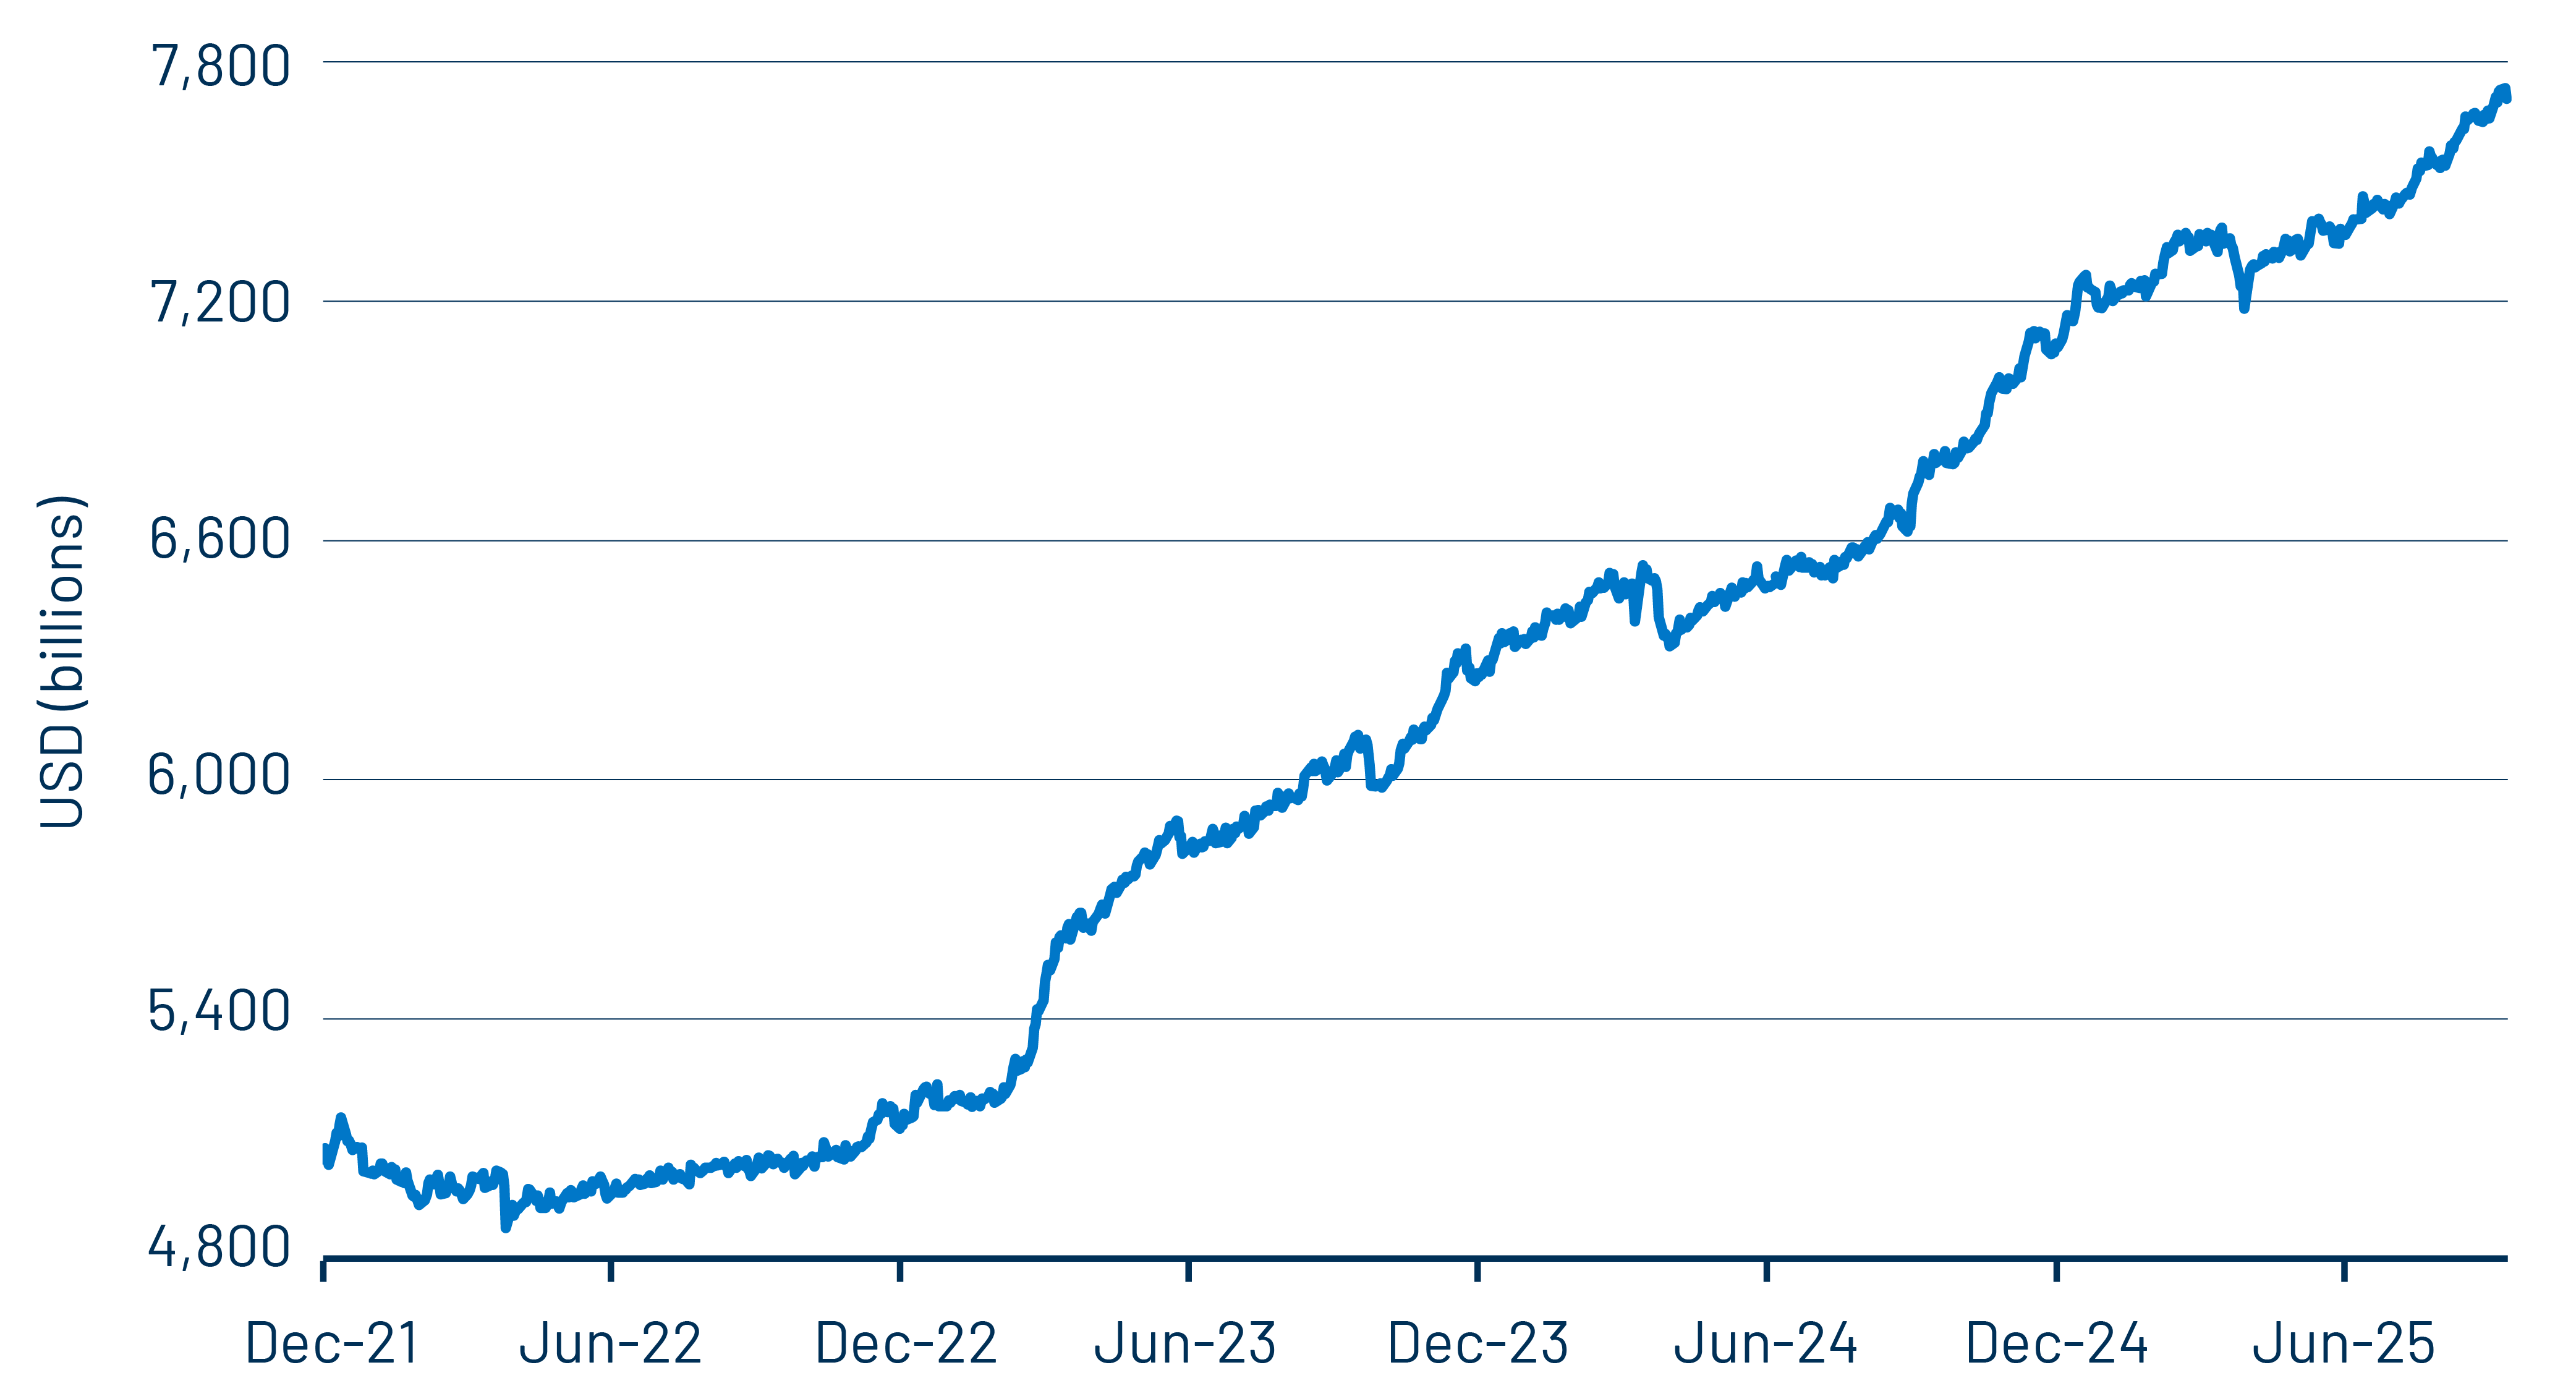
As of September 30, 2025, US money market funds (MMFs) managed approximately $7.7 trillion in assets, up from about $7 trillion at the end of 2024 and nearly 55% higher than five years ago. This expansion reflects a potent mix of macroeconomic conditions and market sentiment. Chief among the drivers has been the sustained high-interest rate environment. With the Federal Reserve (Fed) keeping policy rates elevated, MMF yields have followed suit, making these vehicles far more attractive than traditional bank deposits or other short-term instruments. The regional banking crisis of March 2023, which underscored that US bank deposits are only guaranteed up to $250,000, an inverted yield curve that at one point lifted cash yields above 5%, as well as persistent market volatility all contributed to the significant increase in MMF balances over the past year.
The pace of growth in 2025 has surprised many market participants. Some had expected that once the Fed prepared to restart its easing cycle, a meaningful share of cash in MMFs would rotate into fixed income or equities. Yet today’s market backdrop complicates that narrative. Risk assets such as US equities, gold and bitcoin are trading at record highs, long-end yields remain elevated both domestically and internationally, and spreads across global corporate credit are compressed. Moreover, market expectations are for policy rates to settle around 3%, meaningfully higher than where they were for most of the post-GFC period. US Treasury Secretary Scott Bessent has also expressed a desire to lean into demand on the front end of the yield curve (i.e., T-bills), likely resulting in a higher bill share of total Treasury issuance moving forward.1 This combination of factors challenges the view that cash will quickly migrate out of MMFs.
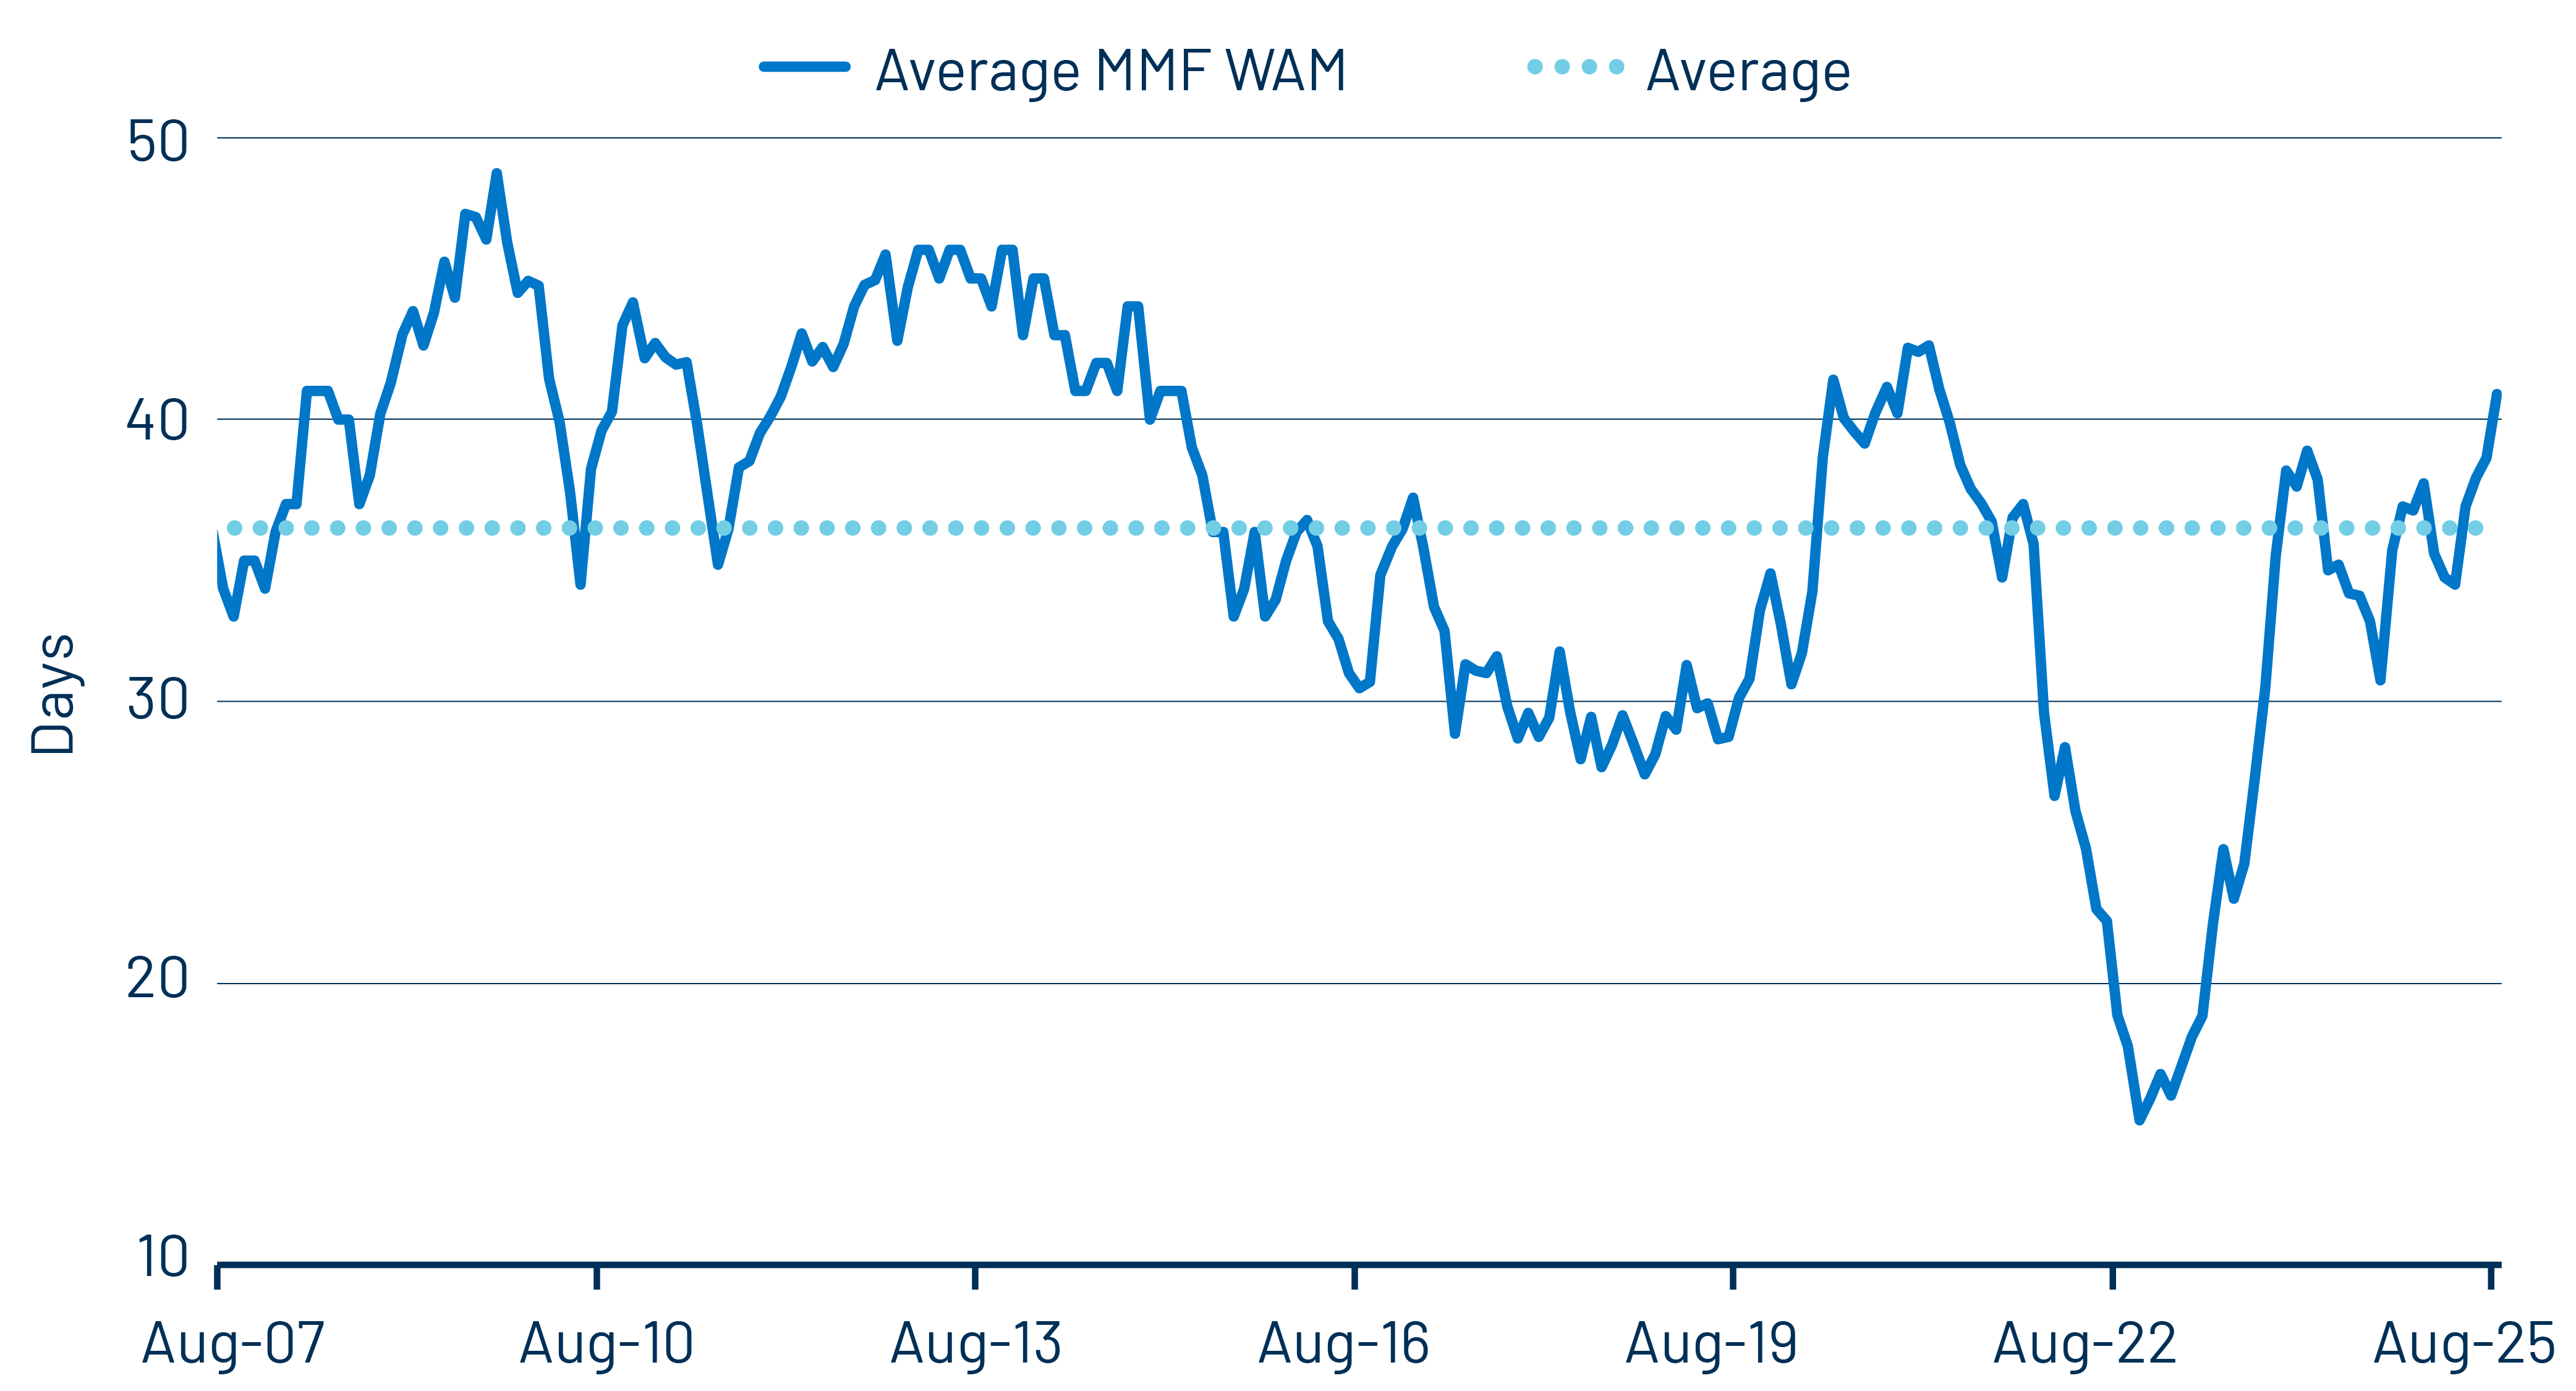
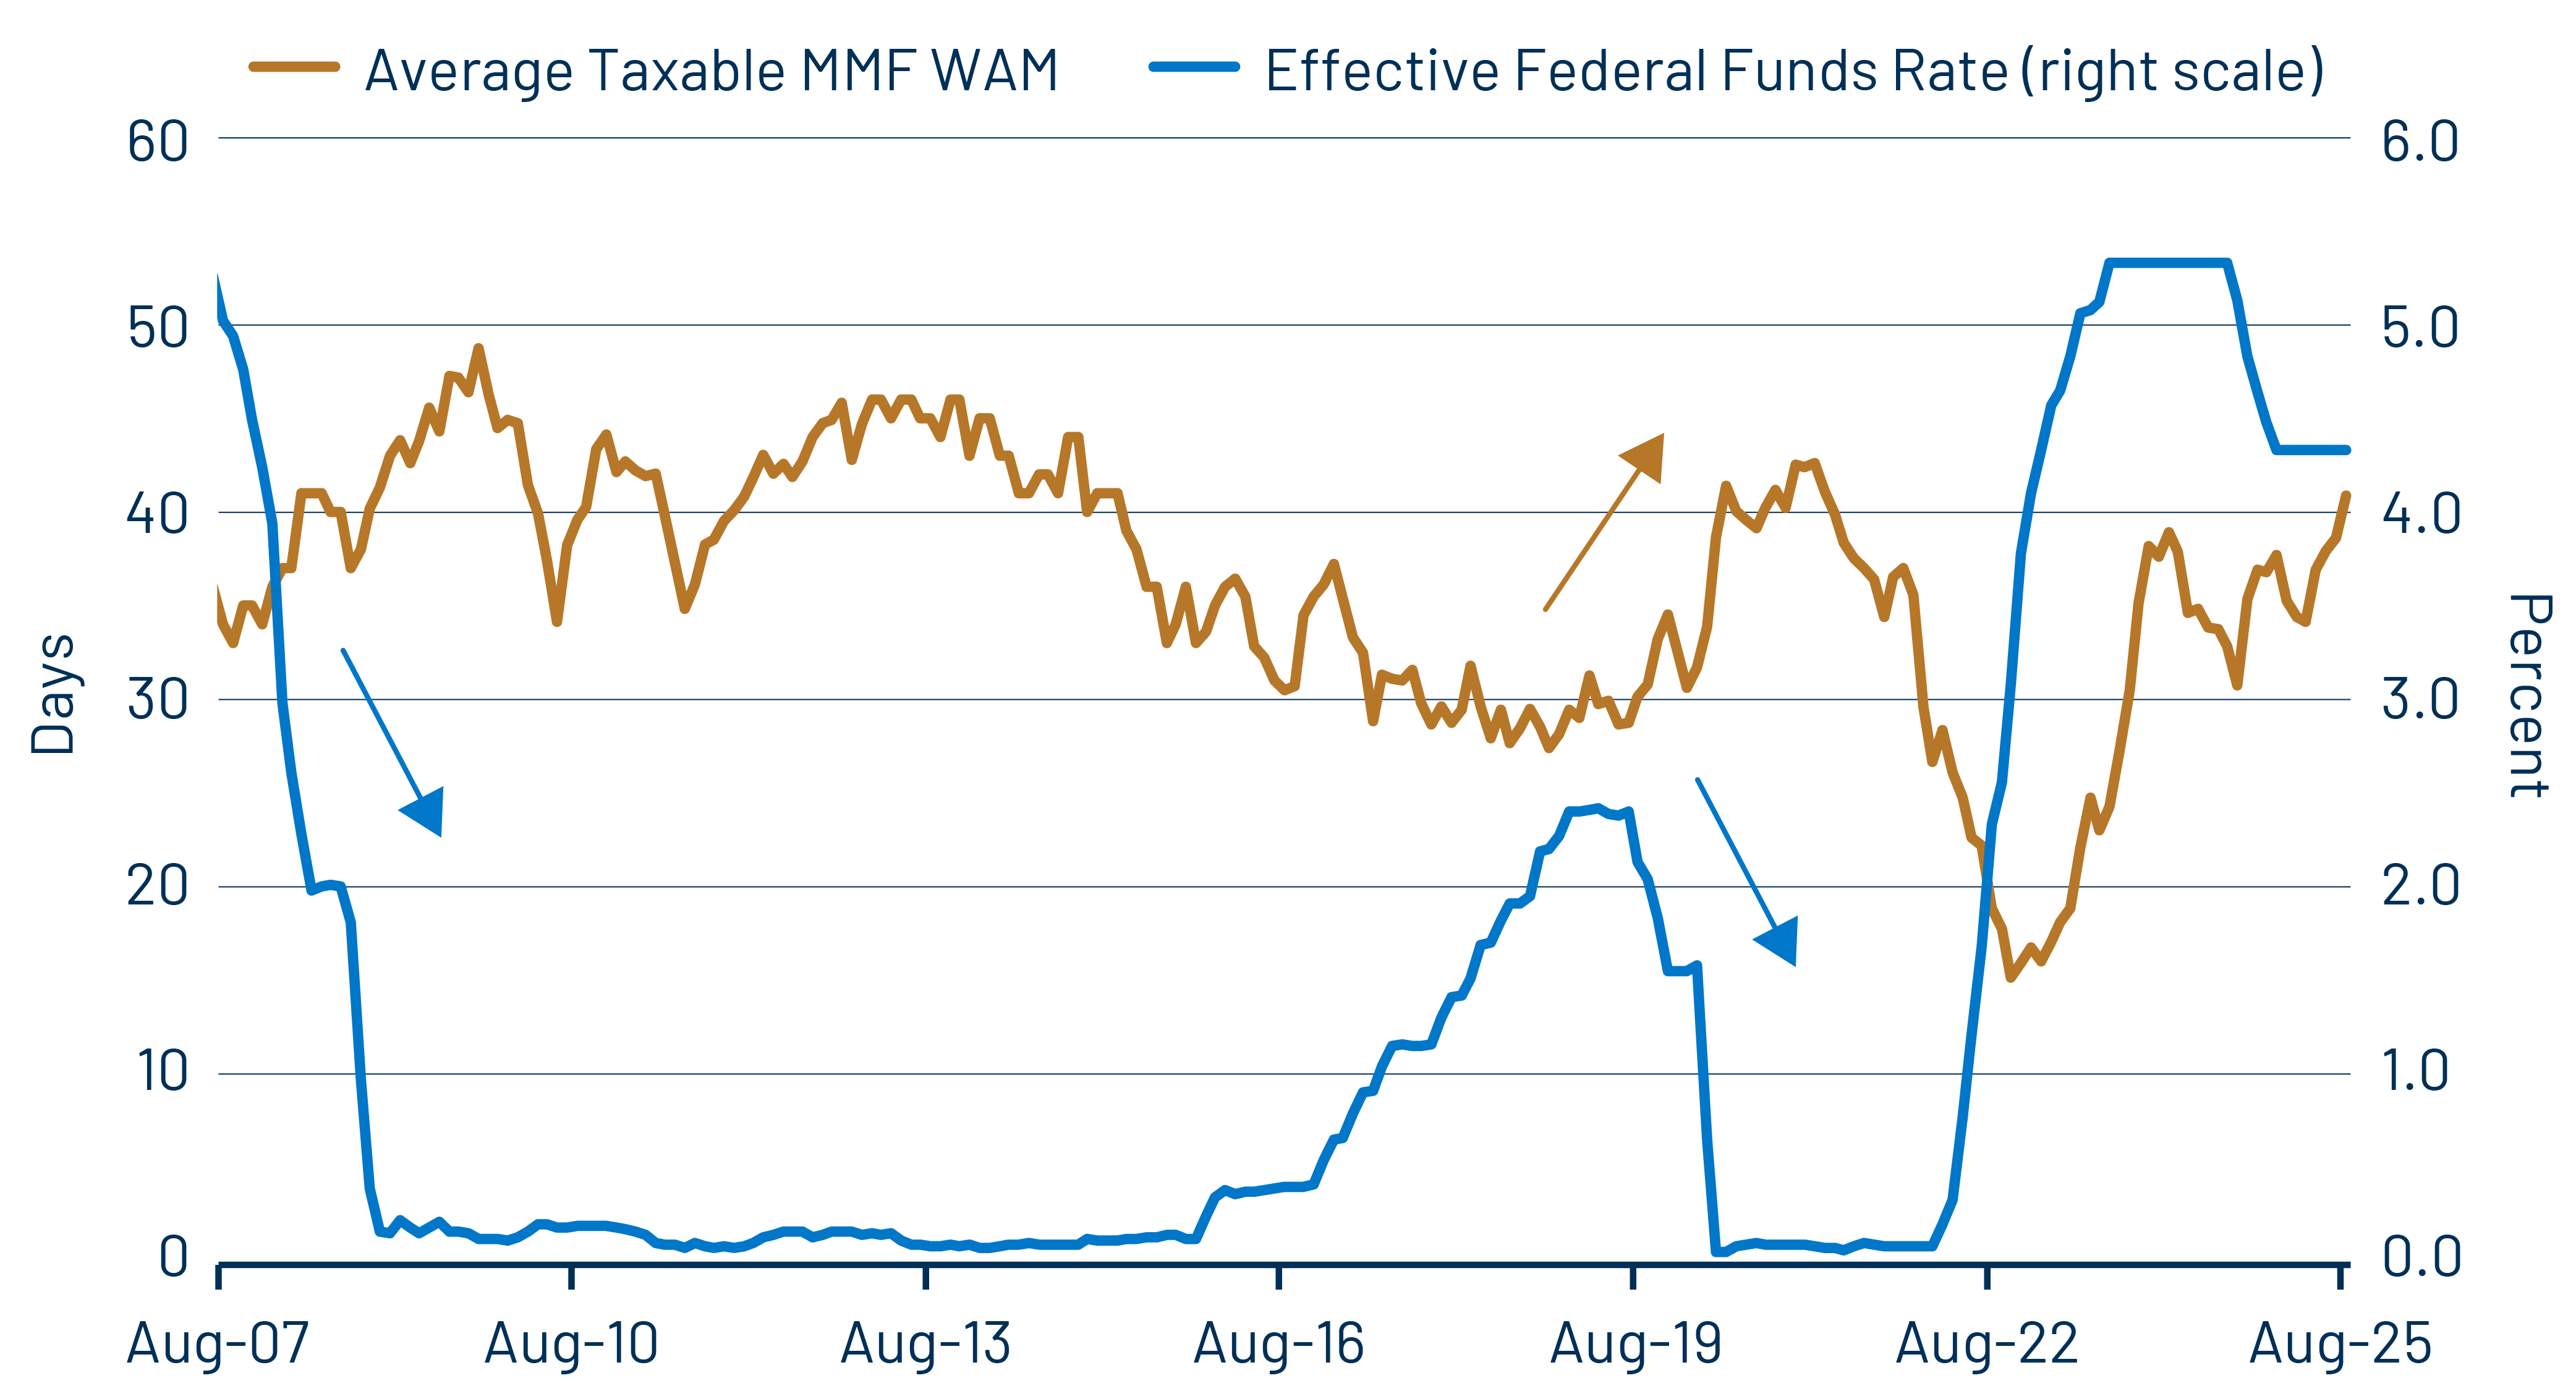
One reason MMFs remain sticky is structural. Empirical evidence shows that MMF yields in the US typically remain elevated for longer periods than overnight bank deposit rates largely due to active duration management within money market curves. Fund managers actively extend duration across certificates of deposit, commercial paper, Treasuries, and repurchase agreements, capturing higher coupons that continue to pay even after policy rates begin to fall. Because these portfolios generally carry longer weighted-average maturities (WAMs), yields do not immediately reprice when policy rates fall, which enhances their appeal to institutional investors. Exhibit 2 highlights that portfolio WAMs now stand above historical norms, a factor that helps to explain why MMF assets often peak well after Fed rate cuts begin, as shown in Exhibit 3.
Equally important, MMFs function as core liquidity vehicles rather than speculative investment products, which limits the amount of cash pivoting into riskier asset classes. Institutional investors, including corporations, financial institutions and municipalities, account for more than half of total assets, approximately $4.6 trillion, and rely on MMFs to manage operational cash flows, maintain liquidity buffers, and earn competitive returns on short-term balances. Retail investors, who represent nearly $3 trillion of the MMF universe, have also increased allocations. For them, MMFs serve as higher-yielding substitutes for savings accounts, temporary holding places for capital, and readily available sources of cash for emergencies.2
With yields still attractive relative to bank deposits, both fund types remain sticky. However, the choice between prime and government funds reflects how investors balance risk appetite against yield expectations and recent flow trends highlight a tilt towards government funds.3 Regulatory liquidity requirements force prime funds to keep 25% daily and 50% weekly assets readily available.4 In today’s market environment, this has led many prime funds to shorten their WAMs, reducing their ability to extend into longer, higher-yielding securities. As a result, the spread over government funds is narrower than in prior cycles. Safety-focused investors may also appreciate the constant net asset value (NAV) and the comfort of Treasuries as underlying collateral in government funds.
Finally, banking dynamics reinforce this trend. Many institutions have been slow to pass higher policy rates through to depositors because deposits consume valuable balance-sheet capacity. Under Basel III, institutional deposits not tied to day-to-day operations are classified as “non-operational” and are assigned high outflow (or “hot money”) assumptions, making them costly for banks to retain. As policy rates decline, banks generally become even less willing to absorb deposits. This behavior strengthens the role of MMFs as a preferred source of liquidity and stability for both institutional and retail investors.
ENDNOTES
1. ''A slew of T-bills coming? Money market funds say 'bring 'em on''' Reuters, July 14, 2025
2. Another driver of AUM growth in money funds, especially during bull markets in equities and credit, has been CME balances. (CME Group is the world’s leading derivatives marketplace.) Because money funds are approved margin collateral, rising account values increase margin requirements. To meet these requirements, prime brokers are increasingly posting money funds instead of cash, allowing them to earn a higher yield.
3. Prime funds hold corporate paper, CDs and other credit instruments. Traditionally, they offer a yield premium over government funds in exchange for taking modest credit and liquidity risk. They operate with floating NAVs, so investors see daily mark-to-market changes around $1.00. Government funds invest almost entirely in Treasuries and repos and have a constant $1.00 NAV and virtually no credit risk. They naturally meet liquidity bucket rules.
4. On July 12, 2023, the SEC adopted a final amendment to Rule 2a-7 that increased the minimum daily liquidity asset requirement from 10% to 25%, and the minimum weekly liquid asset requirement from 30% to 50%. EU UCITS MMFs are still at 10% daily and 30% weekly liquidity requirements.