skip navigation
Blog

Stay up to date on timely topics and market events. Subscribe to our Blog now.

ECONOMY
September 27, 2024

Services Spending Stronger, Goods Spending Softer, Inflation Down in August

By Michael J. Bazdarich, PhD

Stay up to date on timely topics and market events. Subscribe to our Blog now.

The Commerce Department, specifically, the Bureau of Economic Analysis (BEA) within Commerce, today announced data for August on consumer spending, personal income, and PCE inflation. The releases also included benchmark revisions of these data back to 2019.

Total real consumer spending showed a 1.8% annualized rate of increase in August, with goods spending up at a 0.4% per year pace and services up at a 2.4% per year pace. Real personal income rose at a 1.4% annualized rate, while real disposable income and real wage income rose at 0.8% and 4.6% annualized rates, respectively. We show the annualized real rates here partly to make these numbers comparable to real GDP growth that has been in the 2% to 3% range in recent quarters. The August real spending and income gains were net of 1.1% annualized inflation in the headline PCE price index, 1.6% annualized inflation in the core PCE price index, and 0.7% annualized inflation in the core PCE excluding housing. We’ve said a mouthful here, so let’s go back over each segment of the news in turn.

The gains in goods consumption were in accord with retail sales data released last week and showed decent growth for spending on goods other than cars and gasoline, but declines for the latter two. Similarly, services spending rose nicely, especially for services other than what we call the “Covid epicenter.” The epicenter sectors—health care, restaurants, lodging, travel, and entertainment—have generally languished in recent months after a period of strong growth following the Covid shutdown. However, for other service sectors, spending recovered earlier from the shutdown, but then decelerated in 2022 and 2023, only to pick up again this year.

Exhibit 1: Real Consumer Spending by Type
Real Consumer Spending by Type
Source: Bureau of Economic Analysis. As of 31 Aug 24. Select the image to expand the view.

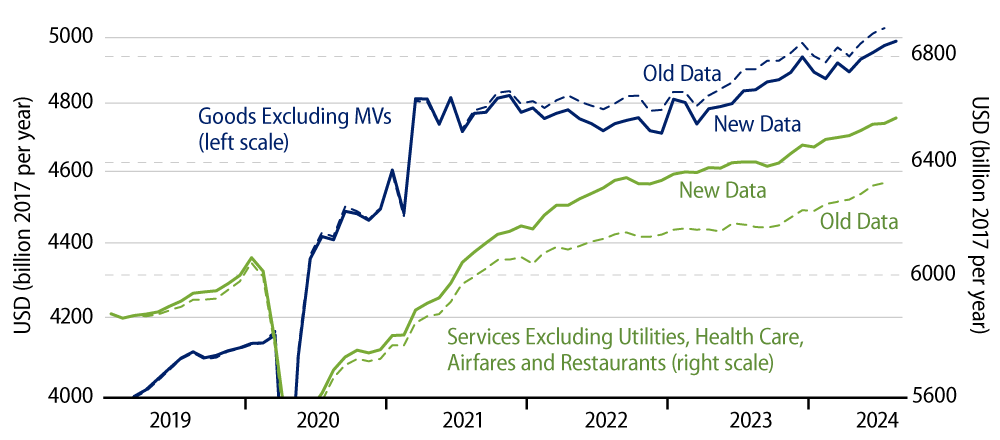
Concerning the benchmark revisions BEA announced today, as you can see in Exhibit 1, goods spending growth was revised down modestly in 2022 and 2023, while services spending growth was revised substantially higher in 2022 and 2023. And, yes, those upward revisions were mostly for services outside the Covid epicenter.

Notice also that spending growth in 2024 remains decent for both goods and services. Both are rising nicely this year following whatever “adjustments” consumers made in 2022 and 2023 that led to “pauses” in goods or services spending growth. This is a better outcome for 2024 consumption than we were expecting at the start of the year.

Revisions to the personal income data were curious. Personal income through July was revised upward by a hefty +3.3%, with stronger growth somewhat evenly distributed across 2021, 2022, and 2023. However, wage income was revised up by only +1.1%. Most of the upward revisions to income came in the form of employer pension contributions (+4.6%), proprietor incomes (+5.7%), rental income (+2.3%), interest and dividend income (+6.8%), and transfer payments (+4.6%). The latter were mostly in Medicare and veteran benefits.

It is odd that initial government estimates were off by so much for these categories. It is also odd that wage income was revised down in 2022 but up in 2023, so that all the net upward revision to wage income came in recent months. The oddity here is that the Labor Department has already announced substantial downward revisions forthcoming to payroll jobs over this same period. Upward revisions to income opposite downward revisions to payroll jobs don’t seem to match up. Oh well.

Exhibit 2: Core Inflation ex. Shelter, CPI & PCE
Core Inflation ex. Shelter, CPI & PCE
Source: Bureau of Labor Statistics, Bureau of Economic Analysis, Western Asset. As of 31 Aug 24. Select the image to expand the view.

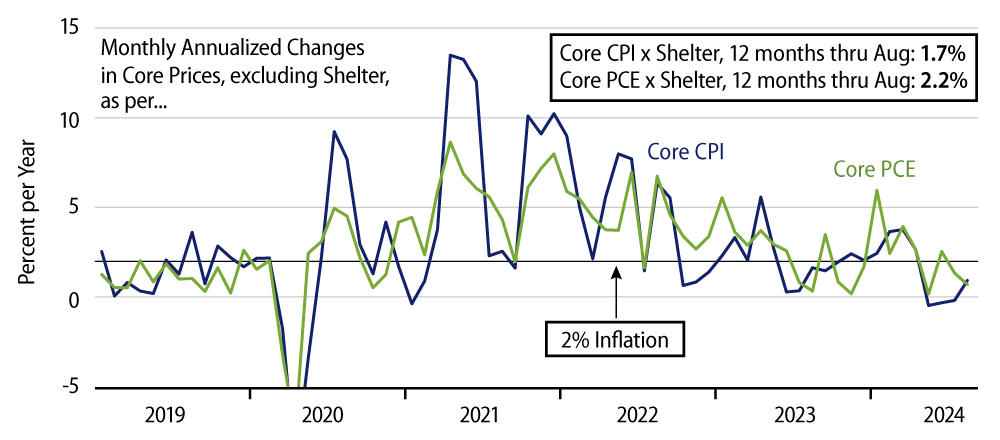
The PCE inflation news was favorable across the board, even more so than the Consumer Price Index inflation data released two weeks ago, as shown in Exhibit 2. The 1.1% annualized headline PCE inflation in August compares to 2.3% for the headline CPI, and 1.6% core PCE inflation compares to 3.4% for the core CPI. While much of this disparity is due to much higher weights of housing in the CPI than in the PCE, it is still the case that the 0.7% annualized rate in August for the core PCE ex housing compares to 1.0% for the corresponding CPI measure.

While the 2.2% rate for the core PCE ex housing over the last 12 months is still very slightly over the Fed’s target, this aggregate has averaged only 1.1% inflation rates over the last four months. This was likely an impetus to the Fed’s decision to cut short rates by 50 basis points (bps) last week. We stated then that current economic conditions were generally healthy, but the ongoing slowing trend in job growth might be worrisome, and the benign recent inflation experience might give the Fed cover to attempt to preempt further job market softening.

While we listed these possible drivers, we still thought the Fed would move cautiously and cut more modestly. Instead, they opted for a 50-bp cut. Do they see more worrisome signs in the data than we have recounted? And even if they do, given how long it has taken the economy to react to a 500-bp increase in short rates, will a 50-bp cut rather than a 25-bp cut in September make any significant difference? All good questions. We’ll try to divine the answers as new info arrives.

© Western Asset Management Company, LLC 2025. The information contained in these materials ("the materials") is intended for the exclusive use of the designated recipient ("the recipient"). This information is proprietary and confidential and may contain commercially sensitive information, and may not be copied, reproduced or republished, in whole or in part, without the prior written consent of Western Asset Management Company ("Western Asset").
Past performance does not predict future returns. These materials should not be deemed to be a prediction or projection of future performance. These materials are intended for investment professionals including professional clients, eligible counterparties, and qualified investors only.
These materials have been produced for illustrative and informational purposes only. These materials contain Western Asset's opinions and beliefs as of the date designated on the materials; these views are subject to change and may not reflect real-time market developments and investment views.
Third party data may be used throughout the materials, and this data is believed to be accurate to the best of Western Asset's knowledge at the time of publication, but cannot be guaranteed. These materials may also contain strategy or product awards or rankings from independent third parties or industry publications which are based on unbiased quantitative and/or qualitative information determined independently by each third party or publication. In some cases, Western Asset may subscribe to these third party's standard industry services or publications. These standard subscriptions and services are available to all asset managers and do not influence rankings or awards in any way.
Investment strategies or products discussed herein may involve a high degree of risk, including the loss of some or all capital. Investments in any products or strategies described in these materials may be volatile, and investors should have the financial ability and willingness to accept such risks.
Unless otherwise noted, investment performance contained in these materials is reflective of a strategy composite. All other strategy data and information included in these materials reflects a representative portfolio which is an account in the composite that Western Asset believes most closely reflects the current portfolio management style of the strategy. Performance is not a consideration in the selection of the representative portfolio. The characteristics of the representative portfolio shown may differ from other accounts in the composite. Information regarding the representative portfolio and the other accounts in the composite are available upon request. Statements in these materials should not be considered investment advice. References, either general or specific, to securities and/or issuers in the materials are for illustrative purposes only and are not intended to be, and should not be interpreted as, recommendation to purchase or sell such securities. Employees and/or clients of Western Asset may have a position in the securities or issuers mentioned.
These materials are not intended to provide, and should not be relied on for, accounting, legal, tax, investment or other advice. The recipient should consult its own counsel, accountant, investment, tax, and any other advisers for this advice, including economic risks and merits, related to making an investment with Western Asset. The recipient is responsible for observing the applicable laws and regulations of their country of residence.
Founded in 1971, Western Asset Management Company is a global fixed-income investment manager with offices in Pasadena, New York, London, Singapore, Tokyo, Melbourne, São Paulo, Hong Kong, and Zürich. Western Asset is a wholly owned subsidiary of Franklin Resources, Inc. but operates autonomously. Western Asset is comprised of six legal entities across the globe, each with distinct regional registrations: Western Asset Management Company, LLC, a registered Investment Adviser with the Securities and Exchange Commission; Western Asset Management Company Ltda. is regulated by Comissão de Valores Mobiliários; Western Asset Management Company Pty Ltd ABN 41 117 767 923 is the holder of the Australian Financial Services License 303160; Western Asset Management Company Pte. Ltd. Co. Reg. No. 200007692R is a holder of a Capital Markets Services License for fund management and regulated by the Monetary Authority of Singapore; Western Asset Management Company Ltd, a registered Financial Instruments Business Operator and regulated by the Financial Services Agency of Japan; and Western Asset Management Company Limited is authorised and regulated by the Financial Conduct Authority ("FCA") (FRN 145930). This communication is intended for distribution to Professional Clients only if deemed to be a financial promotion in the UK as defined by the FCA. This communication may also be intended for certain EEA countries where Western Asset has been granted permission to do so. For the current list of the approved EEA countries please contact Western Asset at +44 (0)20 7422 3000.