skip navigation
Blog

Stay up to date on timely topics and market events. Subscribe to our Blog now.

ECONOMY
May 15, 2020

Some Interesting Detail Within the Rubble of Retail

By Michael J. Bazdarich, PhD

Stay up to date on timely topics and market events. Subscribe to our Blog now.

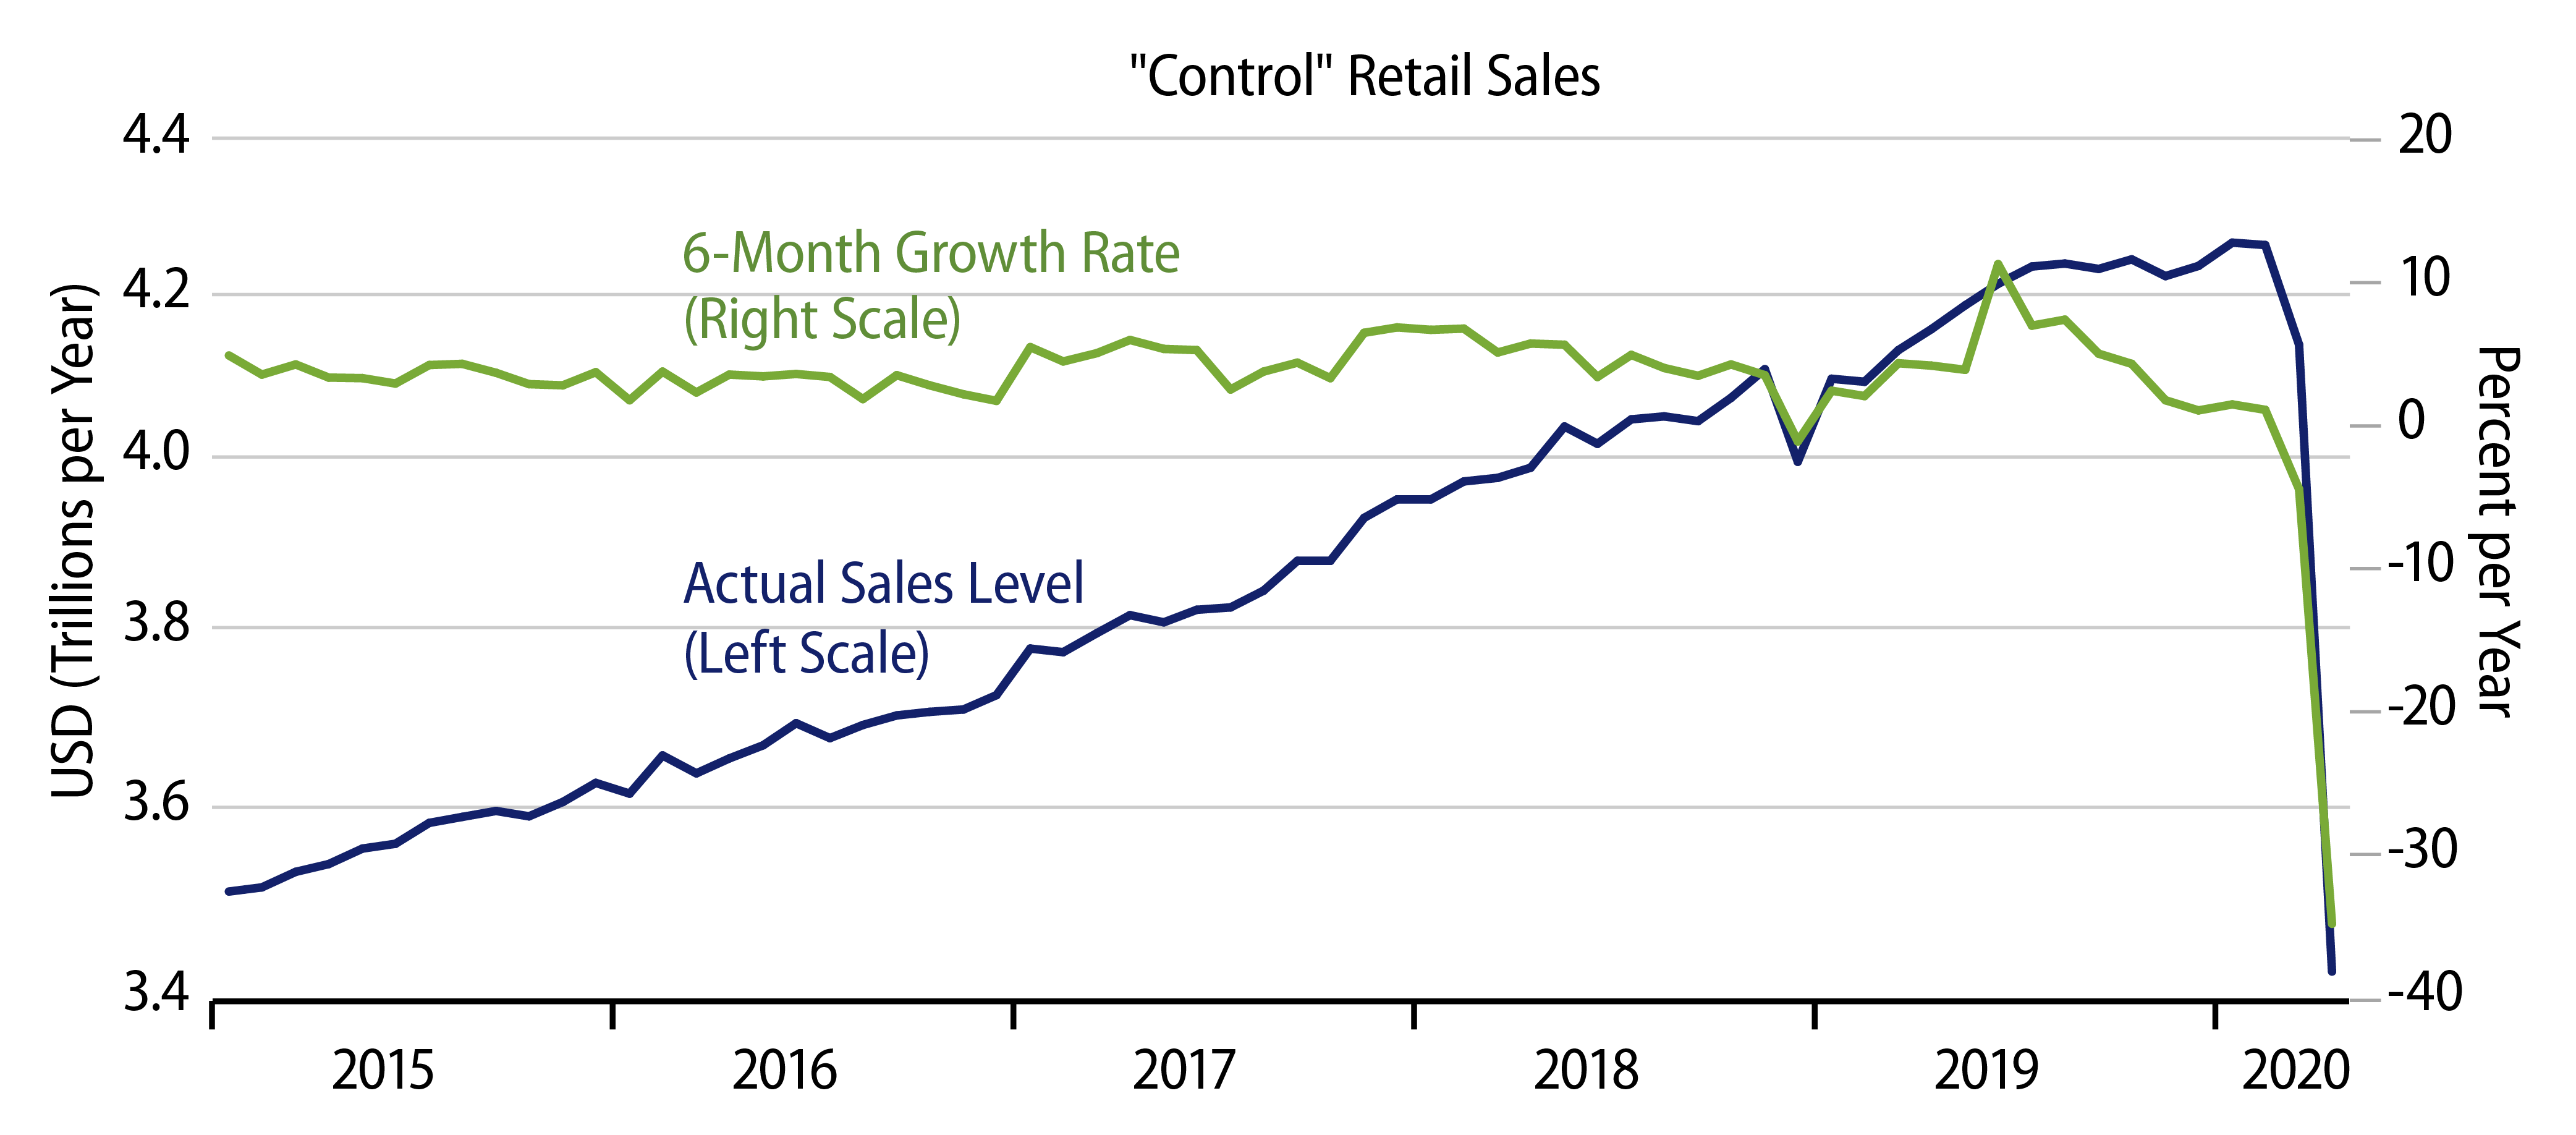
Retail sales declined 16.4% in April on top of an 8.3% decline in March, for a 23.3% cumulative drop across the two months. The “control” sales measure we track, total sales less those at vehicle dealers, building material stores and service stations declined 17.2%, following a 2.9% decline in March. Most other analysts also subtract restaurant sales from their control measure, and with that further abstraction, control sales declined 15.3% in April, following a 3.1% gain in March.

It should be clear from these disparate numbers that there was a lot of sturm und drang in the retail data. As sobering as the last few months’ retail declines are, they do provide some interesting detail about retail.

Some retail sectors that were hammered in March saw somewhat milder declines in April. Other sectors saw sales gains in March that could not be sustained in April, while still others have seen a rush of activity.

The sectors seeing milder-than-expected April declines were motor vehicle sales and restaurants. Remember, the shutdown set in about mid-March, so one would have expected so see sectors hard hit by the shutdown show sales declines (in dollar terms) just as sharp in April as those in March, since March sales showed half a month of shutdown effects, while April showed a full month of shutdown. With the Big 3 suspending production mid-March, vehicle sales declined 27.0% in March, or by -$26.3 billion. The decline in April was “only” 13.1%, or -$9.3 billion, suggesting either that vehicle sales slowed well before the general shutdown or else that some vehicle purchases could not be postponed any longer.

Similarly, restaurant sales dropped a staggering 29.8% in March, or by -$19.5 billion. In April, the drop looks just as bad in percent terms, -29.4%, but was much milder in dollar terms, -$12.5 billion. Here, it would appear that the resort to take-out and home delivery of food kept the April restaurant sales decline from being as sharp as it otherwise might have been.

March sales gains were very sharp for grocery and warehouse stores. With household hoarding largely complete and shelf inventories depleted, there was no way those March sales rates would be sustained. Indeed, grocery stores saw a sales drop of 13.1% or -$10.7 billion in April, following the 26.9% or $17.3 billion gain in March. Preliminary data suggest that warehouse stores saw sales drop 18.4% or -$5.7 billion in April, following a 12.9% or $5.4 billion gain in March.

Not surprisingly, nonstore (online) retailers continued to prosper in April, with sales up 8.4% or $6.1 billion, following a 4.9% or $3.4 billion gain in March. At the other end of the spectrum, but also not surprisingly, service station sales fell 28.8% or -$9.9 billion in April, following a decline of 16.5% or -$6.8 billion in March, though much of the declines here reflect sharply lower gas prices. Finally, sales at clothing, department, furniture, electronics and book/hobby/sporting stores all declined more sharply in April than in March.

With most store types re-opening for at least curbside service, hopefully April will be the low-water mark for retail in general and for the hard-hit store types recounted here. We believe the coming economic rebound will be sharper and quicker than most analysts expect, but in order for this to happen, of course, the stores must be open. With that re-opening slowly emerging, it is looking as though the nation is beginning to embark on phase 2 of what will prove to be a multi-phase “project” regarding our experience with this ailment.

Exhibit 1: Retail Sales Trend
Explore Retail Sales Trend
Census Bureau. As of 30 Apr 20. Select the image to expand the view. “Control” retail sales is total sales less vehicle dealers, service stations and building material stores.
© Western Asset Management Company, LLC 2024. The information contained in these materials ("the materials") is intended for the exclusive use of the designated recipient ("the recipient"). This information is proprietary and confidential and may contain commercially sensitive information, and may not be copied, reproduced or republished, in whole or in part, without the prior written consent of Western Asset Management Company ("Western Asset").
Past performance does not predict future returns. These materials should not be deemed to be a prediction or projection of future performance. These materials are intended for investment professionals including professional clients, eligible counterparties, and qualified investors only.
These materials have been produced for illustrative and informational purposes only. These materials contain Western Asset's opinions and beliefs as of the date designated on the materials; these views are subject to change and may not reflect real-time market developments and investment views.
Third party data may be used throughout the materials, and this data is believed to be accurate to the best of Western Asset's knowledge at the time of publication, but cannot be guaranteed. These materials may also contain strategy or product awards or rankings from independent third parties or industry publications which are based on unbiased quantitative and/or qualitative information determined independently by each third party or publication. In some cases, Western Asset may subscribe to these third party's standard industry services or publications. These standard subscriptions and services are available to all asset managers and do not influence rankings or awards in any way.
Investment strategies or products discussed herein may involve a high degree of risk, including the loss of some or all capital. Investments in any products or strategies described in these materials may be volatile, and investors should have the financial ability and willingness to accept such risks.
Unless otherwise noted, investment performance contained in these materials is reflective of a strategy composite. All other strategy data and information included in these materials reflects a representative portfolio which is an account in the composite that Western Asset believes most closely reflects the current portfolio management style of the strategy. Performance is not a consideration in the selection of the representative portfolio. The characteristics of the representative portfolio shown may differ from other accounts in the composite. Information regarding the representative portfolio and the other accounts in the composite are available upon request. Statements in these materials should not be considered investment advice. References, either general or specific, to securities and/or issuers in the materials are for illustrative purposes only and are not intended to be, and should not be interpreted as, recommendation to purchase or sell such securities. Employees and/or clients of Western Asset may have a position in the securities or issuers mentioned.
These materials are not intended to provide, and should not be relied on for, accounting, legal, tax, investment or other advice. The recipient should consult its own counsel, accountant, investment, tax, and any other advisers for this advice, including economic risks and merits, related to making an investment with Western Asset. The recipient is responsible for observing the applicable laws and regulations of their country of residence.
Founded in 1971, Western Asset Management Company is a global fixed-income investment manager with offices in Pasadena, New York, London, Singapore, Tokyo, Melbourne, São Paulo, Hong Kong, and Zürich. Western Asset is a wholly owned subsidiary of Franklin Resources, Inc. but operates autonomously. Western Asset is comprised of six legal entities across the globe, each with distinct regional registrations: Western Asset Management Company, LLC, a registered Investment Adviser with the Securities and Exchange Commission; Western Asset Management Company Distribuidora de Títulos e Valores Mobiliários Limitada is authorized and regulated by Comissão de Valores Mobiliários and Brazilian Central Bank; Western Asset Management Company Pty Ltd ABN 41 117 767 923 is the holder of the Australian Financial Services License 303160; Western Asset Management Company Pte. Ltd. Co. Reg. No. 200007692R is a holder of a Capital Markets Services License for fund management and regulated by the Monetary Authority of Singapore; Western Asset Management Company Ltd, a registered Financial Instruments Business Operator and regulated by the Financial Services Agency of Japan; and Western Asset Management Company Limited is authorised and regulated by the Financial Conduct Authority ("FCA") (FRN 145930). This communication is intended for distribution to Professional Clients only if deemed to be a financial promotion in the UK as defined by the FCA. This communication may also be intended for certain EEA countries where Western Asset has been granted permission to do so. For the current list of the approved EEA countries please contact Western Asset at +44 (0)20 7422 3000.