

Private-sector payroll jobs rose by 653,000 in February, with a +62,000 revision to the estimate for January jobs. Job gains were ubiquitous across industries. In the bad old days of broadcast cigarette ads, one brand advertised “not a cough in a carload.” That slogan came to mind when pouring over today’s employment report, as there was no aspect of it displaying any bad news.
Even for those of us looking for inflation to subside, there was helpful news, as labor force participation rates rose further and average wages were unchanged. The wage subsidence is likely largely a “mix effect,” as many of the added jobs were in lower-wage positions working to pull down the average wage, thus offsetting likely wage gains for retained workers.
To get technical for a moment, “wage inflation” concerns the average growth rate in hourly wages. Instead, the employment report tells us the growth rate in average wages, and again, the mix of wage rates across different jobs thus comes into play here. It is likely that February saw some deceleration in the rate of wage growth for workers remaining in their jobs, but we don’t know this for sure from the available data. The Employment Cost Index, released quarterly, filters out these mix effects and so gives a better measure of the actual wage inflation, but it won’t be available for 1Q until late-April.
Meanwhile, even though the February increase in labor force participation was not as large as that of previous months, it still continued its upward trend. Since extended unemployment benefits expired last October, the labor force participation rate has risen by 0.6 percentage points from 61.7% to 62.3%, reflecting an increase of 2.4 million potential workers into the labor force opposite a 1.4 million increase in the adult population. In the post-GFC recovery, jobs and labor-force participation rose rapidly when extended unemployment benefits expired, and we are seeing the same phenomenon presently.
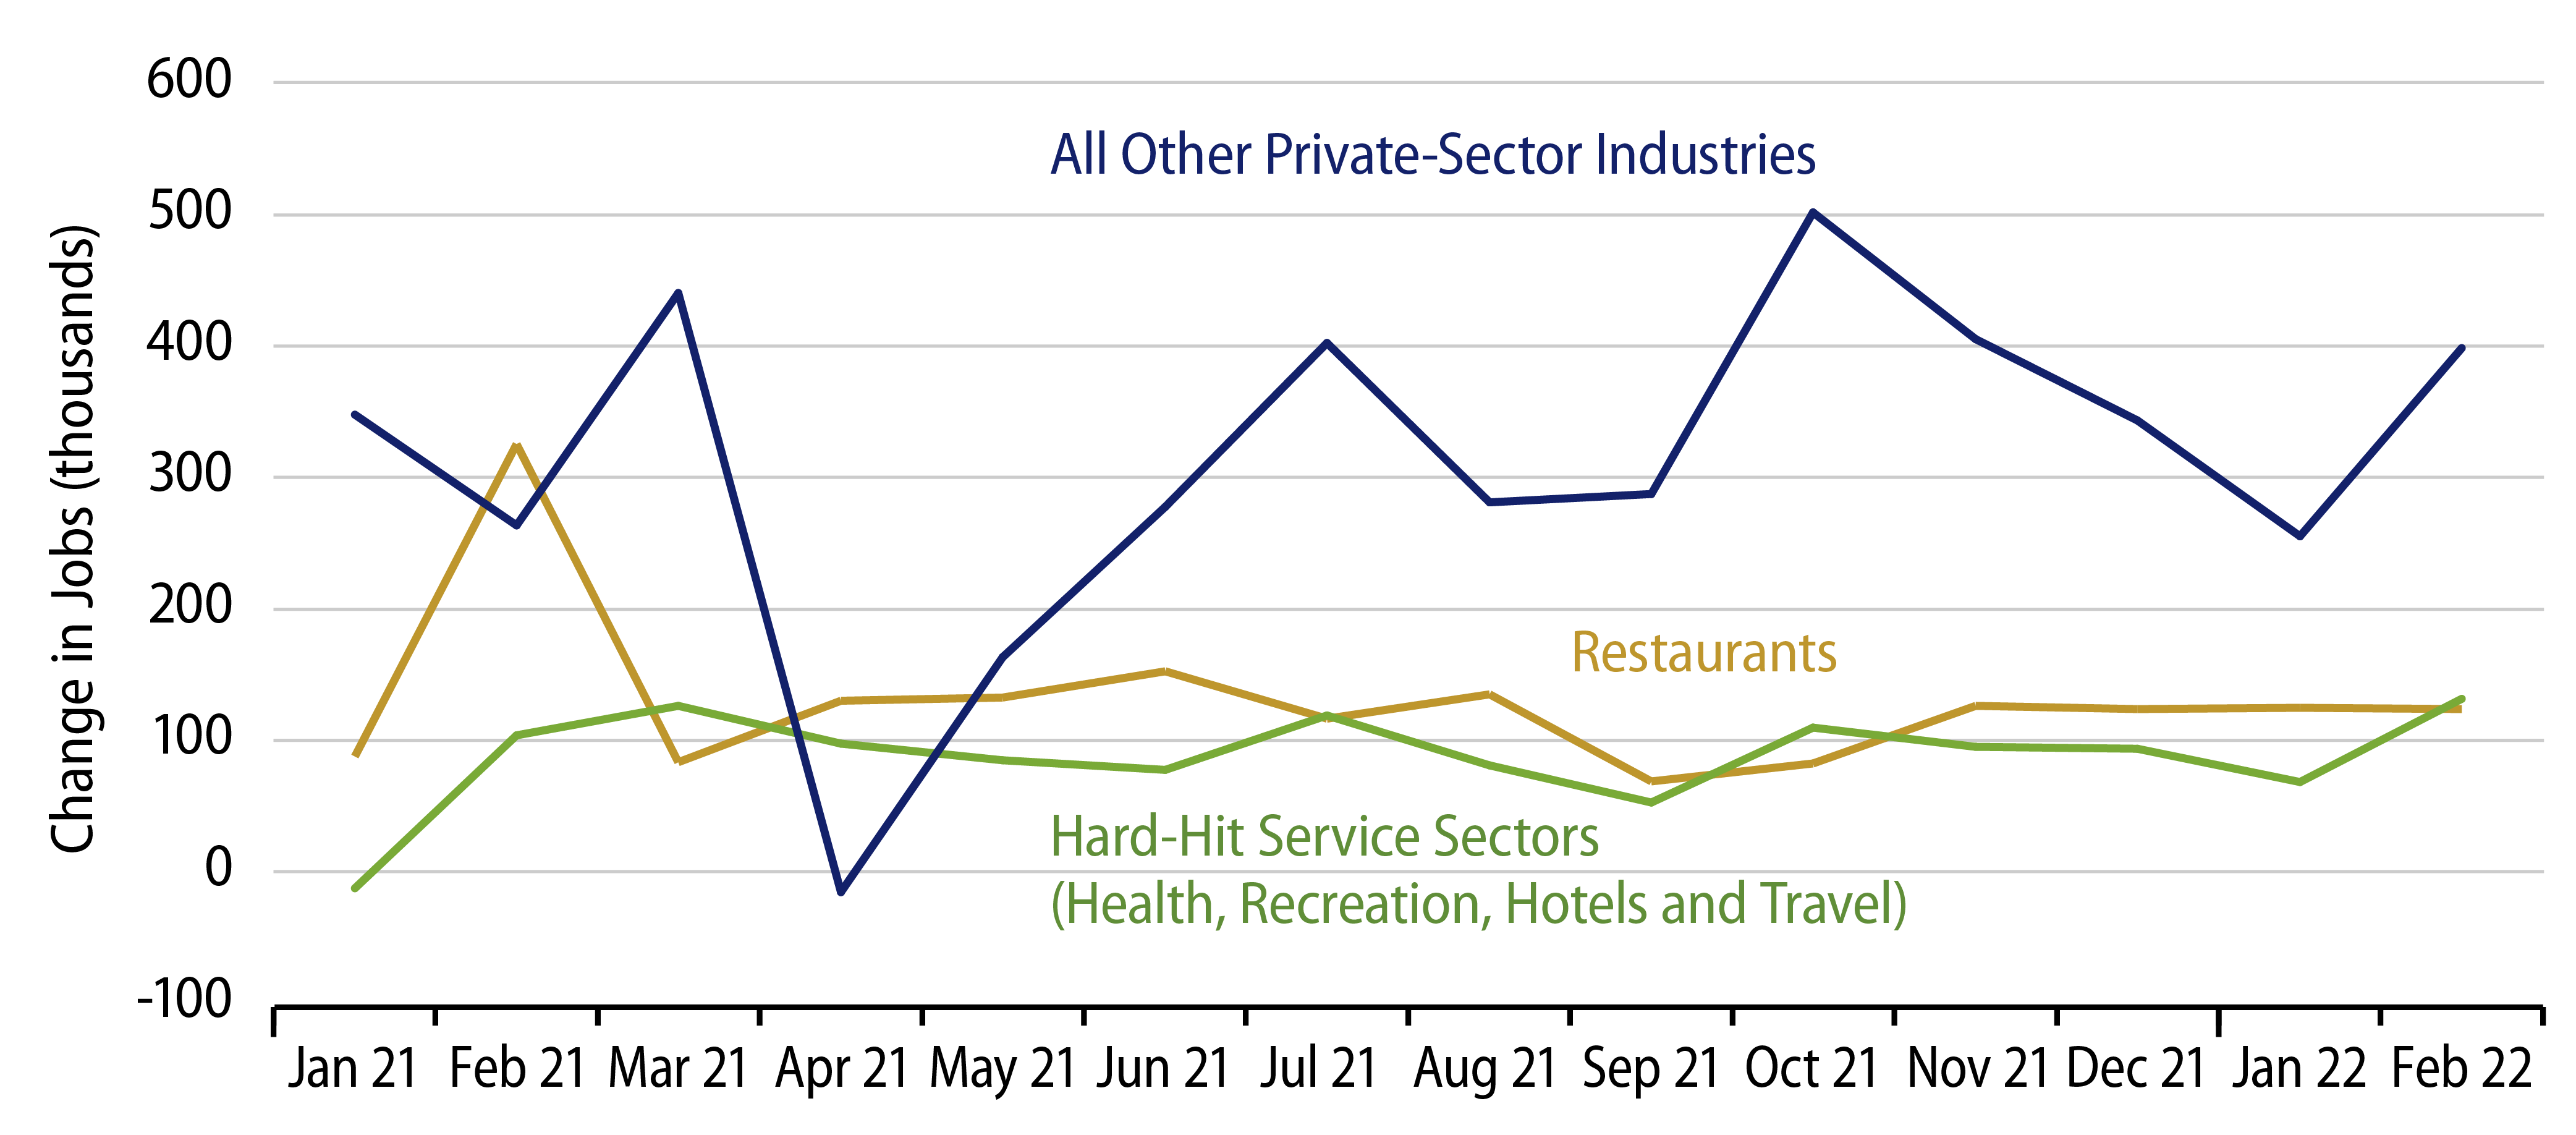
A month ago, we remarked that the benchmark revisions announced with the January payroll report took job growth out of early-2021 and put it into late-2021, with no net change to late-2021 employment levels. The result is a much smoother pattern of job gains in industries that have been hit hard by Covid restrictions: restaurants, hotels, etc.
You can see this in the smoother patterns for the blue and gold lines in the chart. Two months ago, the then-current version of this chart showed distinct, slowing trends for all the aggregates plotted here, but, again, that slowing was revised away.
So, the payroll data currently show no ill effects of the restrictions imposed to fight the omicron variant of Covid. In contrast, retail sales and consumer spending showed markedly softer patterns in recent months. So, at present, there is a disconnect in this respect between labor market indicators and the spending data that will comprise 1Q GDP. Meanwhile, the labor markets continue their long path of recovery back to pre-Covid stature.