

Private-sector payroll jobs rose a healthy 229,000 in May, offset only slightly by a -20,000 revision to the April jobs estimate. In addition, average workweeks held steady in May, from a downwardly revised April estimate, and the 0.4% May gain in average hourly earnings was a rebound from the 0.2% gain reported for April. The only blemish in this robust report was a -408,000 decline in household survey jobs and a consequent increase in the unemployment rate from 3.8% in April to 4.0% in May.
After sputtering a bit in late 2023, job growth rebounded in 1Q, only to slow a bit in April. The May gains are right in line with what we saw in 1Q.
May’s job gains were pretty evenly split between sectors especially hard hit by the Covid shutdown and the rest of the economy, as detailed in the chart. What we call the Covid epicenter sectors are still working to re-attain pre-shutdown staffing levels, and as a result, they are registering stronger job growth than what prevailed prior to the pandemic. The poster child for this comeback is health care, which all by itself has averaged job growth of 65,000 per month so far this year. Elsewhere among the ''Covid-afflicted,'' restaurant sales have plateaued in recent months, but that didn’t stop restauranteurs from adding another 26,000 workers to staff in May.
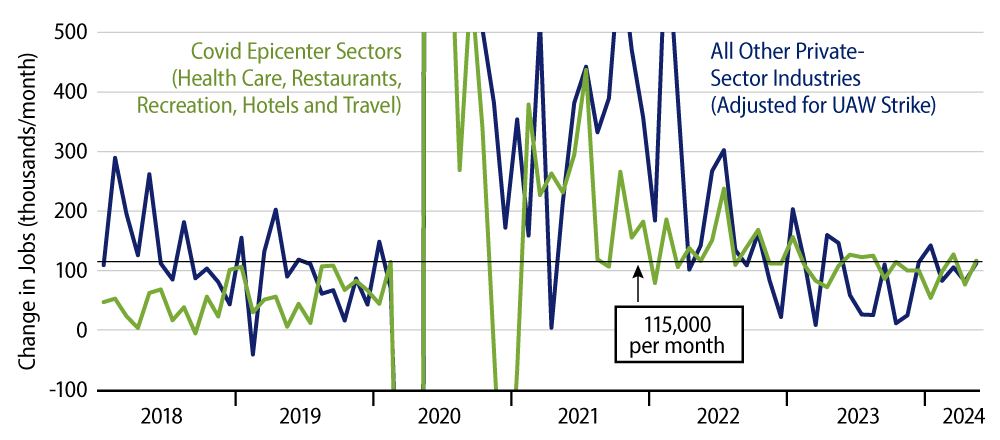
In sectors less affected by the Covid shutdown, job growth was healthy in May as well. These sectors were where job growth slowed in late 2023, but so far this year, they have generally maintained job growth right in line with what we were seeing pre-pandemic.
The disparity between job growth as reported by the payroll survey and by the establishment survey has been an issue for more than a year now. In 2024 to date alone, total nonfarm payroll jobs have risen 1.239 million, while civilian employment has risen only 0.250 million. The payroll survey covers ''jobs,'' while the household survey covers ''workers,'' but it is hard to credit this disparity to second and third jobs rising fast enough to explain the difference in these metrics. Rather, it would seem to reflect bad data in one or the other.
Our judgment is that the payroll survey is the more accurate indicator generally, which is why we focus on it in these posts. It is hard to know how much to make of the softer recent performance in the household survey. The household survey does show a noticeable increase in unemployment over the last year, from 3.4% to 4.0%.
As relayed in these posts, the economic releases of the past month had shown noticeably softer growth. While the softer performance in the April payroll report was a one-month phenomenon, slowing spending growth looked more sustained for consumption, construction spending, home sales and factory orders. We’ll see whether the stronger tone to the May payroll report carries through to these other indicators.
While our expectation is that the softer-growth indications will prevail, we didn’t get any love for this storyline from the payroll report today.