Municipal Yields Moved Modestly Higher Across the Curve
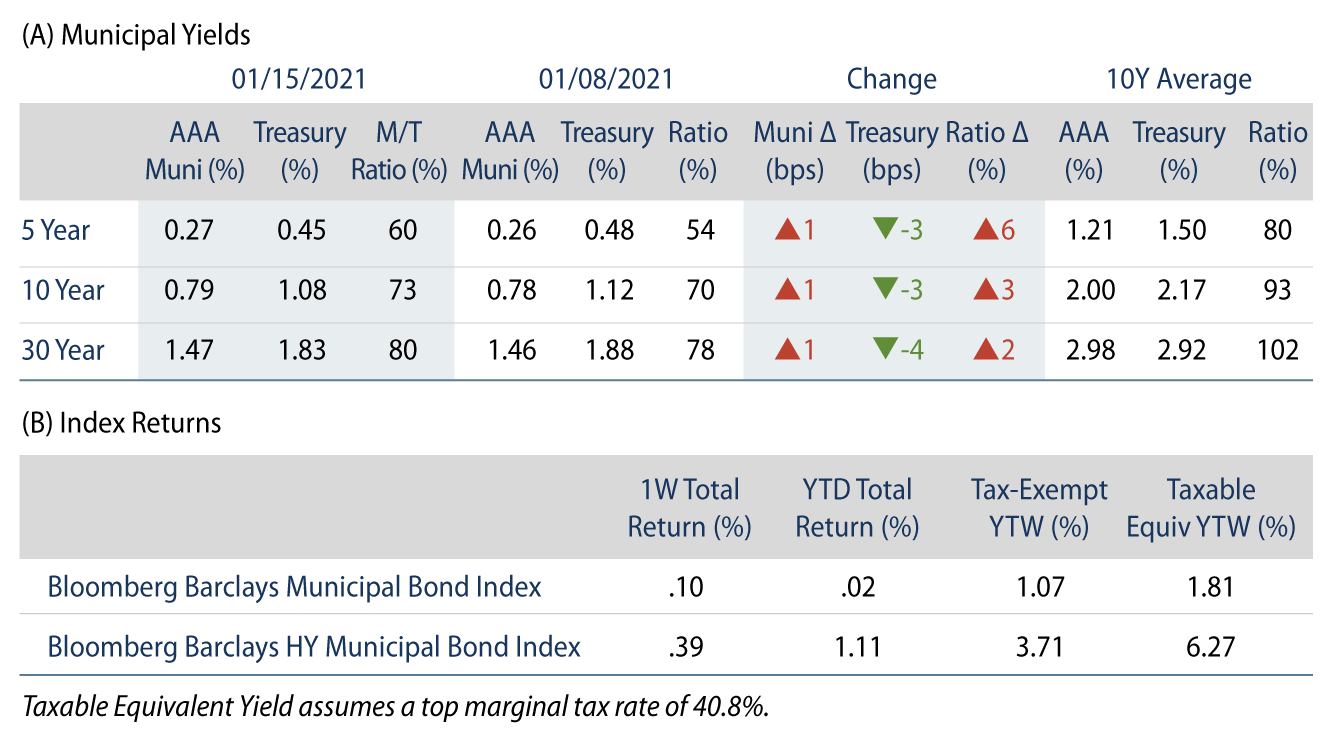
Municipal yields moved modestly higher across the curve, underperforming Treasuries. Municipal mutual funds recorded a tenth consecutive week of inflows. AAA municipal yields moved 1 bp higher across the curve. Municipals cheapened versus Treasuries and Municipal/Treasury ratios reverted from record lows observed last week, but remained below historical averages. The Bloomberg Barclays Municipal Index returned 0.10%, while the HY Muni Index returned 0.39%. This week we evaluate the federal stimulus impact on state and local budgets.
Demand for Tax-Exempt Income Remains Robust as Issuance Picks Up
Fund Flows: During the week ending January 13, municipal mutual funds recorded a tenth consecutive week of net inflows, with $2.6 billion, according to Lipper. Long-term funds recorded $1.6 billion of inflows, intermediate funds recorded $440 million of inflows and high-yield funds recorded $1.1 billion of inflows. Year-to-date (YTD) net inflows total $8.7 billion.
Supply: The muni market recorded $6.8 billion of new-issue volume during the week, up 105% from the prior week. New issuance YTD reached $10.1 billion, with over 30% of issuance coming in the form of taxable supply. This week’s new-issue calendar is expected to increase to $7.2 billion (+8.3% week-over-week) despite the holiday-shortened week. The largest deals include $1.4 billion New Jersey Turnpike and $1.3 billion Port Authority of NY/NJ transactions.
This Week in Munis: Stimulus Impact on State Budgets
Last week the Biden administration released a new round of stimulus proposals, including support for state and local governments to help address revenue shortfalls associated with the pandemic. Despite Congress not passing such a measure in the latter half of 2020, states have significantly benefited from the unprecedented stimulus of the CARES Act and the other measures that followed in 2020. Direct aid to states in March of last year, along with federal support for individuals and businesses were supportive of income and sales tax collections, which are both primary sources of state revenue collections.
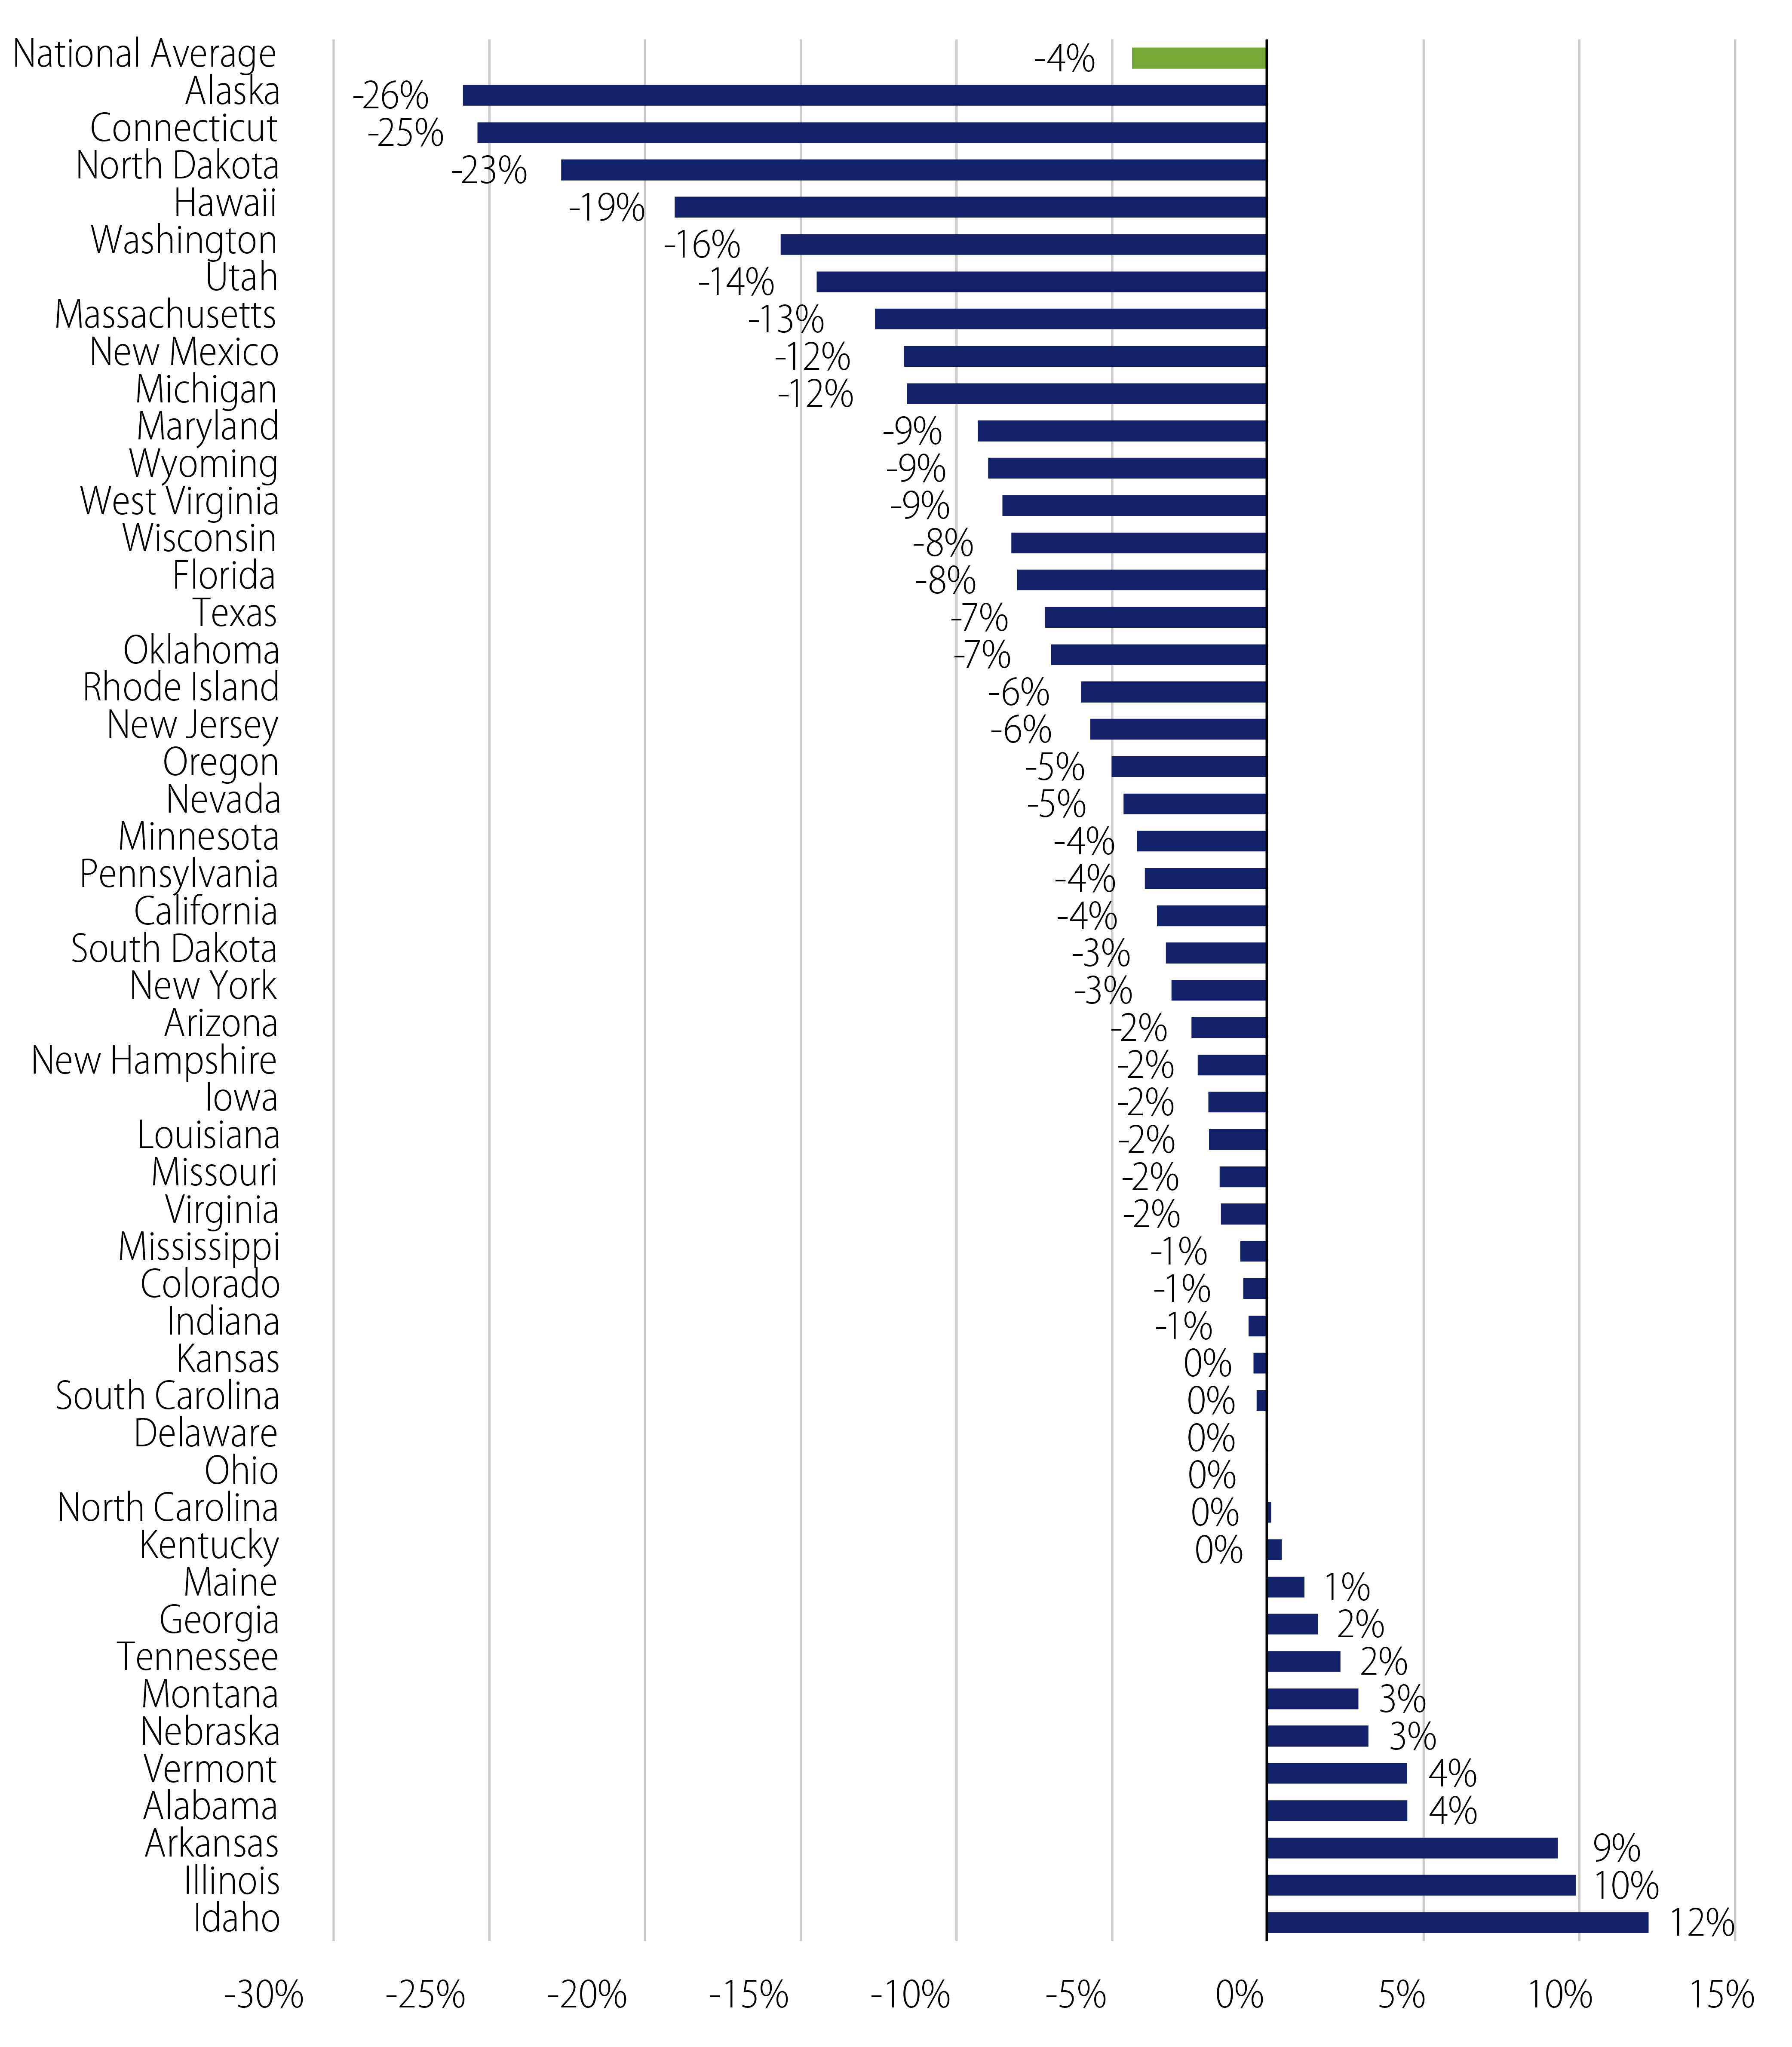
At the beginning of the pandemic, third-party estimates of fiscal year 2021 state revenue shortfalls ranged from $130 billion to $200 billion, over double the impact of the 2007 recession. Those original estimates now appear aggressive when considering the most recently released 3Q20 Census State Revenue Report, which highlights just a $37 billion YTD decline (-4.4%) in total state tax collections in 2020. This decline was driven by a $10.5 billion decrease in sales taxes (-4.1% year-over-year or YoY), a $10.2 billion decline in individual income taxes (-3.1% YoY), and a $4.9 billion decrease in corporate income taxes (-9.9% YoY) across the nation.
We have already observed that the better-than-expected revenue collections translate to state budget improvement. Texas recently announced its current year deficit had declined to nearly $1 billion, significantly lower than the $4.6 billion original shortfall expected earlier in 2020. The state of California is now projecting a fiscal year 2021 surplus of $26 billion following a projected deficit of approximately $54 billion earlier in 2020, partially driven by better-than-expected capital gains.
Importantly, not all states are impacted by the pandemic equally, which underscores the need for independent and thorough credit analysis for municipal portfolios. Alaska, Connecticut, North Dakota and Hawaii reported the largest declines in tax collections, ranging from -19% to -26% YoY. We continue to expect these revenue shortfalls, paired with a labor market that remains severely wounded, to serve as a headwind for states over the cyclical horizon and contribute to austerity measures that will lead downgrades to outpace upgrades throughout 2021. However, the level of austerity will ultimately be informed by the length of the pandemic and future federal stimulus, which have been proven supportive of state budgets throughout the pandemic conditions thus far.