skip navigation
Blog

Stay up to date on timely topics and market events. Subscribe to our Blog now.

MARKETS
August 18, 2025

Muni Monthly—July 2025

By Sam Weitzman

Stay up to date on timely topics and market events. Subscribe to our Blog now.

Performance Overview

Municipals posted positive returns as rates rallied in July.

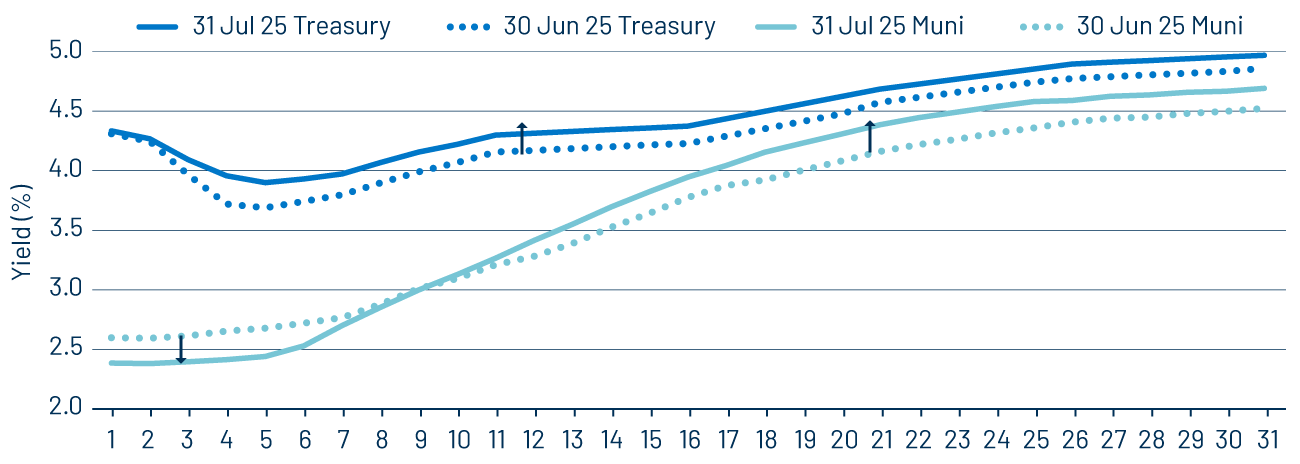
In July, fixed-income yields generally moved higher amid stronger than expected economic data. Second quarter GDP rose 3.0% quarter-over-quarter, well above consensus expectations of 2.6%. Consumer Price Index (CPI) and Personal Consumption Expenditures (PCE) data also exceeded expectations, reducing the likelihood that the Federal Reserve would reduce interest rates at month end. While Treasury yields moved higher across the curve, the AAA municipal yield curve steepened, with yields moving lower in short maturities and higher in longer maturities.

Exhibit 1: Municipal and Treasury Yield Curves
Municipal and Treasury Yield Curves
Source: Bloomberg, Western Asset. As of 31 Jul 25. Select the image to expand the view.

Supply and Demand Technicals

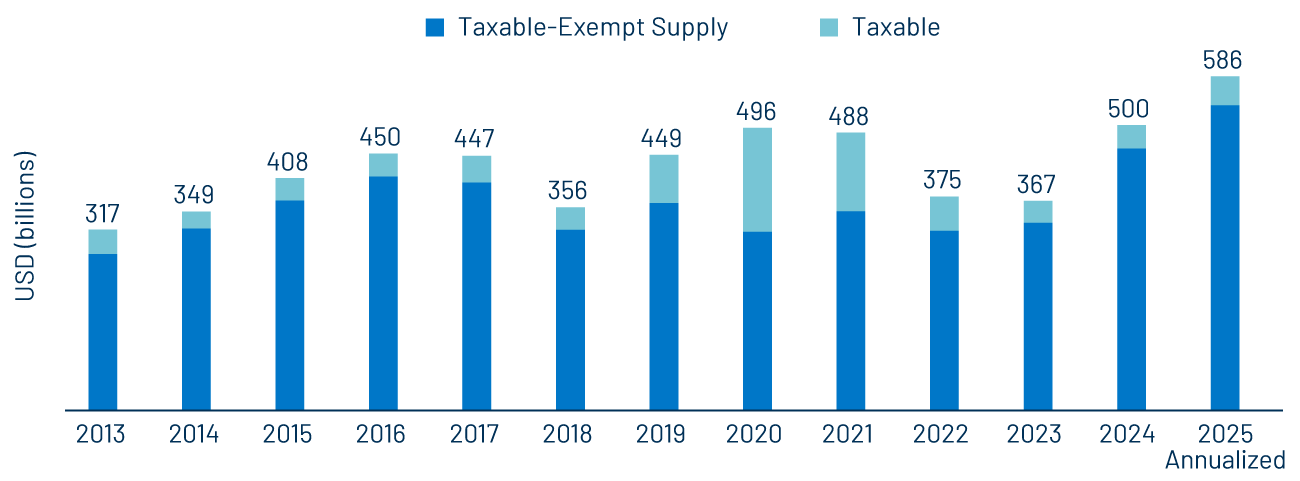
Muni supply remains at a record pace this year.

Municipal supply maintained a record pace, as July supply increased 18% from July 2024 levels to $57 billion. Year-to-date (YTD) municipal issuance totaled $342 billion, 22% higher than the record levels of the prior year. Tax-exempt supply increased 22% year-over-year to $313 billion YTD. Taxable municipal issuance totaled $29 billion this year, a 20% increase compared to last year.

Municipal demand remained positive as ICI reported that weekly reporting municipal mutual funds recorded $7 billion of net inflows. Short duration and intermediate categories recorded the majority of net inflows during the month. July’s net inflows increased YTD net inflows to $25 billion.

Exhibit 2: Historical Municipal Supply
Historical Municipal Supply
Source: ICI, Western Asset, Bloomberg. As of 31 Jul 25. Select the image to expand the view.

Fundamentals

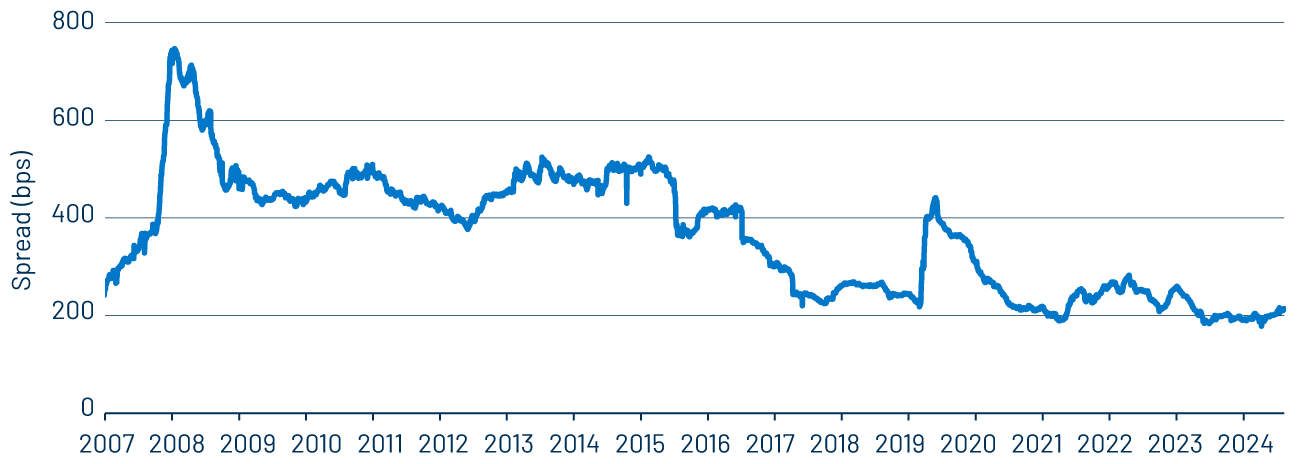
High-yield credit spreads remain near decade tights.

Traditional state and local municipal credit continues to benefit from elevated tax collections and cash balances that have supported upgrades that outpaced downgrades this year. However, select high-yield issuers were mentioned by name in the headlines during the month. On July 30, a top-10 issuer in the High Yield Muni Index, Brightline Trains, was downgraded to B by the agency. Note that this issue was originated in 2024 with a BBB- rating by Fitch. This is an example of potentially concentrated positions within high-yield portfolios that we believe underscore the value of diligent credit research, particularly in a tight credit spread environment where compensation for risks is less than what was observed in the past.

Exhibit 3: Bloomberg High Yield Index YTW vs. Bloomberg AAA YTW
Bloomberg High Yield Index YTW vs. Bloomberg AAA YTW
Source: Bloomberg. As of 31 Jul 25. Select the image to expand the view.
Yield-to-worst (YTW) is the lowest potential yield that can be received on a bond without the issuer actually defaulting.

Valuations

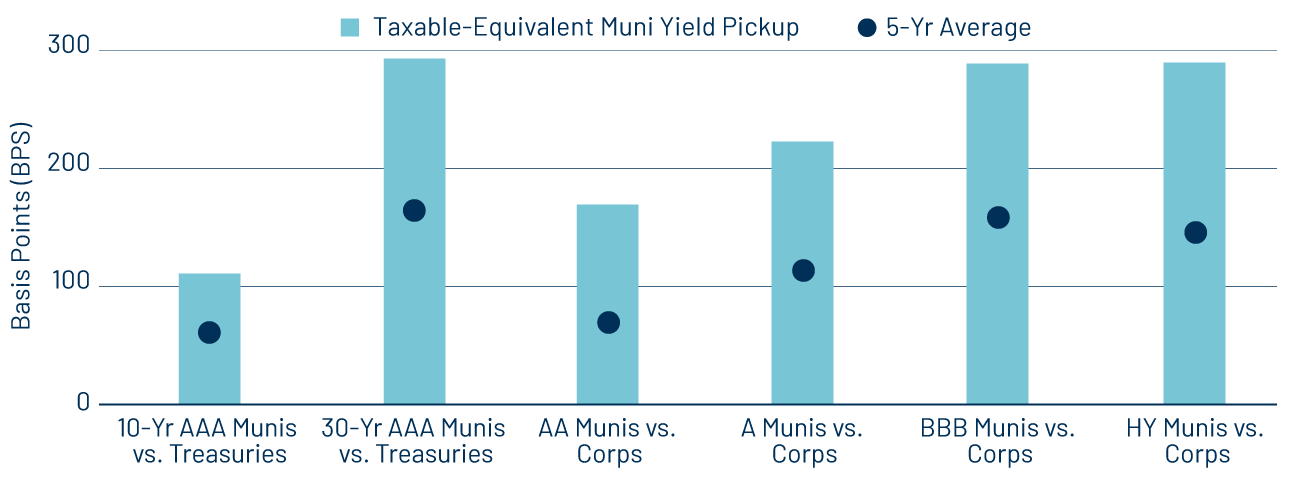
For high taxpayers, municipals offer above-average after-tax relative value compared to their taxable counterparts.

Record supply conditions and negative muni performance YTD have resulted in improved tax-exempt income opportunities and relative valuations. The Bloomberg Muni Bond Index average yield-to-worst of 3.98% at month end, which is 6.72% on a taxable-equivalent basis for top taxpayers. Across the curve and credit spectrum, municipal credit currently offers 100-290 basis points of taxable-equivalent yield pickup versus like-structured Treasuries and corporate counterparts. Given the tighter spread conditions, we anticipate that credit selection will be increasingly influential in achieving this relative value across credit cohorts.

Exhibit 4: Taxable-Equivalent Municipal Yield Pickup vs. the 5-Year Average
Taxable-Equivalent Municipal Yield Pickup vs. the 5-Year Average
Source: Bloomberg, Western Asset. As of 30 Jun 25. 10- and 30-year comparison reflects Bloomberg Valuation Service (BVAL) AAA Muni Curve and US On-/Off-the-Run Sovereign Curve. AA Muni reflects the Bloomberg AA Muni Bond Index. A Muni reflects the Bloomberg A Muni Bond Index. BBB Muni reflects the Bloomberg BBB Muni Bond Index. HY Muni reflects the Bloomberg High Yield Muni Bond Index. AA Corp reflects the Bloomberg AA Corporate Bond Index. A Corp reflects the Bloomberg A Corporate Bond Index. BBB Corp reflects the Bloomberg BBB Corporate Bond Index. Taxable-equivalent yield considers top marginal tax rate of 40.8%. Indexes are unmanaged and one cannot directly invest in them. They do not include fees, expenses or sales charges. Past performance is not an indicator or a guarantee of future results. Select the image to expand the view.

© Western Asset Management Company, LLC 2025. The information contained in these materials ("the materials") is intended for the exclusive use of the designated recipient ("the recipient"). This information is proprietary and confidential and may contain commercially sensitive information, and may not be copied, reproduced or republished, in whole or in part, without the prior written consent of Western Asset Management Company ("Western Asset").
Past performance does not predict future returns. These materials should not be deemed to be a prediction or projection of future performance. These materials are intended for investment professionals including professional clients, eligible counterparties, and qualified investors only.
These materials have been produced for illustrative and informational purposes only. These materials contain Western Asset's opinions and beliefs as of the date designated on the materials; these views are subject to change and may not reflect real-time market developments and investment views.
Third party data may be used throughout the materials, and this data is believed to be accurate to the best of Western Asset's knowledge at the time of publication, but cannot be guaranteed. These materials may also contain strategy or product awards or rankings from independent third parties or industry publications which are based on unbiased quantitative and/or qualitative information determined independently by each third party or publication. In some cases, Western Asset may subscribe to these third party's standard industry services or publications. These standard subscriptions and services are available to all asset managers and do not influence rankings or awards in any way.
Investment strategies or products discussed herein may involve a high degree of risk, including the loss of some or all capital. Investments in any products or strategies described in these materials may be volatile, and investors should have the financial ability and willingness to accept such risks.
Unless otherwise noted, investment performance contained in these materials is reflective of a strategy composite. All other strategy data and information included in these materials reflects a representative portfolio which is an account in the composite that Western Asset believes most closely reflects the current portfolio management style of the strategy. Performance is not a consideration in the selection of the representative portfolio. The characteristics of the representative portfolio shown may differ from other accounts in the composite. Information regarding the representative portfolio and the other accounts in the composite are available upon request. Statements in these materials should not be considered investment advice. References, either general or specific, to securities and/or issuers in the materials are for illustrative purposes only and are not intended to be, and should not be interpreted as, recommendation to purchase or sell such securities. Employees and/or clients of Western Asset may have a position in the securities or issuers mentioned.
These materials are not intended to provide, and should not be relied on for, accounting, legal, tax, investment or other advice. The recipient should consult its own counsel, accountant, investment, tax, and any other advisers for this advice, including economic risks and merits, related to making an investment with Western Asset. The recipient is responsible for observing the applicable laws and regulations of their country of residence.
Founded in 1971, Western Asset Management Company is a global fixed-income investment manager with offices in Pasadena, New York, London, Singapore, Tokyo, Melbourne, São Paulo, Hong Kong, and Zürich. Western Asset is a wholly owned subsidiary of Franklin Resources, Inc. but operates autonomously. Western Asset is comprised of six legal entities across the globe, each with distinct regional registrations: Western Asset Management Company, LLC, a registered Investment Adviser with the Securities and Exchange Commission; Western Asset Management Company Ltda. is regulated by Comissão de Valores Mobiliários; Western Asset Management Company Pty Ltd ABN 41 117 767 923 is the holder of the Australian Financial Services License 303160; Western Asset Management Company Pte. Ltd. Co. Reg. No. 200007692R is a holder of a Capital Markets Services License for fund management and regulated by the Monetary Authority of Singapore; Western Asset Management Company Ltd, a registered Financial Instruments Business Operator and regulated by the Financial Services Agency of Japan; and Western Asset Management Company Limited is authorised and regulated by the Financial Conduct Authority ("FCA") (FRN 145930). This communication is intended for distribution to Professional Clients only if deemed to be a financial promotion in the UK as defined by the FCA. This communication may also be intended for certain EEA countries where Western Asset has been granted permission to do so. For the current list of the approved EEA countries please contact Western Asset at +44 (0)20 7422 3000.