Performance Overview
Munis posted positive returns in January.
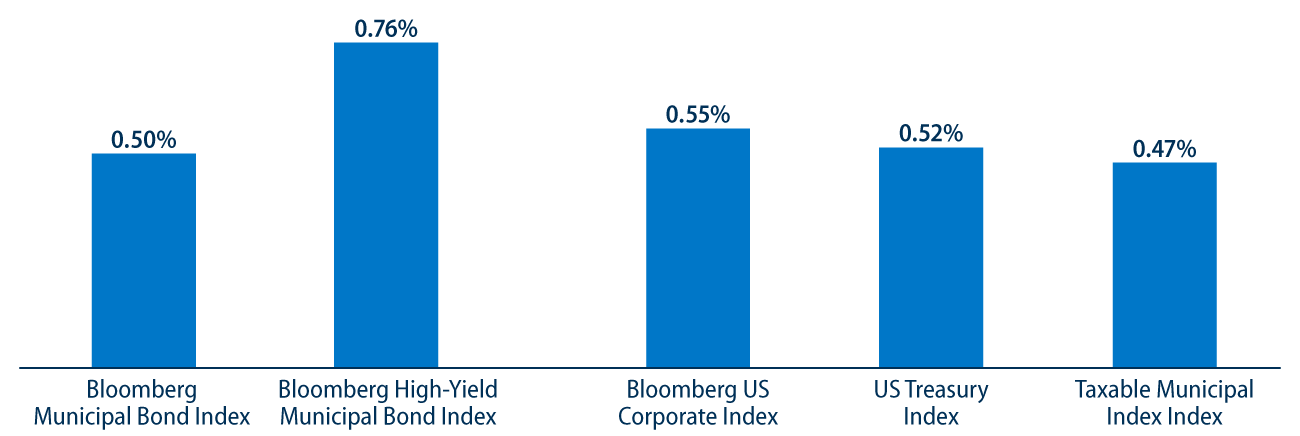
Munis posted positive returns in January, in line with other taxable fixed-income sectors. Fourth quarter GDP came in below expectations and continued to trend lower at 2.3% from the prior quarter. Inflation data aligned with expectations but year-over-year (YoY) Consumer Price Index (CPI) and Personal Consumption Expenditures (PCE) figures moved higher from the prior month while December nonfarm payrolls exceeded expectations. The yield curve steepened as the high-grade muni curve moved 9-15 basis points (bps) lower in short maturities and 7 bps higher in longer maturities. The Bloomberg Municipal Bond Index returned 0.50% in January. Maturities of less than 15 years generally outperformed, as did lower-investment-grade and high-yield segments.
Supply and Demand Technicals
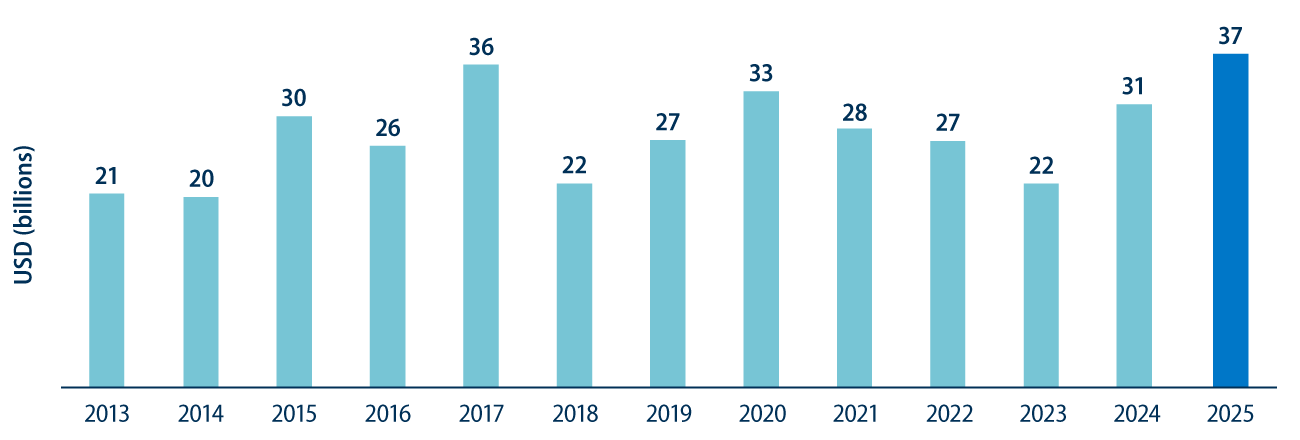
Supply continued at an elevated pace in January.
January new issuance picked up where the 2024 record supply year left off. Municipal issuers raised $37 billion in January, 35% higher than the prior 10-year average January issuance which has historically represented a quieter month of supply (lowest average supply during the prior 10 years). Tax-exempt supply of $35 billion comprised 93% of total issuance and was 15% higher YoY, while taxable supply of $2 billion was double the prior year’s level but still below recent averages as issuers sought better opportunities in tax-exempt markets given the higher rate environment.
Municipal demand rebounded from end-of-year tax selling activity as estimates from ICI and Lipper indicated net inflows of approximately $3 billion in January. Long-term and high-yield fund categories garnered the majority of flows this year at $2.3 billion and $1.7 billion, respectively. January’s inflows extended the rebound of inflows that began in early 2024, bringing in $47 billion for the period between January 1, 2024 to January 31, 2025.
Fundamentals
We estimate that less than 5% of valuations or customers will be impacted by Los Angeles wildfires.
The devastating wildfire damage in Los Angeles will likely represent one of the costliest disasters in the nation’s history with some estimates surpassing $250 billion. Investor attention has understandably turned to the ability of affected municipalities to manage through costs of recovery, revenue disruptions and potential liabilities ahead. While headlines and near-term uncertainty could drive price volatility for impacted issuers, the municipal market has a favorable history of managing through significant natural disasters, and we expect the Los Angeles regional economy and affected issuers to recover and support municipal debt. Considering the size and diversity of the Los Angeles tax base, as well as the economic importance to the region, we expect affected municipal issuers to emerge from the disaster with limited implications to long-term municipal credit. At this juncture, we estimate that less than 5% of affected issuer assessed valuations or customer bases will be impacted. We also expect significant federal and state assistance to support credit conditions through the recovery period. However, we recognize the potential for downgrade risks considering the potential legal liability that can surface around the fire ignition origin or response, which has yet to be officially established.
Valuations
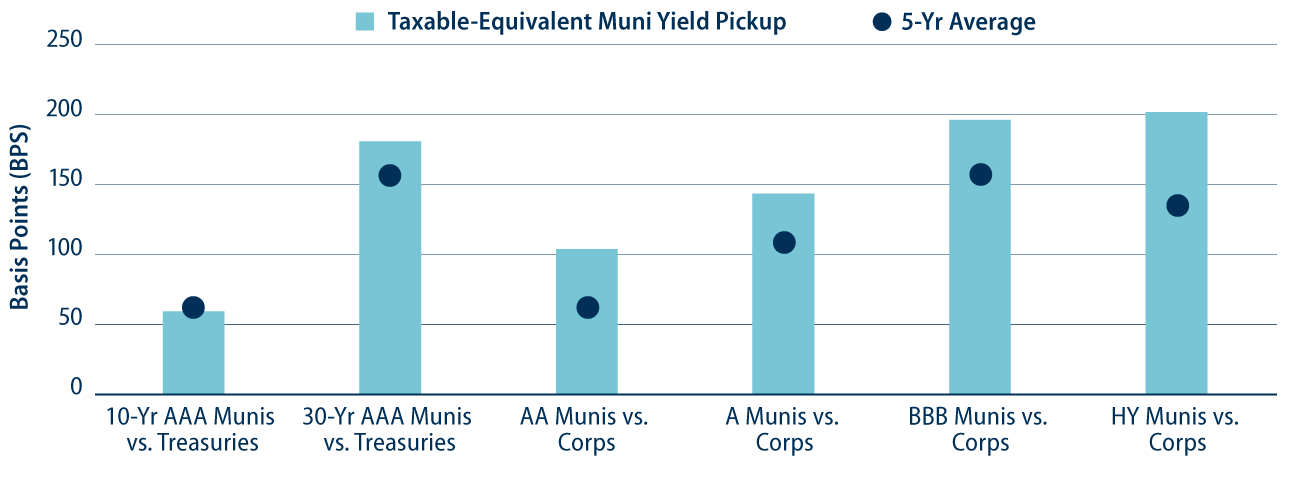
Municipals offer above- average after-tax yield pickup versus taxable counterparts.
Despite muni yields moving lower during the month, more significant spread tightening in other markets has contributed to favorable relative valuations. Longer-duration high-quality and lower-investment-grade municipals offer above-average after-tax yield pickup versus their taxable counterparts when considering five-year averages. As the municipal yield curve has steepened, we expect income-oriented investors to find value in the after-tax relative value proposition offered by the asset class.