

Performance Overview
Munis underperformed taxable fixed-income in August.
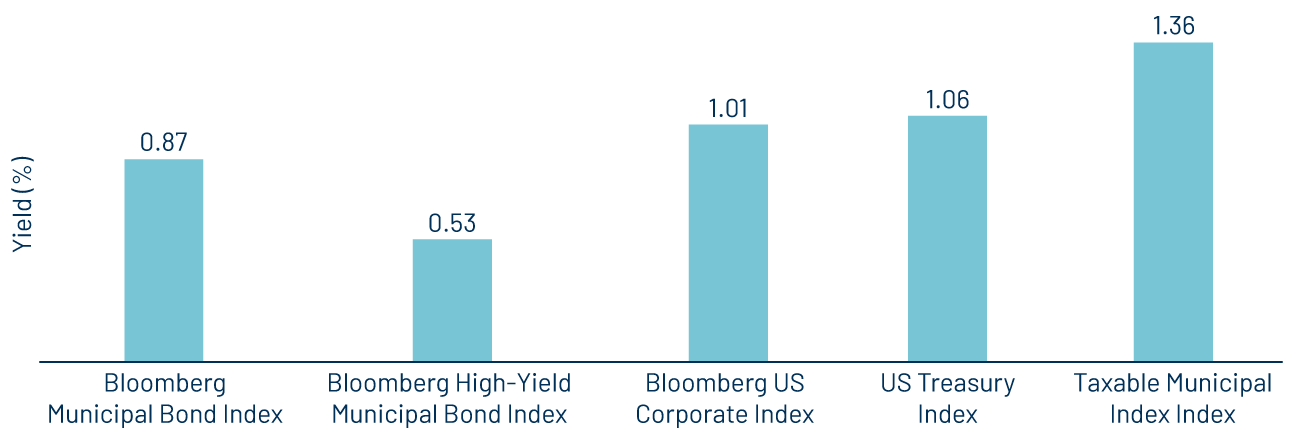
In August, fixed-income yields moved lower and contributed to positive returns across most sectors. Early in the month, the July nonfarm payroll release declined from the prior month and fell below expectations. Inflation remained steady with the Consumer Price Index (CPI) coming in at 2.7% year-over-year (YoY), also below expectations. Expectations for a Federal Reserve rate cut in September reached 90%, with Powell indicating that a “shifting balance of risks may warrant adjusting our policy stance.” Consistent with much of the year, municipals continued to under- perform taxable sectors amid elevated supply conditions, as the Bloomberg Municipal Bond Index return of 0.87% for August lagged the respective US Corporate and Treasury Index returns of 1.01% and 1.06%, respectively.
Supply and Demand Technicals
Muni supply remains at a record pace this year.
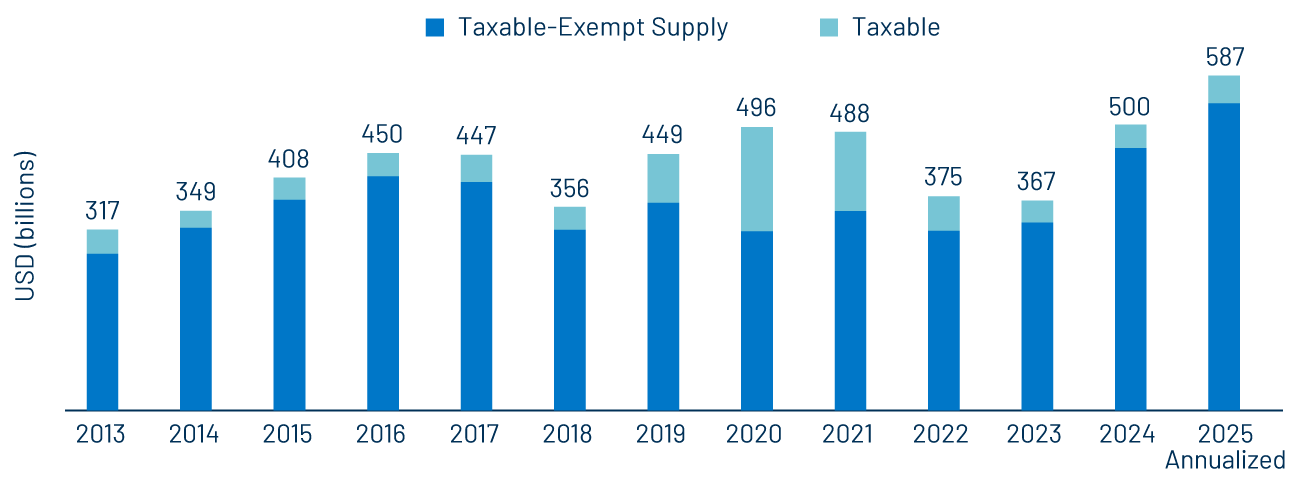
Municipal supply remained elevated at $49 billion in August, down 13% from the prior month but 1% above August 2024 levels. Year-to-date (YTD) municipal issuance totaled $391 billion, 19% higher than the prior year’s record levels. YTD tax-exempt supply is 18% higher at $358 billion YoY and YTD taxable municipal issuance of $32 billion is 20% higher YoY.
Municipal demand remained positive as ICI reported that weekly reporting municipal mutual funds recorded $5 billion of net inflows, leading YTD inflows higher to $30 billion. Long-term and high- yield categories led August inflows.
Valuation Swings Underscore Active Opportunities
Long-end underperformance has created opportunity.
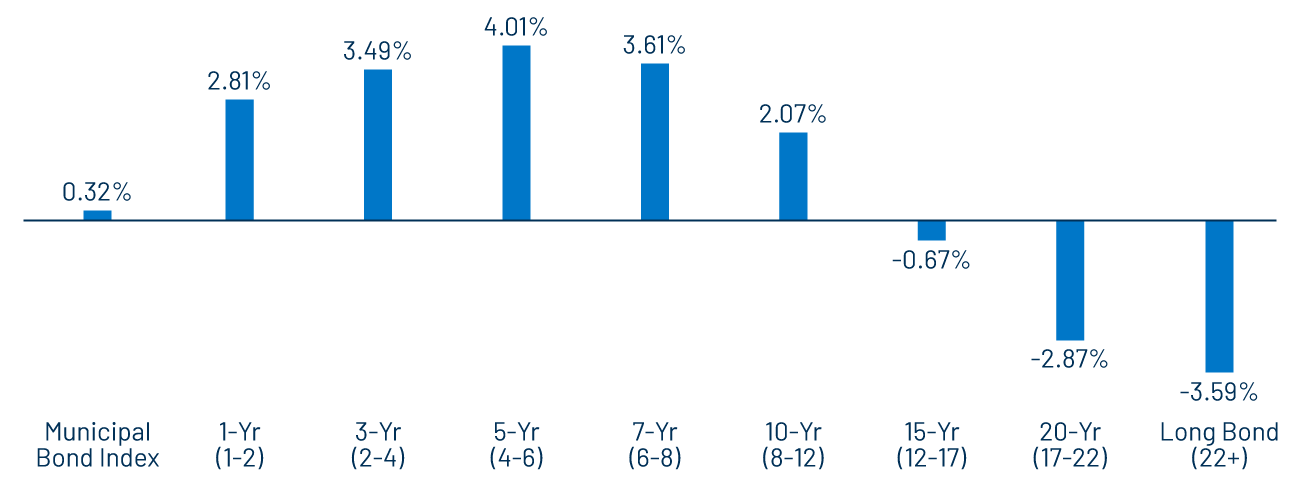
The municipal market’s 0.3% total return YTD appears relatively unremarkable, but unraveling the layers of the fragmented muni market provides a more dynamic performance story that underscores the value of active management this year. The Bloomberg 5-Year Municipal Bond Index (4- to 6-year maturities) led maturity index returns with a 4.0% YTD return through August 31, while the Bloomberg 22+ Year Municipal Bond Index returned -3.6%—a performance gap of nearly 8% driven by yield curve exposure.
The municipal market’s significant performance disparities across the curve also highlight the potential for evolving relative value opportunities ahead. Strong performance at the front end of the yield curve has driven down the 1-year AAA municipal rate by 80 basis points (bps) YTD to 2.19%, equivalent to a taxable-equivalent yield of 3.70% for investors in the top tax bracket, less than the 1-year Treasury yield of 3.96%. Conversely, the 30-year AAA tax-exempt municipal yield has risen 79 bps to 4.66%, equivalent to 7.87% on a taxable basis, exceeding the 30-year Treasury yield of 4.98% by 289 bps. Western Asset believes that fixed income solutions that can take advantage of market dislocations within the municipal market, as well as tax-aware solutions that have the flexibility to better access these higher after-tax income opportunities can provide for more favorable after- tax outcomes.