Municipals Posted Positive Returns as Yields Moved Lower During the Week
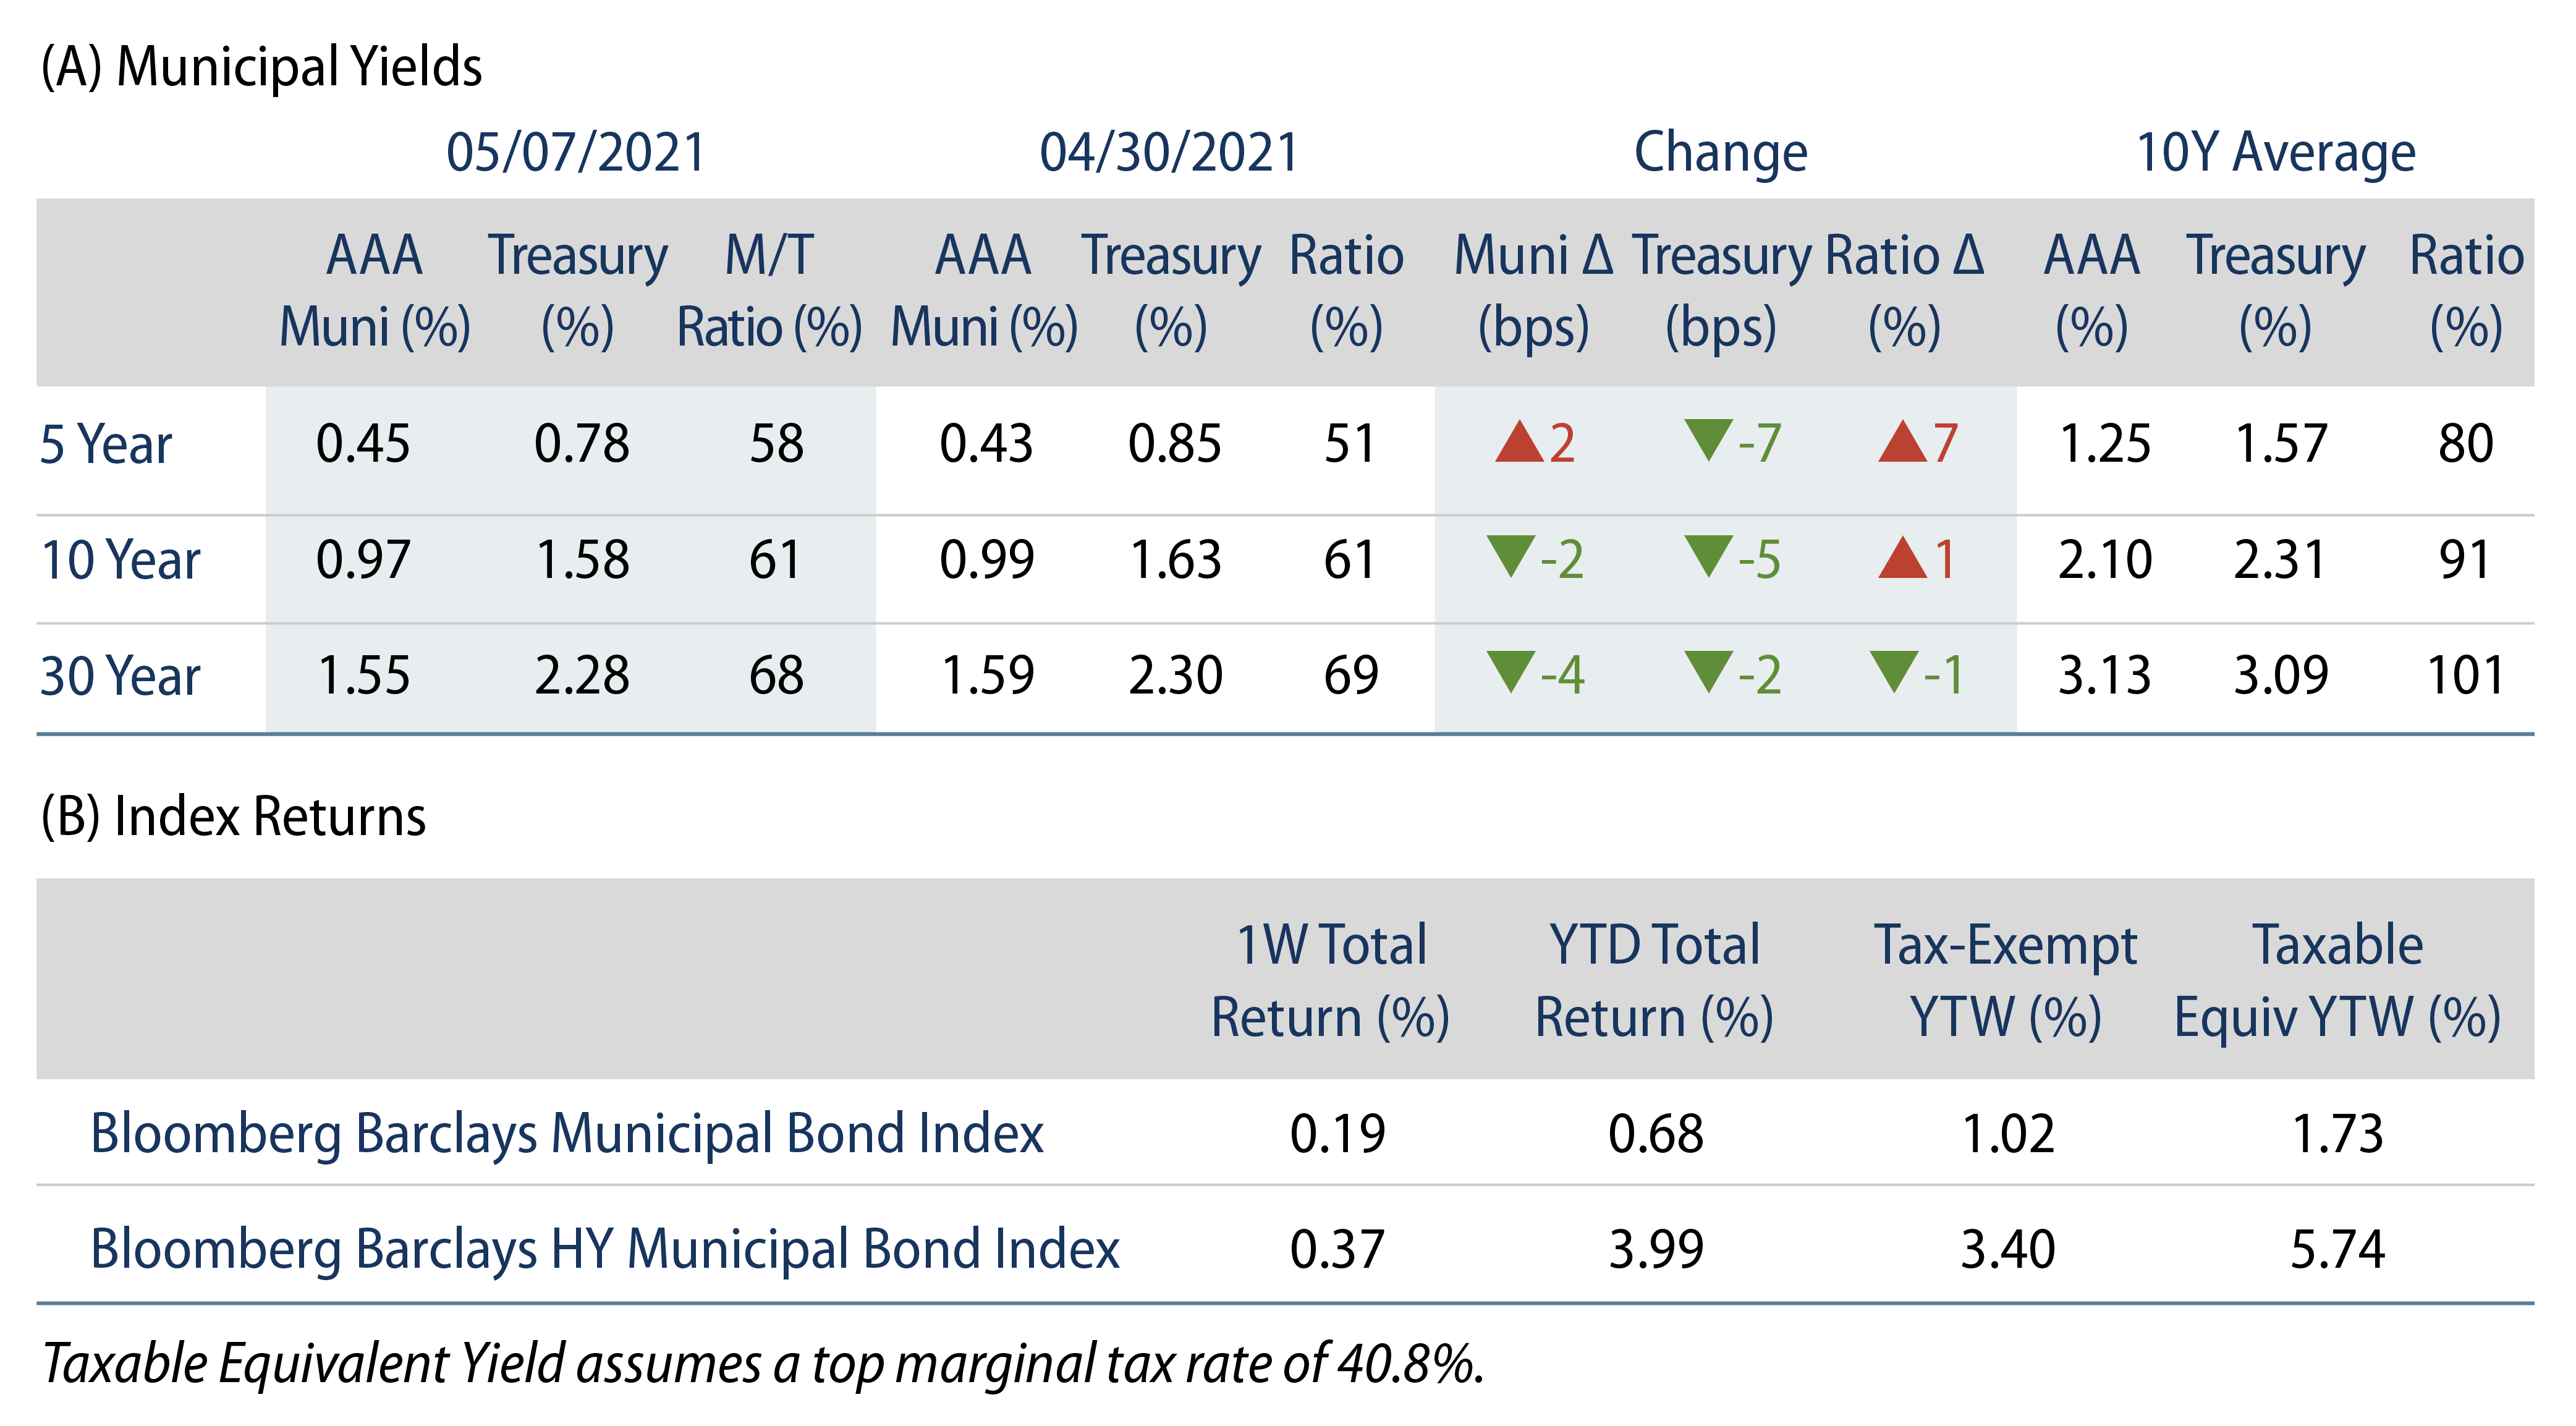
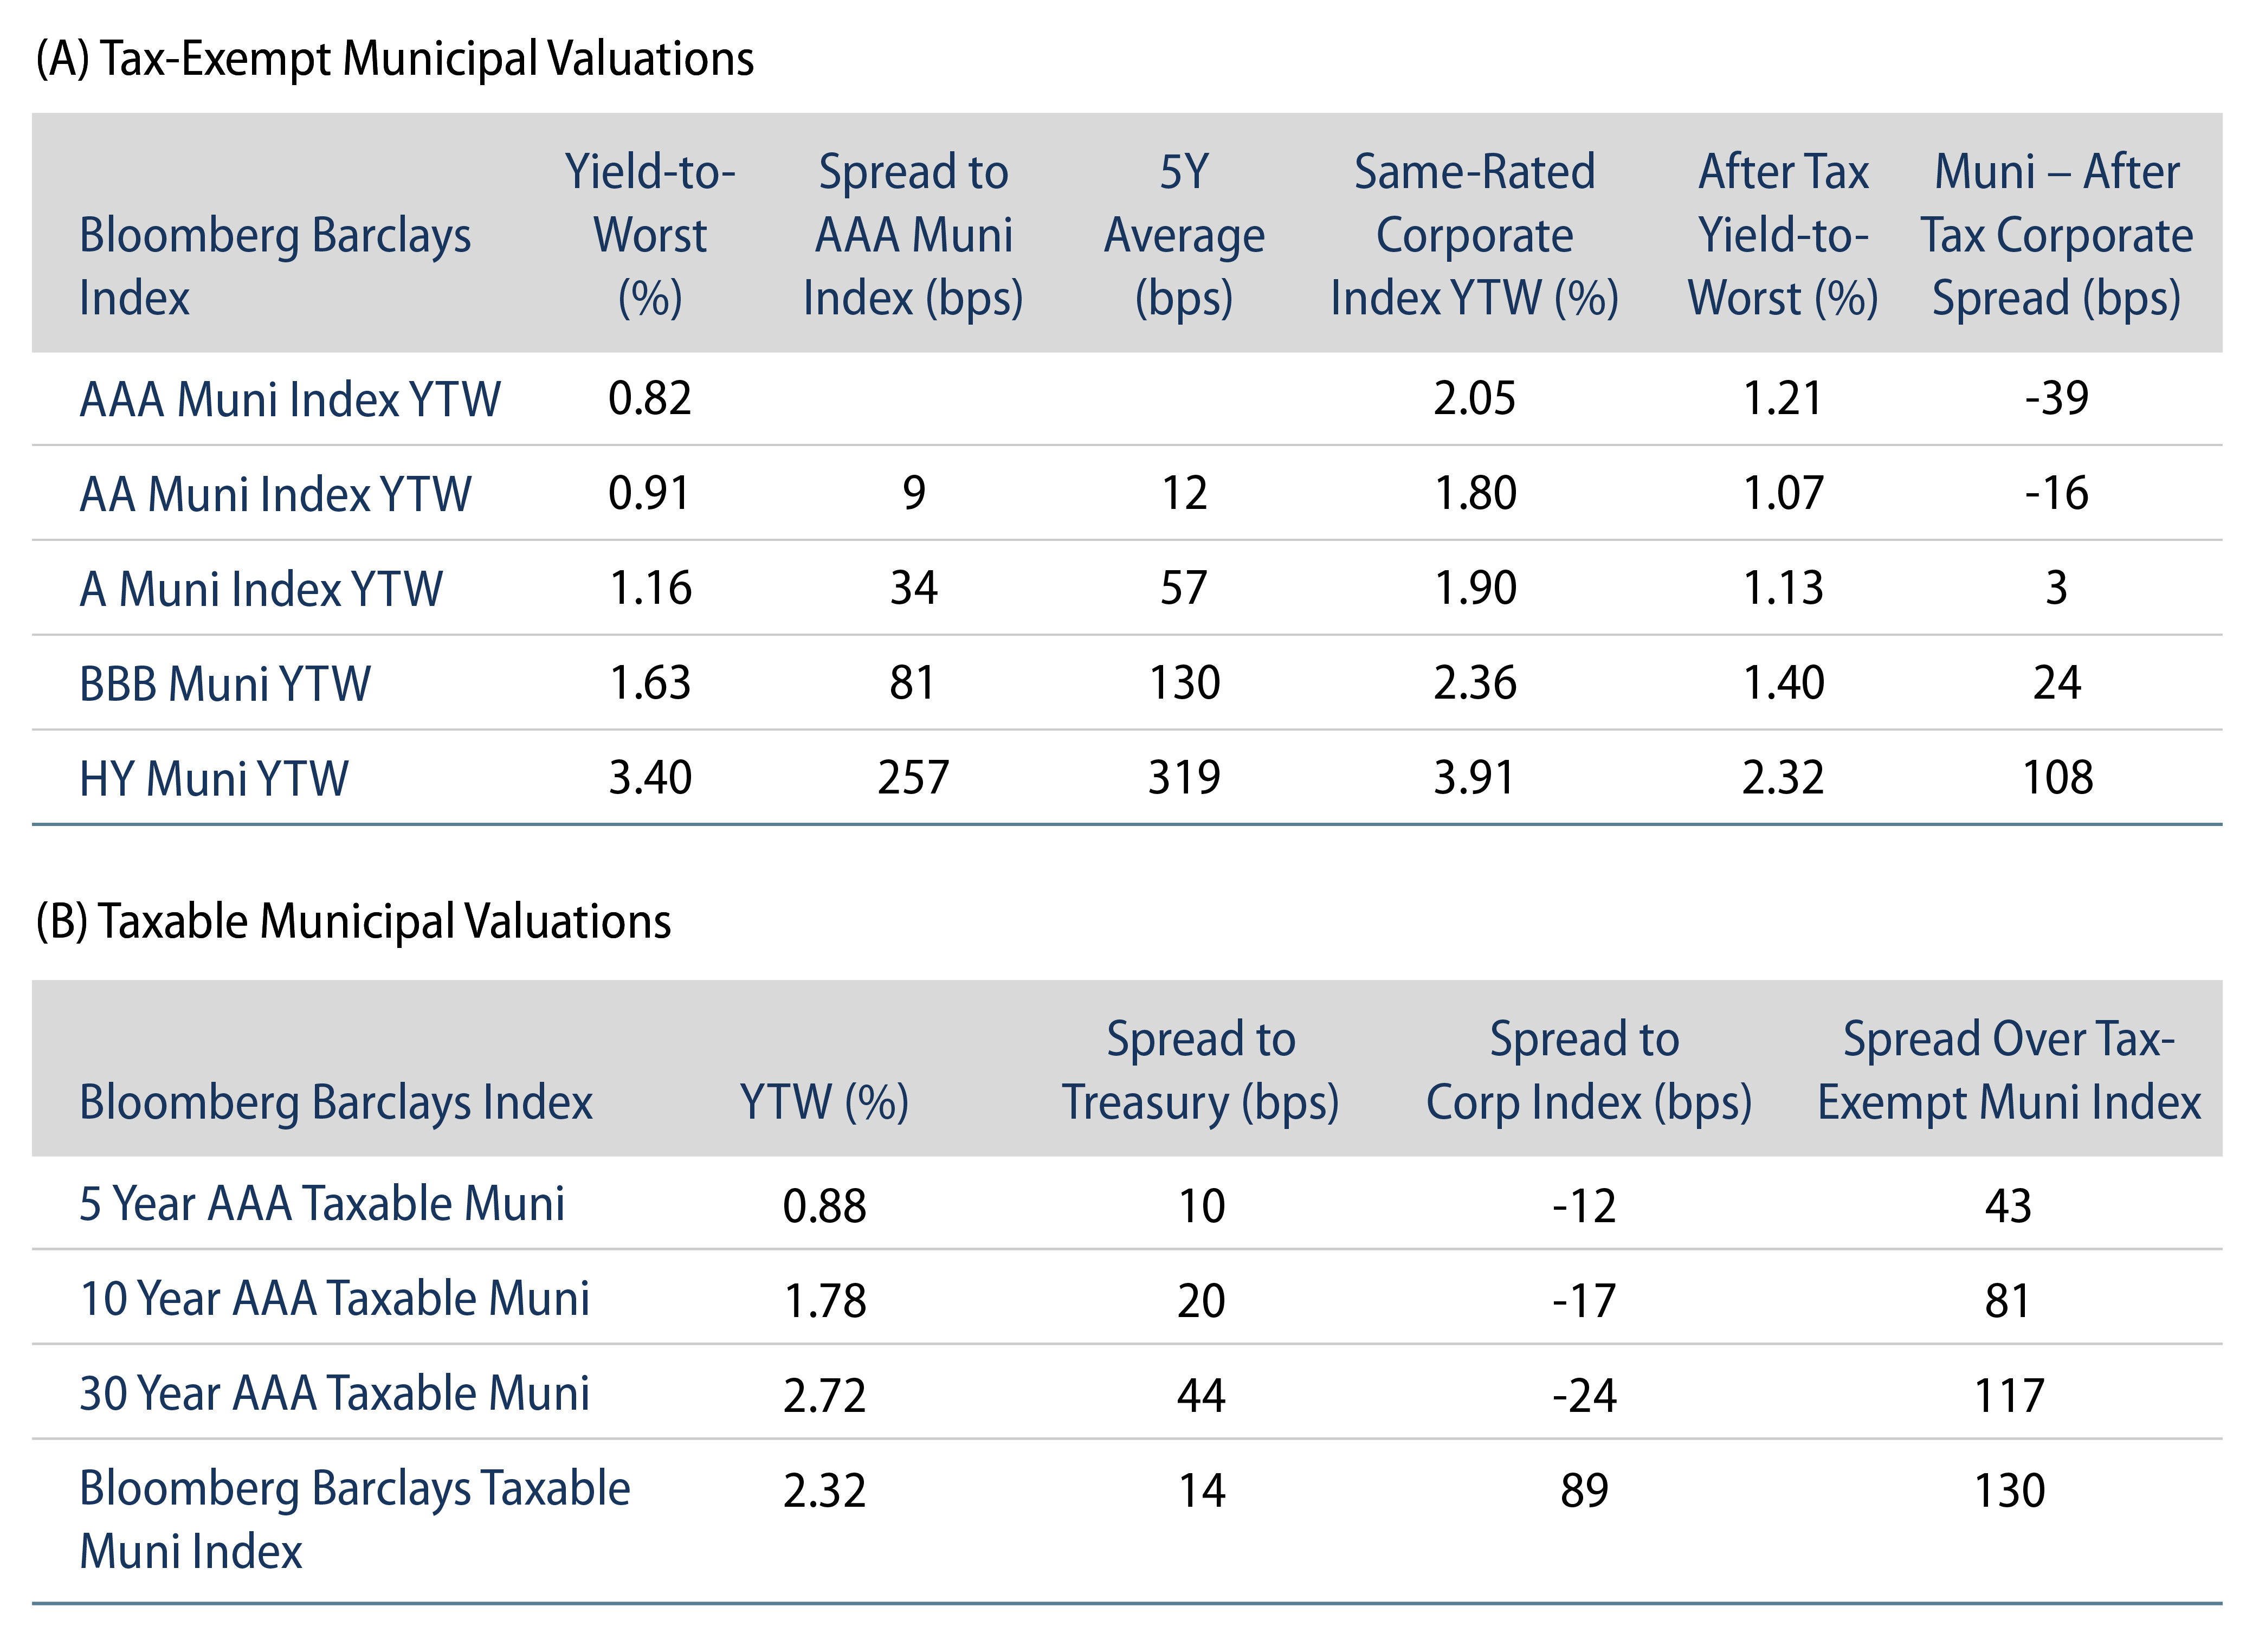
US municipal yields moved lower during the week in sympathy with the drop in Treasury yields. AAA municipal yields also generally moved lower over the week. Muni/Treasury ratios moved higher as munis underperformed. Fund flows continued to support favorable technicals. The Bloomberg Barclays Municipal Index returned 0.19% while the HY Muni Index returned 0.37%. This week we evaluate the recently released 2020 US Census data.
Fund Flows Continue to Be a Strong Technical Tailwind
Fund Flows: During the week ending May 5, municipal mutual funds recorded $2.0 billion of net inflows, according to Lipper. Long-term funds recorded $1.7 billion of inflows, high-yield funds recorded $458 million of inflows and intermediate funds recorded $137 million of outflows. Net inflows year-to-date (YTD) reached $43.5 billion and munis have now recorded net inflows in 50 of the past 51 weeks.
Supply: The muni market recorded $10 billion of new-issue volume during the week, up from $6 billion the prior week. Total issuance YTD of $150 billion is up 24% from last year’s levels and this coming week’s new-issue calendar is expected to slow to approximately $7 billion.
This Week in Munis: Assessing Census Apportionment Data
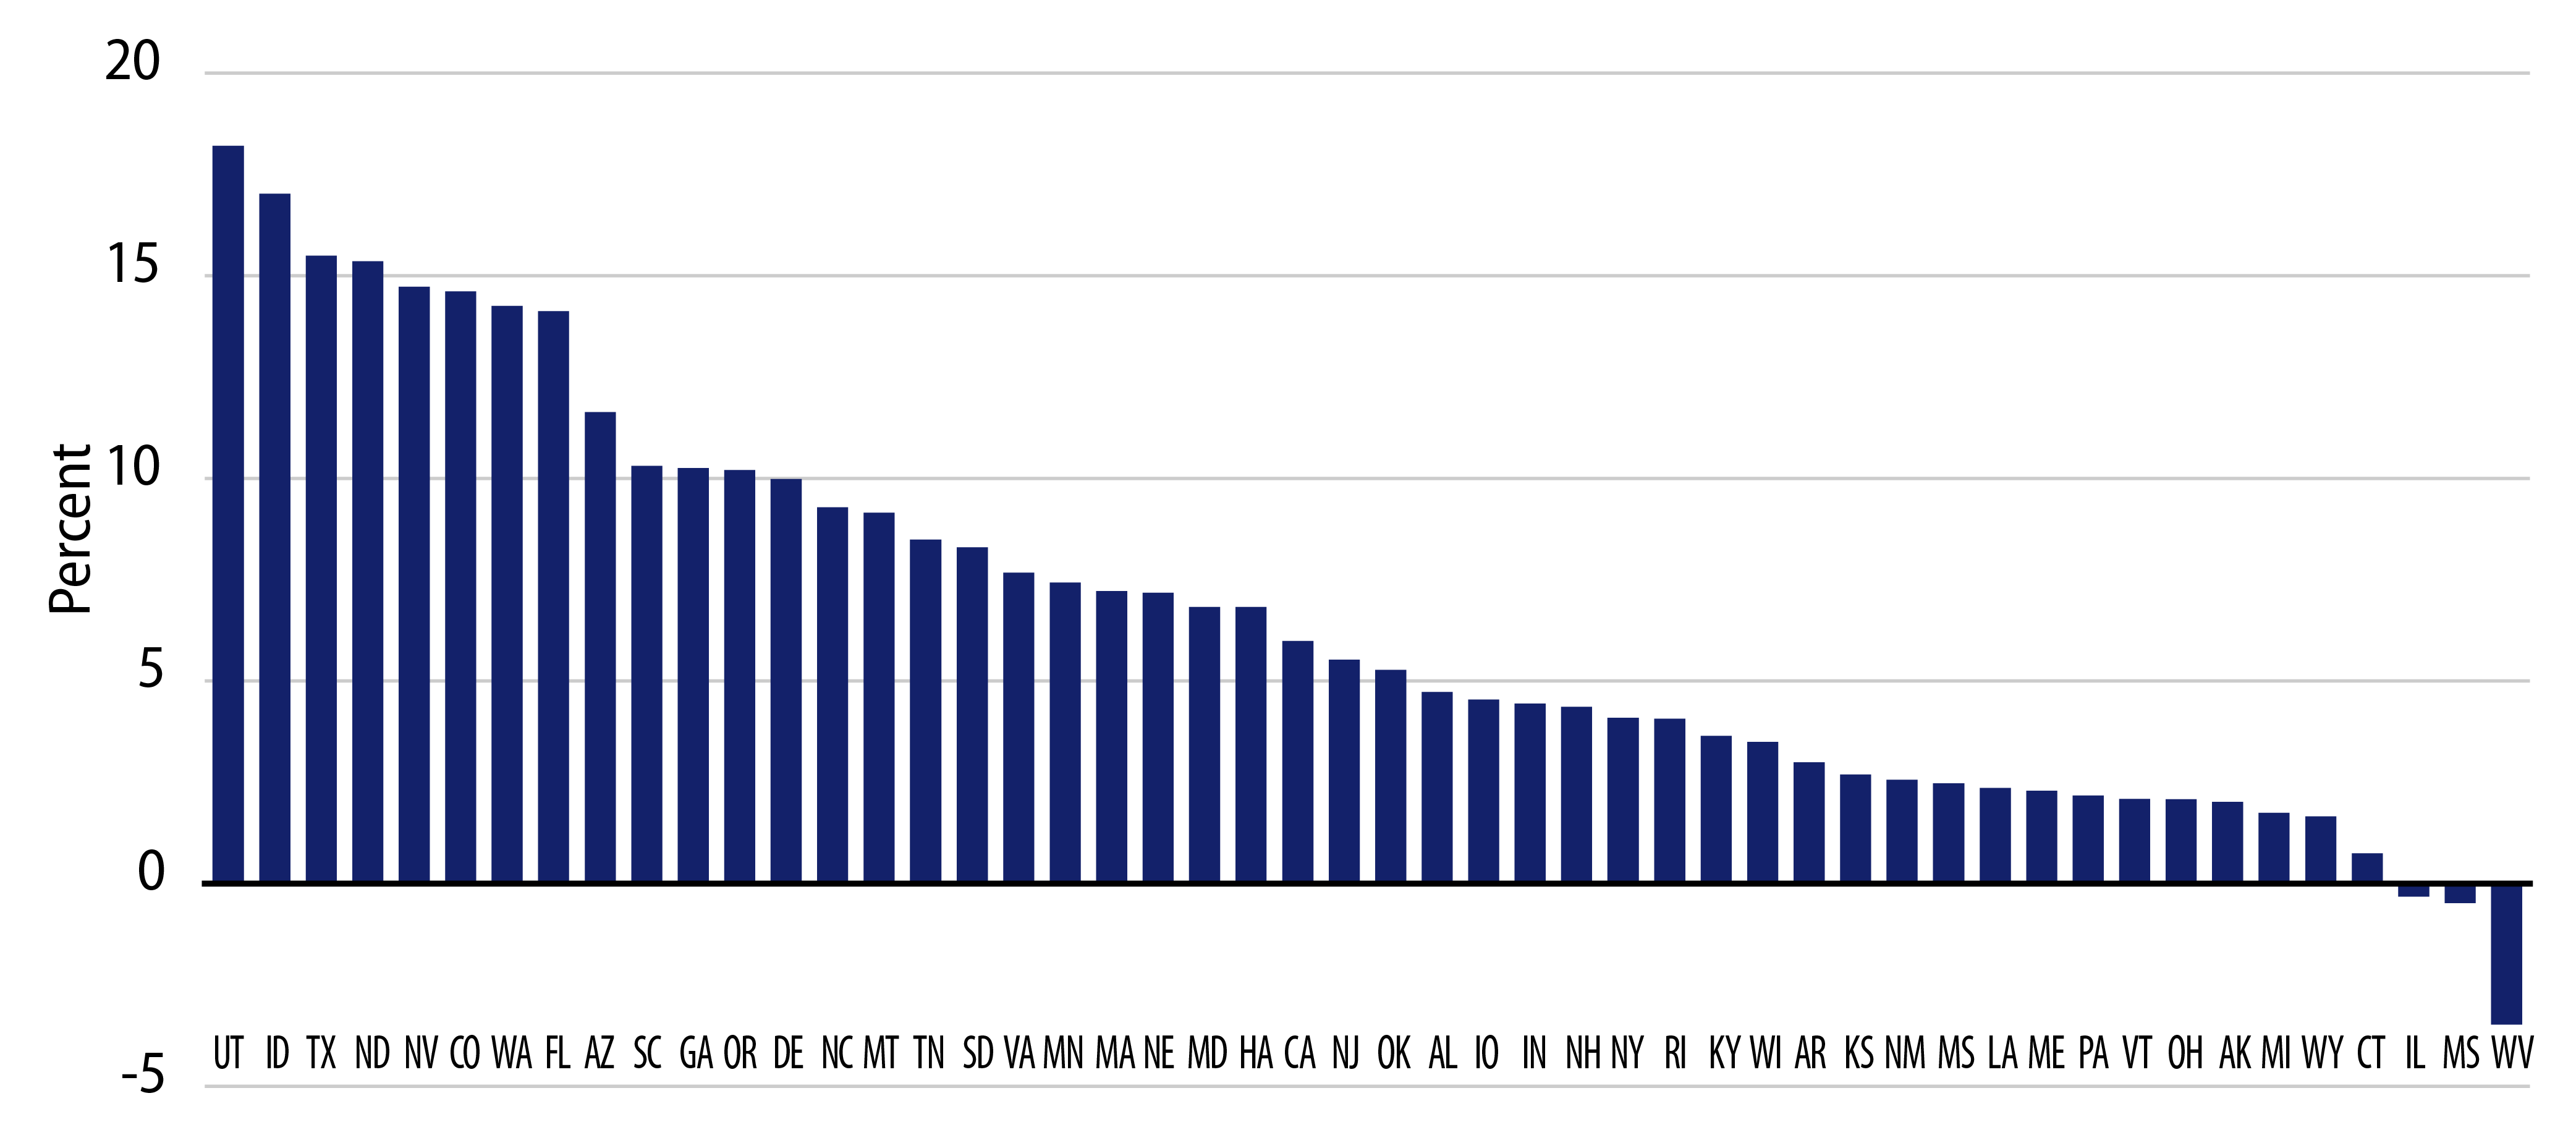
The US Census reapportionment of the House of Representatives has shone a spotlight on the differences in 10-year population growth and implied migration trends among states. Over the 10 years from 2010 to 2020, Utah, Idaho and Texas observed the largest population growth of 18%, 17% and 15%, respectively, versus 7.4% for the US as a whole. Florida, often in the headlines due to the attraction of having no state income tax, experienced a growth rate of 14% over the 10-year period. The high income-tax state of California’s population grew by more than two million, but considering its larger base and recent domestic outmigration estimates, its growth rate (6.1%) was less than the US average.


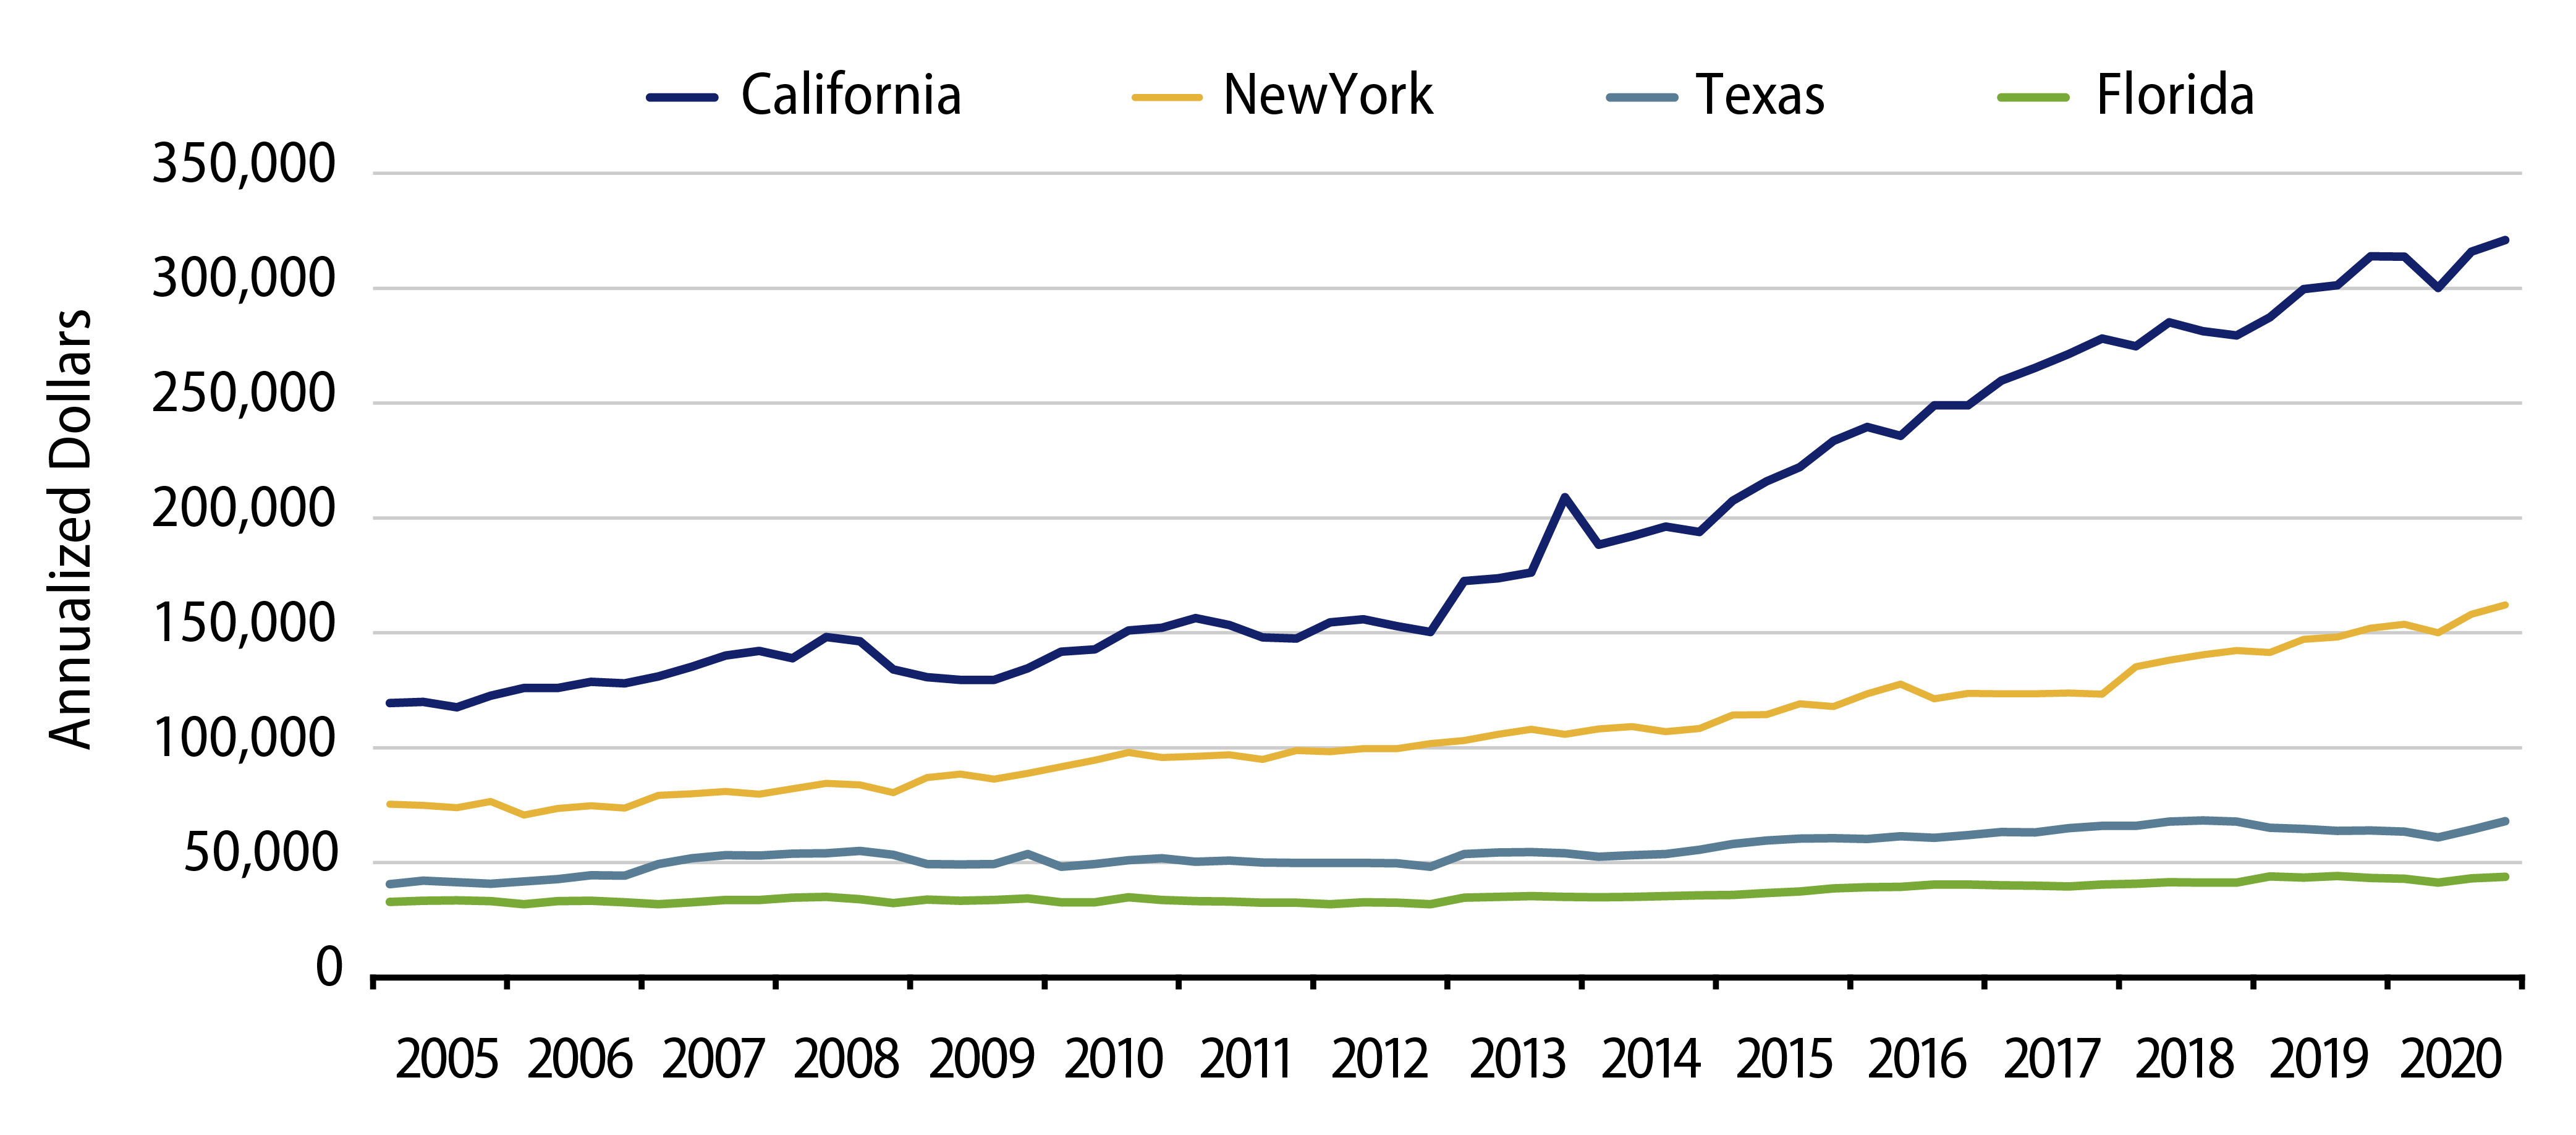
While relative population growth trends tend to reach the headlines, they do not tell the whole story of economic growth prospects—particularly, when one looks at specific economic sectors that inform wealth levels and the tax base of municipal entities. While California’s population growth rate has lagged that of Texas and Florida, California’s growth in the relatively high-paying information sector continues to far outstrip these states. Similarly, New York also demonstrates below-average population growth, but has held a commanding share of this higher income sector, while also leading in sectors such as finance and real estate.
As municipalities continue to grapple with higher costs of the Covid pandemic, coupled with increasing pension and health care costs, we anticipate higher tax rates will continue to drive headlines around migration concerns. While long-term migration trends remain an important secular credit consideration, the prevalence of industries with favorable future prospects and wealth generation will be a primary driver in assessing where the income generators will ultimately reside and produce long-term benefits for the associated municipal entity.


