skip navigation
Blog

Stay up to date on timely topics and market events. Subscribe to our Blog now.

MARKETS
March 04, 2020

How Extreme Was the Jan-Feb 2020 Market Move?

By Porntawee Nantamanasikarn, PhD

Stay up to date on timely topics and market events. Subscribe to our Blog now.

The first two months of 2020 saw outsized moves in both US Treasury (UST) yields and US credit spreads, driven by the coronavirus/COVID-19 outbreak and its significant impact on the global economic growth outlook. By the end of February, the 10-year UST yield rallied 77 bps to 1.15% whereas the US IG corporate spread widened 29 bps to 122 bps. How extreme was this market move in a historical context?

At the beginning of 2020, our proprietary risk system, WISER, estimated volatility on the 10-year UST yield at 70 bps (annualized) and IG corporate spread at 28 bps (annualized). The magnitude of the Jan-Feb move was equivalent to a 2.6-2.7 sigma (standard deviation) event. Under normal distribution assumptions, the chance of market moves larger than this in magnitude is roughly only 0.5% or less (1 in 200), so it was a really big market move — a tail event, from a risk model perspective.

However, it can be argued that using normal distribution assumptions is likely to underestimate the probability of tail events. We know that tail events in financial markets tend to occur more often than implied by normal distribution (fatter tails). Thus it may be helpful to examine the magnitudes in an empirical manner. Exhibit 1 shows frequency distribution of both series using the past 30 years of bi-monthly data (1990-2019; a total of 180 data points). The bin that the Jan-Feb 2020 move falls into is highlighted in red.
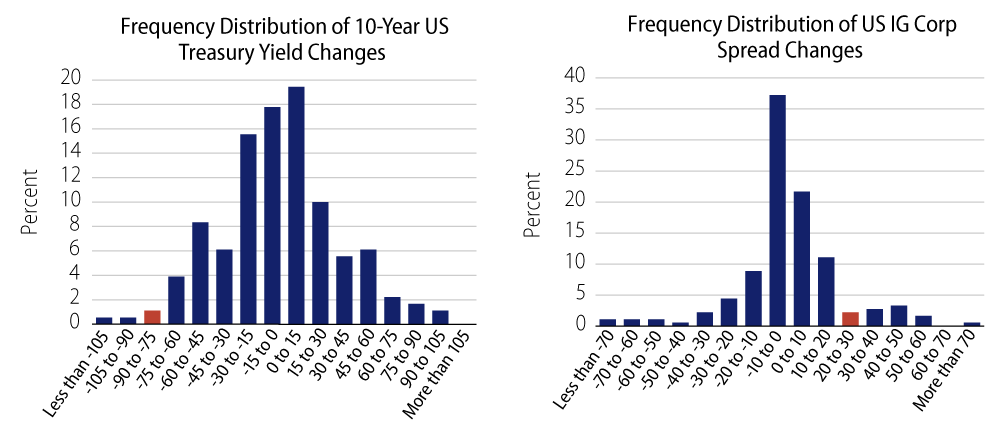
Exhibit 1: Frequency Distribution of Financial Market Shocks
Explore Frequency Distribution of Financial Market Shocks
Source: Bloomberg (USGG10 Index and LUACOAS Index) January 1990- December 2019, as of 31 Dec 2019. Select the image to expand the view.

In the past 30 years, there were five instances when the 10-year UST yield rallied by more than 70 bps in two months — a historical frequency of about 2.8% (1 in 36). This is almost six times more likely to happen than implied by normal assumptions but still quite an extreme tail event. It happened two times in the 1990s when yields were much higher, in the 6%-8% range. More recently, we saw a 174 bps rally in Nov-Dec 2008 at the height of the financial crisis, and two more instances in May-Jun 2010 (-72 bps) and Jul-Aug 2011 (-94 bps) in the days of quantitative easing (QE1 and QE2).

The move in IG corporate spread was relatively less extreme than it was for the 10-year UST yield. In the past 30 years there were 15 instances, or 8.3% (1 in 12) in historical frequency, when the IG spread widened by more than 29 bps in two months. This is about 16 times more likely to happen than implied by normal assumption. It happened five times before 2007 with an average widening of 41 bps, five times during the 2007-2008 financial crisis, including the 271 bps blowout in Sep-Oct 2008, and five more times after the crisis with an average widening of 41 bps. The most recent occurrence was a 32 bps widening in Jan-Feb 2016, driven by the concerns of a China-led global growth slowdown.

What does this mean for market volatility going forward? The market is likely to remain volatile in the short term, given significant uncertainty about the spread of COVID-19 and its economic impact. Indeed, the 10-year UST yield dipped further below 1.0% on March 3 after the Fed’s 50 bps emergency rate cut. Over the longer term, it depends on whether the COVID-19 impacts will be deeper or more prolonged than currently anticipated, or if the impacts will turn out to be more moderate, leading to a quick recovery to investor confidence and global growth.

The next relevant question is how long this short-term rate volatility is likely to last, assuming that Jan-Feb 2020 was already a peak in volatility this time. To answer that, we look at historical data again. Exhibit 2 shows the historical path of absolute changes (another simple measure of volatility) for each of the last five extreme moves in the 10-year UST yield. By definition, volatility will only go down from the peak. From historical experience, it usually takes two to four months for volatility to return to its long-term average (38 bps bi-monthly volatility in the case of the 10-year UST yield).

While examining past market behavior won’t necessarily help us foresee the future, it can be very valuable to frame current events into a historical context from which we can more confidently face the current shock and address its impact.
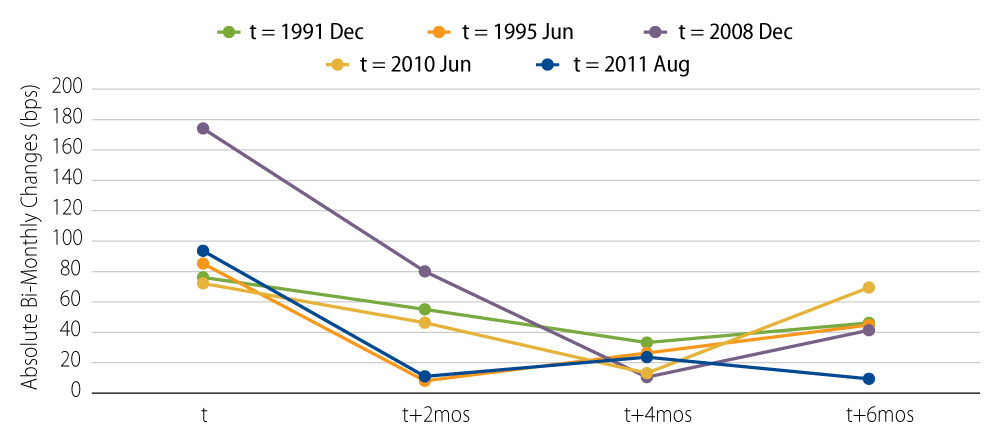
Exhibit 2: Absolute 10-Year UST Yield Changes After Big Shocks
Explore Absolute 10-Year UST Yield Changes After Big Shocks
Source: Bloomberg (USGG10 Index), January 1990- December 2019. Select the image to expand the view.
© Western Asset Management Company, LLC 2024. The information contained in these materials ("the materials") is intended for the exclusive use of the designated recipient ("the recipient"). This information is proprietary and confidential and may contain commercially sensitive information, and may not be copied, reproduced or republished, in whole or in part, without the prior written consent of Western Asset Management Company ("Western Asset").
Past performance does not predict future returns. These materials should not be deemed to be a prediction or projection of future performance. These materials are intended for investment professionals including professional clients, eligible counterparties, and qualified investors only.
These materials have been produced for illustrative and informational purposes only. These materials contain Western Asset's opinions and beliefs as of the date designated on the materials; these views are subject to change and may not reflect real-time market developments and investment views.
Third party data may be used throughout the materials, and this data is believed to be accurate to the best of Western Asset's knowledge at the time of publication, but cannot be guaranteed. These materials may also contain strategy or product awards or rankings from independent third parties or industry publications which are based on unbiased quantitative and/or qualitative information determined independently by each third party or publication. In some cases, Western Asset may subscribe to these third party's standard industry services or publications. These standard subscriptions and services are available to all asset managers and do not influence rankings or awards in any way.
Investment strategies or products discussed herein may involve a high degree of risk, including the loss of some or all capital. Investments in any products or strategies described in these materials may be volatile, and investors should have the financial ability and willingness to accept such risks.
Unless otherwise noted, investment performance contained in these materials is reflective of a strategy composite. All other strategy data and information included in these materials reflects a representative portfolio which is an account in the composite that Western Asset believes most closely reflects the current portfolio management style of the strategy. Performance is not a consideration in the selection of the representative portfolio. The characteristics of the representative portfolio shown may differ from other accounts in the composite. Information regarding the representative portfolio and the other accounts in the composite are available upon request. Statements in these materials should not be considered investment advice. References, either general or specific, to securities and/or issuers in the materials are for illustrative purposes only and are not intended to be, and should not be interpreted as, recommendation to purchase or sell such securities. Employees and/or clients of Western Asset may have a position in the securities or issuers mentioned.
These materials are not intended to provide, and should not be relied on for, accounting, legal, tax, investment or other advice. The recipient should consult its own counsel, accountant, investment, tax, and any other advisers for this advice, including economic risks and merits, related to making an investment with Western Asset. The recipient is responsible for observing the applicable laws and regulations of their country of residence.
Founded in 1971, Western Asset Management Company is a global fixed-income investment manager with offices in Pasadena, New York, London, Singapore, Tokyo, Melbourne, São Paulo, Hong Kong, and Zürich. Western Asset is a wholly owned subsidiary of Franklin Resources, Inc. but operates autonomously. Western Asset is comprised of six legal entities across the globe, each with distinct regional registrations: Western Asset Management Company, LLC, a registered Investment Adviser with the Securities and Exchange Commission; Western Asset Management Company Distribuidora de Títulos e Valores Mobiliários Limitada is authorized and regulated by Comissão de Valores Mobiliários and Brazilian Central Bank; Western Asset Management Company Pty Ltd ABN 41 117 767 923 is the holder of the Australian Financial Services License 303160; Western Asset Management Company Pte. Ltd. Co. Reg. No. 200007692R is a holder of a Capital Markets Services License for fund management and regulated by the Monetary Authority of Singapore; Western Asset Management Company Ltd, a registered Financial Instruments Business Operator and regulated by the Financial Services Agency of Japan; and Western Asset Management Company Limited is authorised and regulated by the Financial Conduct Authority ("FCA") (FRN 145930). This communication is intended for distribution to Professional Clients only if deemed to be a financial promotion in the UK as defined by the FCA. This communication may also be intended for certain EEA countries where Western Asset has been granted permission to do so. For the current list of the approved EEA countries please contact Western Asset at +44 (0)20 7422 3000.