

Introduction
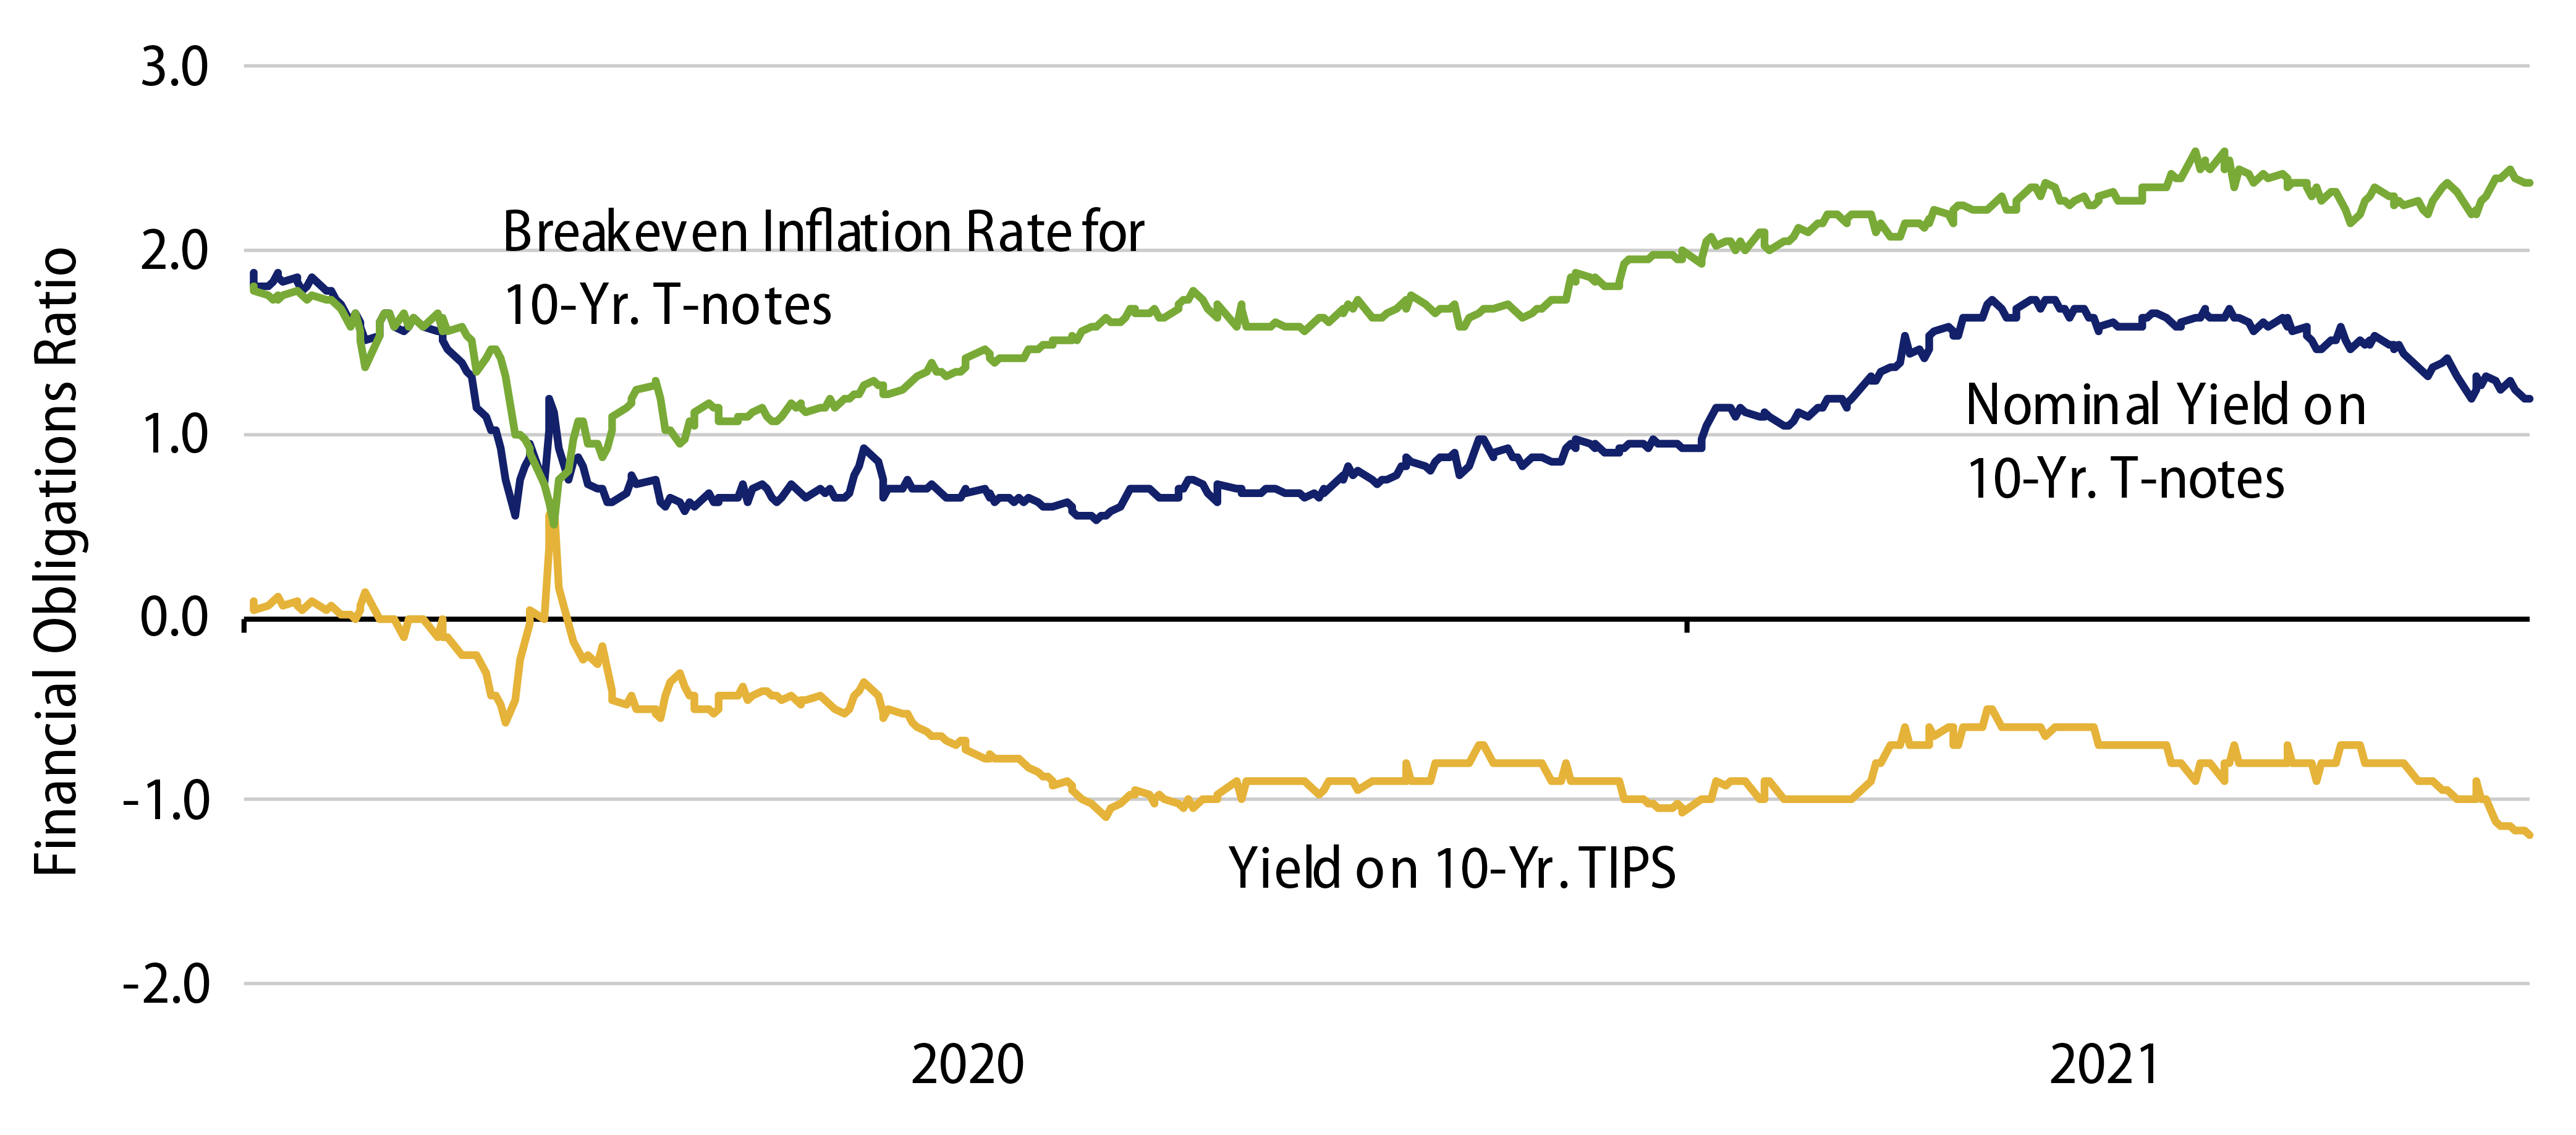
The inflation fears that were so prevalent just a few months ago seem to have subsided recently, if only within the confines of the financial markets. Certainly bond yields that had risen so sharply from August 2020 through March 2021 have pulled back substantially in the months since. The 10-year T-note yield hit a peak closing level of 1.74% on March 31. It dropped to as low as 1.16% in trading on August 3.
Granted, breakeven inflation rates for 10-year T-notes have declined only grudgingly since March. However, they have held at levels way below the scary inflation prints various wags have suggested are in place. Also, it is hard to believe that nominal and real yields could drop as sharply as they have since March were financial markets’ inflation fears as entrenched and increasing as was the case earlier this year.
In a paper earlier this year, we argued that 2021 inflation fears were likely to prove to be unfounded. While we didn’t flatly dismiss the chances of sustained higher inflation, we did assert that such an unfortunate outcome was unlikely. Here we discuss what we believe has transpired in recent months to serve to assuage market inflation fears.
It has not been the actual price data, which some analysts purport has shown as much as 5% to 6% inflation rates. However, we are inclined to agree with the Federal Reserve’s claim that recent elevated inflation rates are temporary. We would go so far as to say that there has not yet even been any true increase in inflation. Rather, the scary price prints we have seen reflect merely a rebound in some prices from the declines they experienced during the Covid shutdown and a surge in car prices resulting from supply-chain disruptions.
Meanwhile, as argued in the March 2021 piece, the actions of the Federal Reserve, while reckless in some commentators’ eyes, display little of the earmarks of inflationary policy that have characterized Fed misadventures in the past. Bank lending continues to be inert, so that liquidity injected into the financial system by the Fed lies dormant in bank vaults rather than circulating through the economy. Essentially all of the stimulus money doled out to individuals by the federal government has been saved, so that it has provided zero actual stimulus to spending or to prices. And while growth in the money stock continues at a rapid pace, this growth would appear to reflect saving activity by consumers rather than the expansionary efforts of the Fed or intended spending activity by depositors.
Financial System Still Stagnant
The March piece discussed in detail our contention that the Fed’s policy actions were not generating inflationary spending in the economy, so we won’t rehash those arguments here, but rather cite recent developments. Nominal GDP growth has averaged all of 3.1% annually since 4Q19, compared to 4%-5% growth trends prior to the shutdown. So, spending has not even yet fully retraced its shutdown-induced declines, let alone surged above previous trends in reflection of Fed policy.
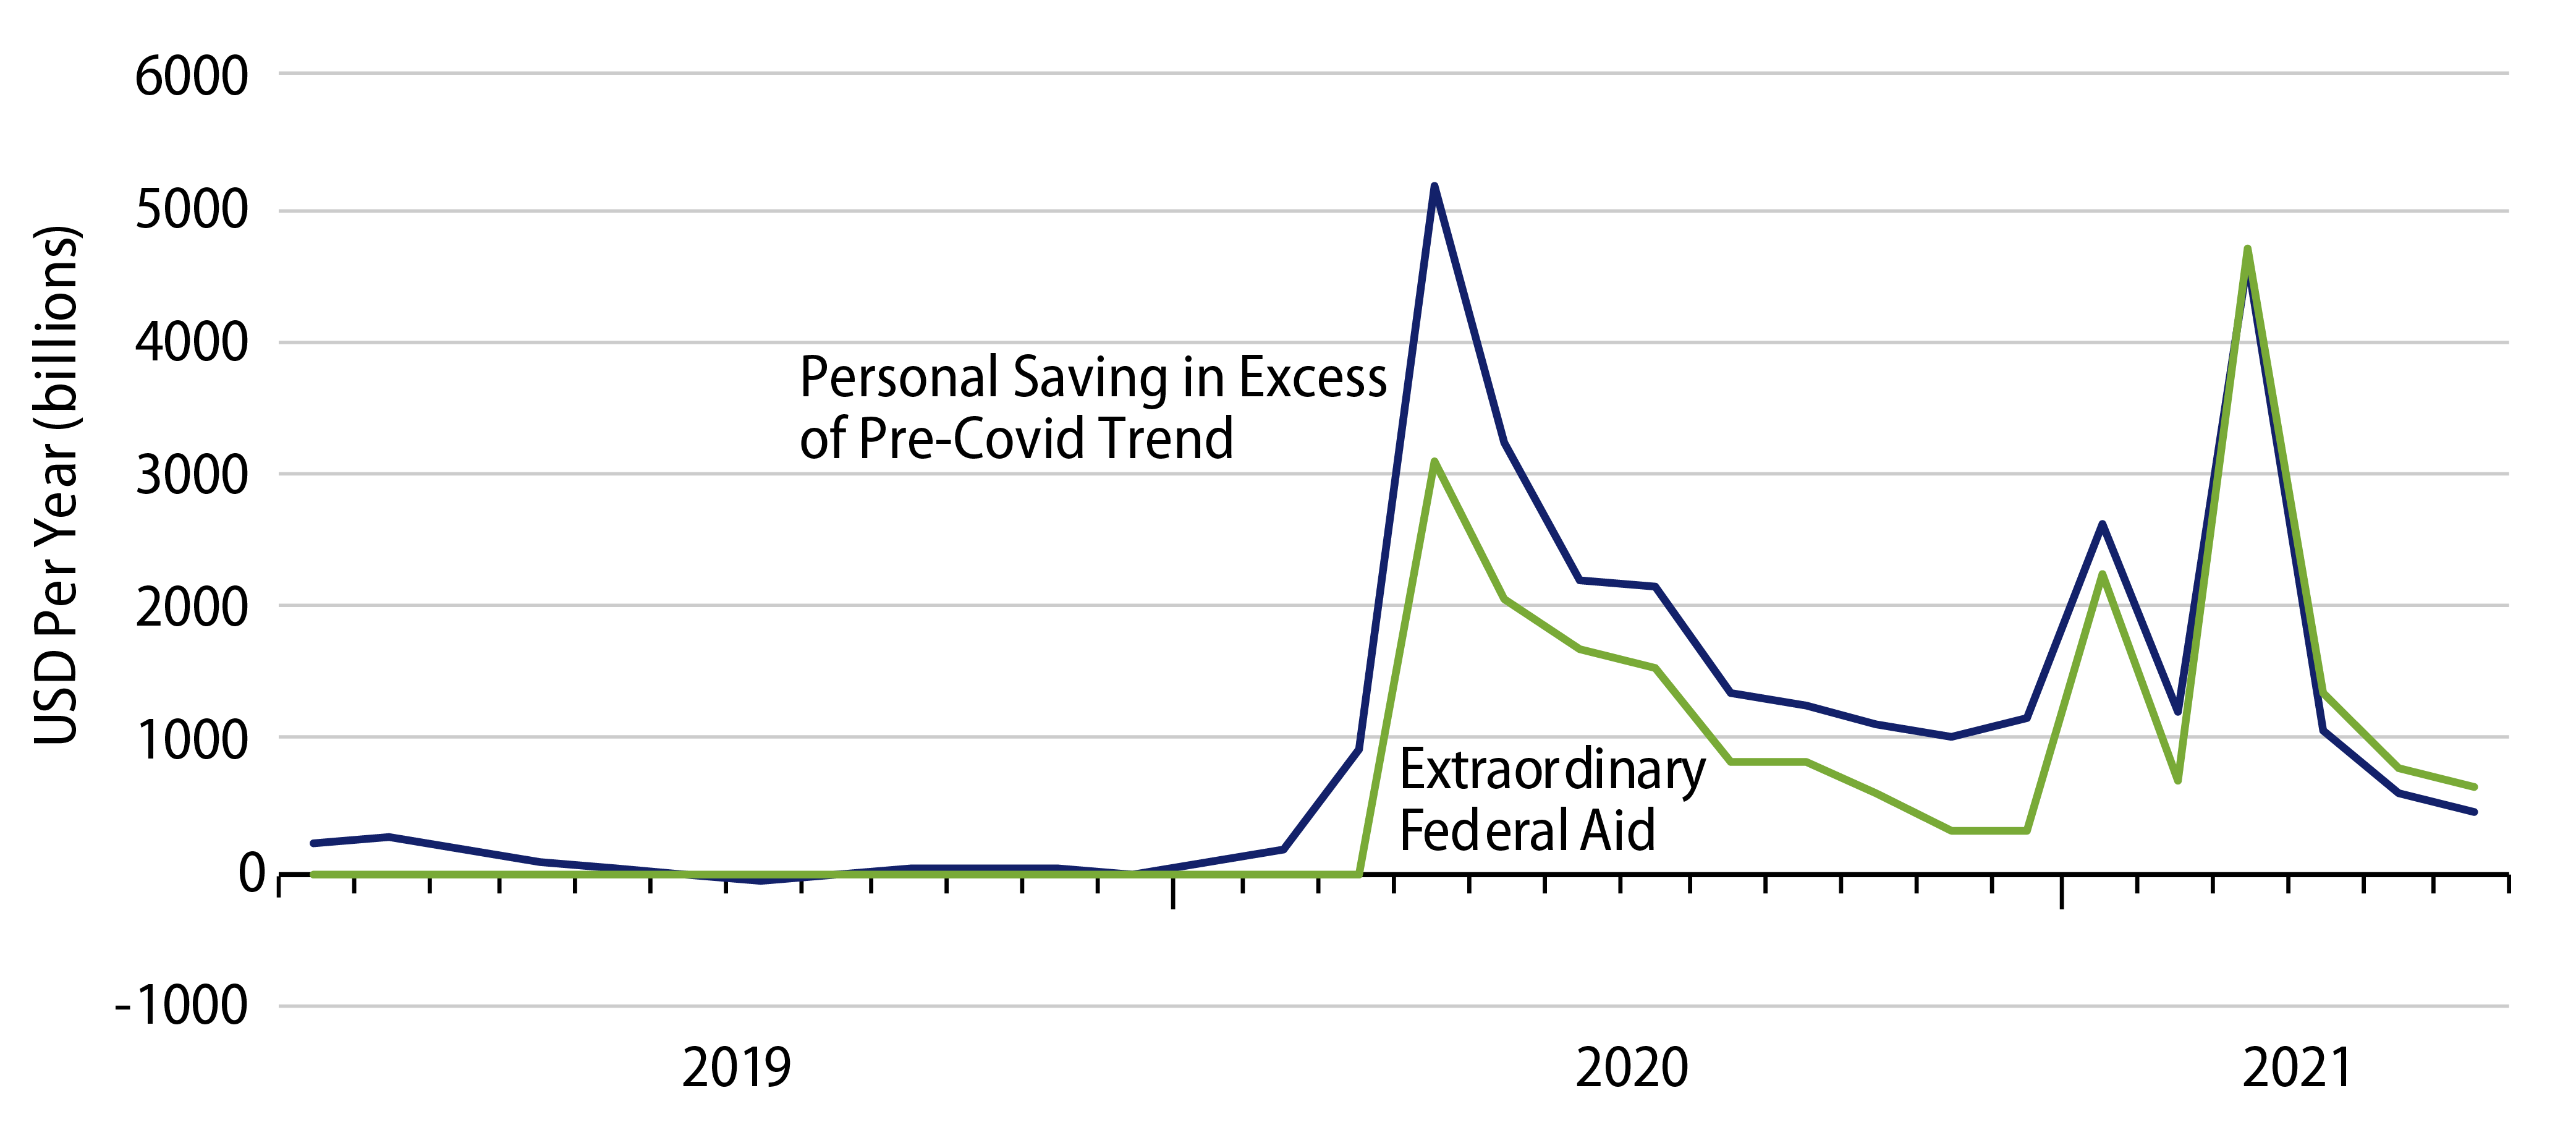
With respect to government stimulus efforts, in every month from the onset of the pandemic through April 2021, personal saving rose above pre-shutdown levels by more than the amount of extraordinary assistance provided to individuals by various aid initiatives. While it is surely the case that some stimulus checks somewhere have been spent, the evidence is clear that the vast bulk of various stimulus payments has been saved. Consumer spending has fallen below pre-Covid trends by amounts larger than any losses of earned income below pre-Covid trends. Meanwhile, earned income has recently re-attained pre-Covid growth trends while consumer spending remains below pre-Covid trends.
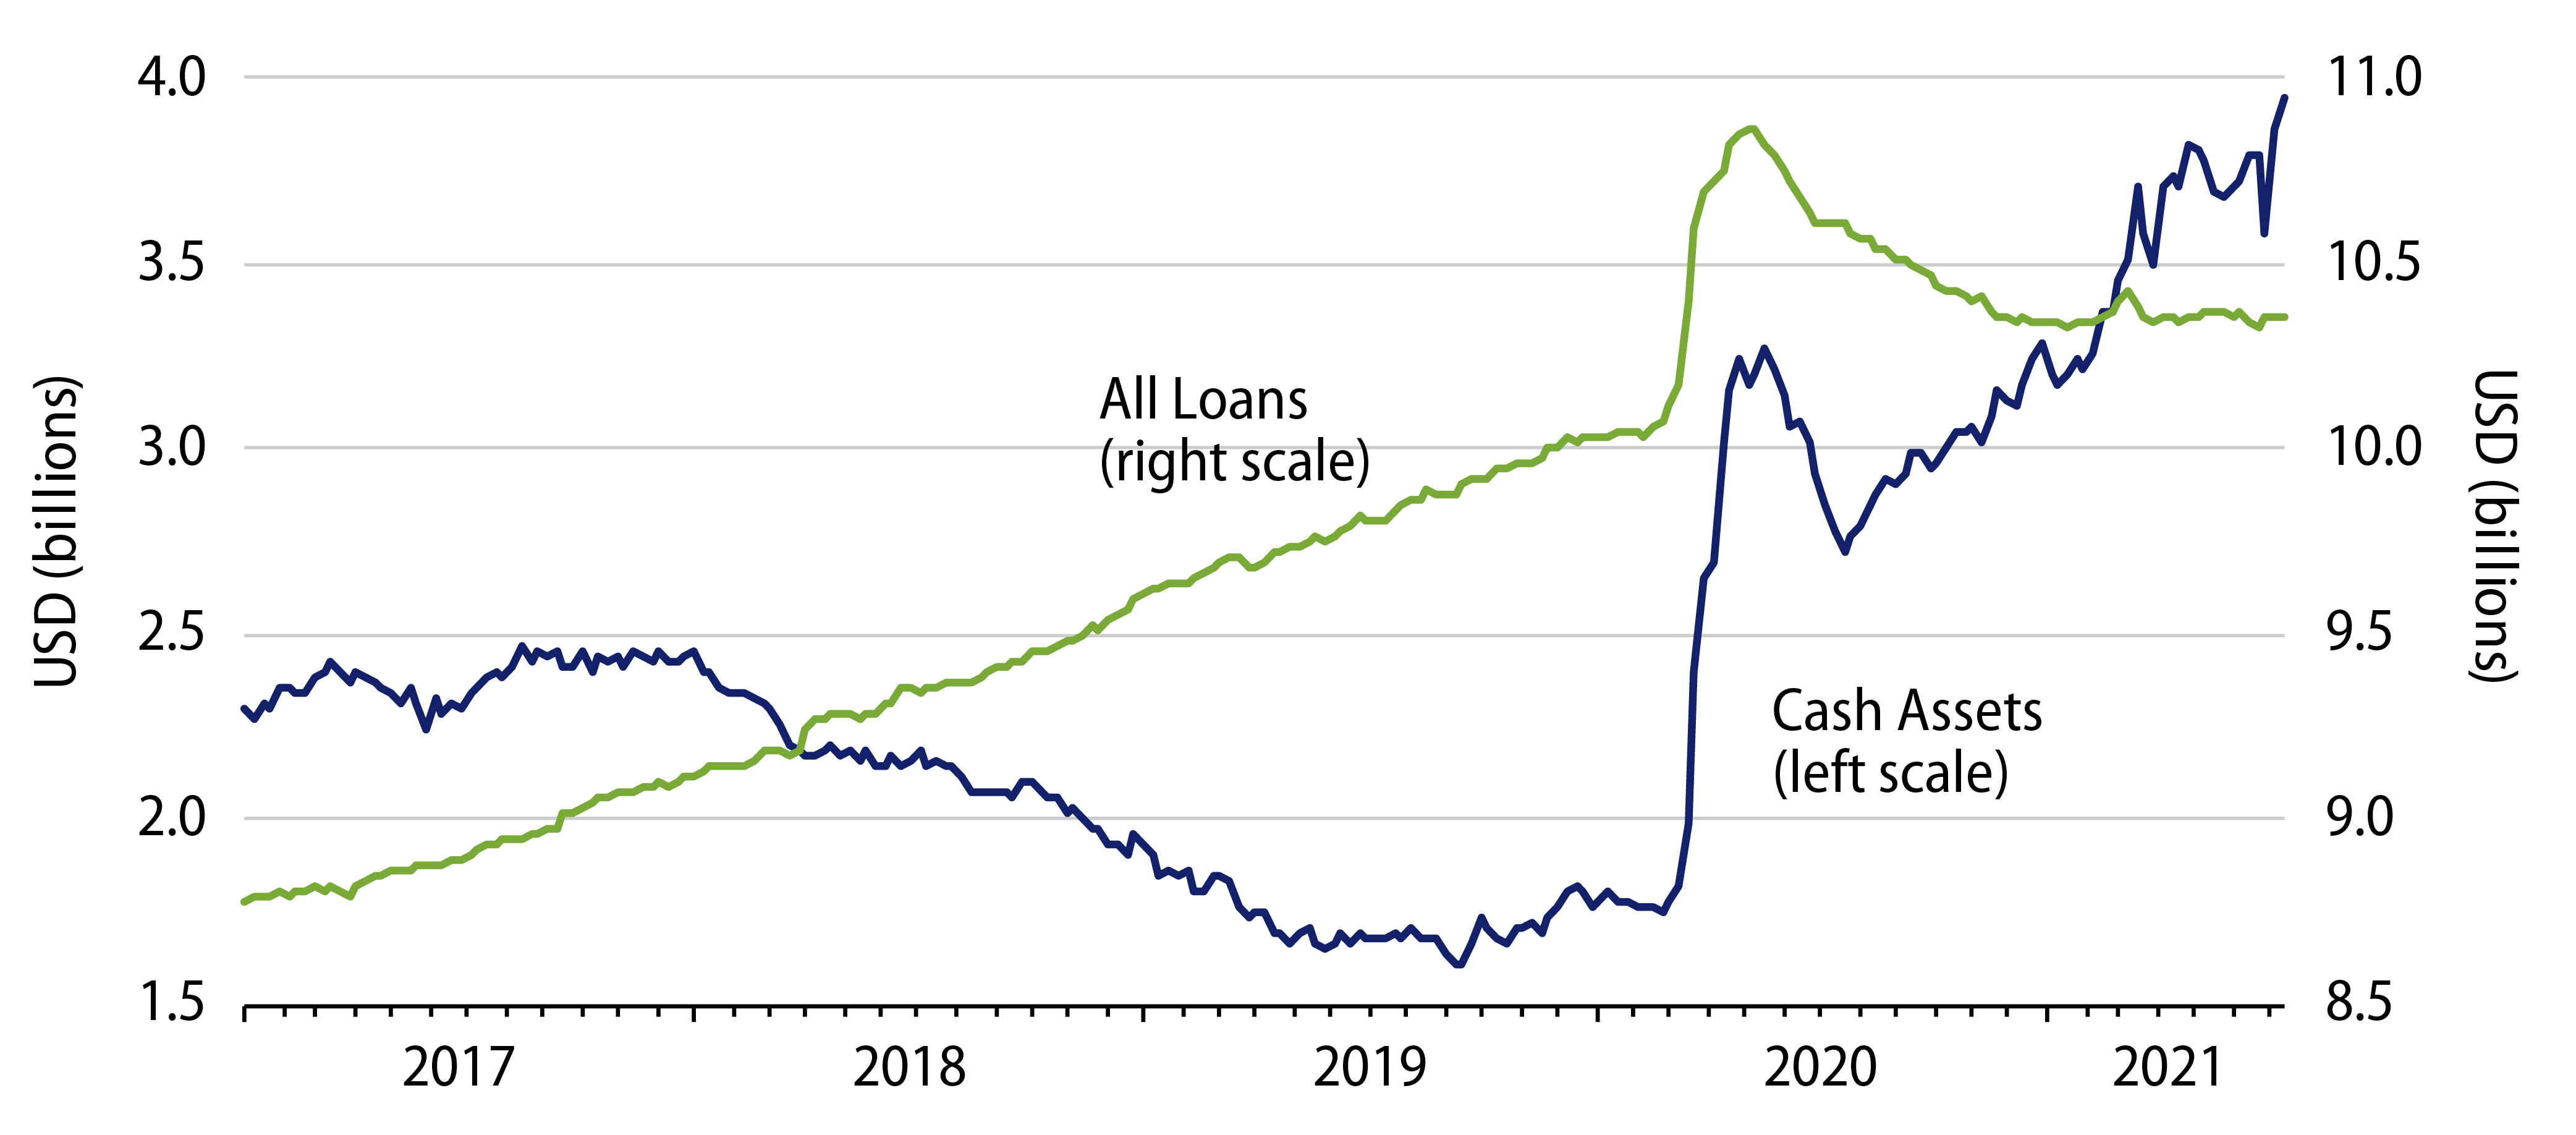
Wherever the money has gone that has been provided by the Fed and the feds, it has not generated any discernible increase in total spending. One reason would seem to be that banks continue to sit on proffered funds, just as they did with liquidity injected into the system by the Fed in the wake of the global financial crisis 13 years ago. As can be seen in Exhibit 3, banks’ cash assets have risen by $2.3 trillion since the onset of the pandemic in late-February 2020. Bank holdings of securities have risen by $1.4 trillion in that time. Bank loans have increased all of $0.35 trillion since then, with most of that remaining a net increase representing emergency borrowings by corporations early in the pandemic that have not yet been paid down.
Supposed Inflation Is Mostly Just Prices Rebounding From Shutdown-Driven Declines
The Covid recession was largely a government-mandated decline driven by forcible shuttering of economic facilities. It disrupted the flow of the economy unlike anything we have seen before. Ridiculously large rates of decline in real GDP and other indicators were succeeded by ridiculously rapid rates of increase once the shutdown ceased (at least partially).
Just as the pace of economic activity plunged during the shutdown, so too various prices plunged as buyers and sellers reacted to the new environment. It seems only logical that prices depressed during the shutdown would rebound upon the economy’s reopening. Listing the facts in this way, no reasonable person would regard such rebounds in price as evidence of serious inflation, any more than the 33% print for real GDP in 3Q20 could have been regarded as a measure of the economy’s potential growth. Yet, many analysts have made this exact same representation by looking at inflation rates measured from the price trough months of the Covid shutdown.
Exhibit 4 shows levels of the Consumer Price Index (CPI), before any possible distortion from looking at 3-month average rates or 12-month average rates. You can see the declines over March-May 2020 in all the CPI aggregates shown there. Yes, comparing May 2021 to May 2020 or even June 2021 to June 2020 results in inflation prints near or above 5%. However, such comparisons look at prices relative to shutdown-depressed levels.
Obviously, some (much?) of the increase since then reflects a natural (and desired) rebound from shutdown-depressed levels. To get an idea of how much of this supposed inflation is merely a rebound from Covid depression, we can look at 16-month inflation rates, that is, the average inflation rate from just before the shutdown to the present. Again, this nets shutdown-induced declines with post-shutdown rebounds.
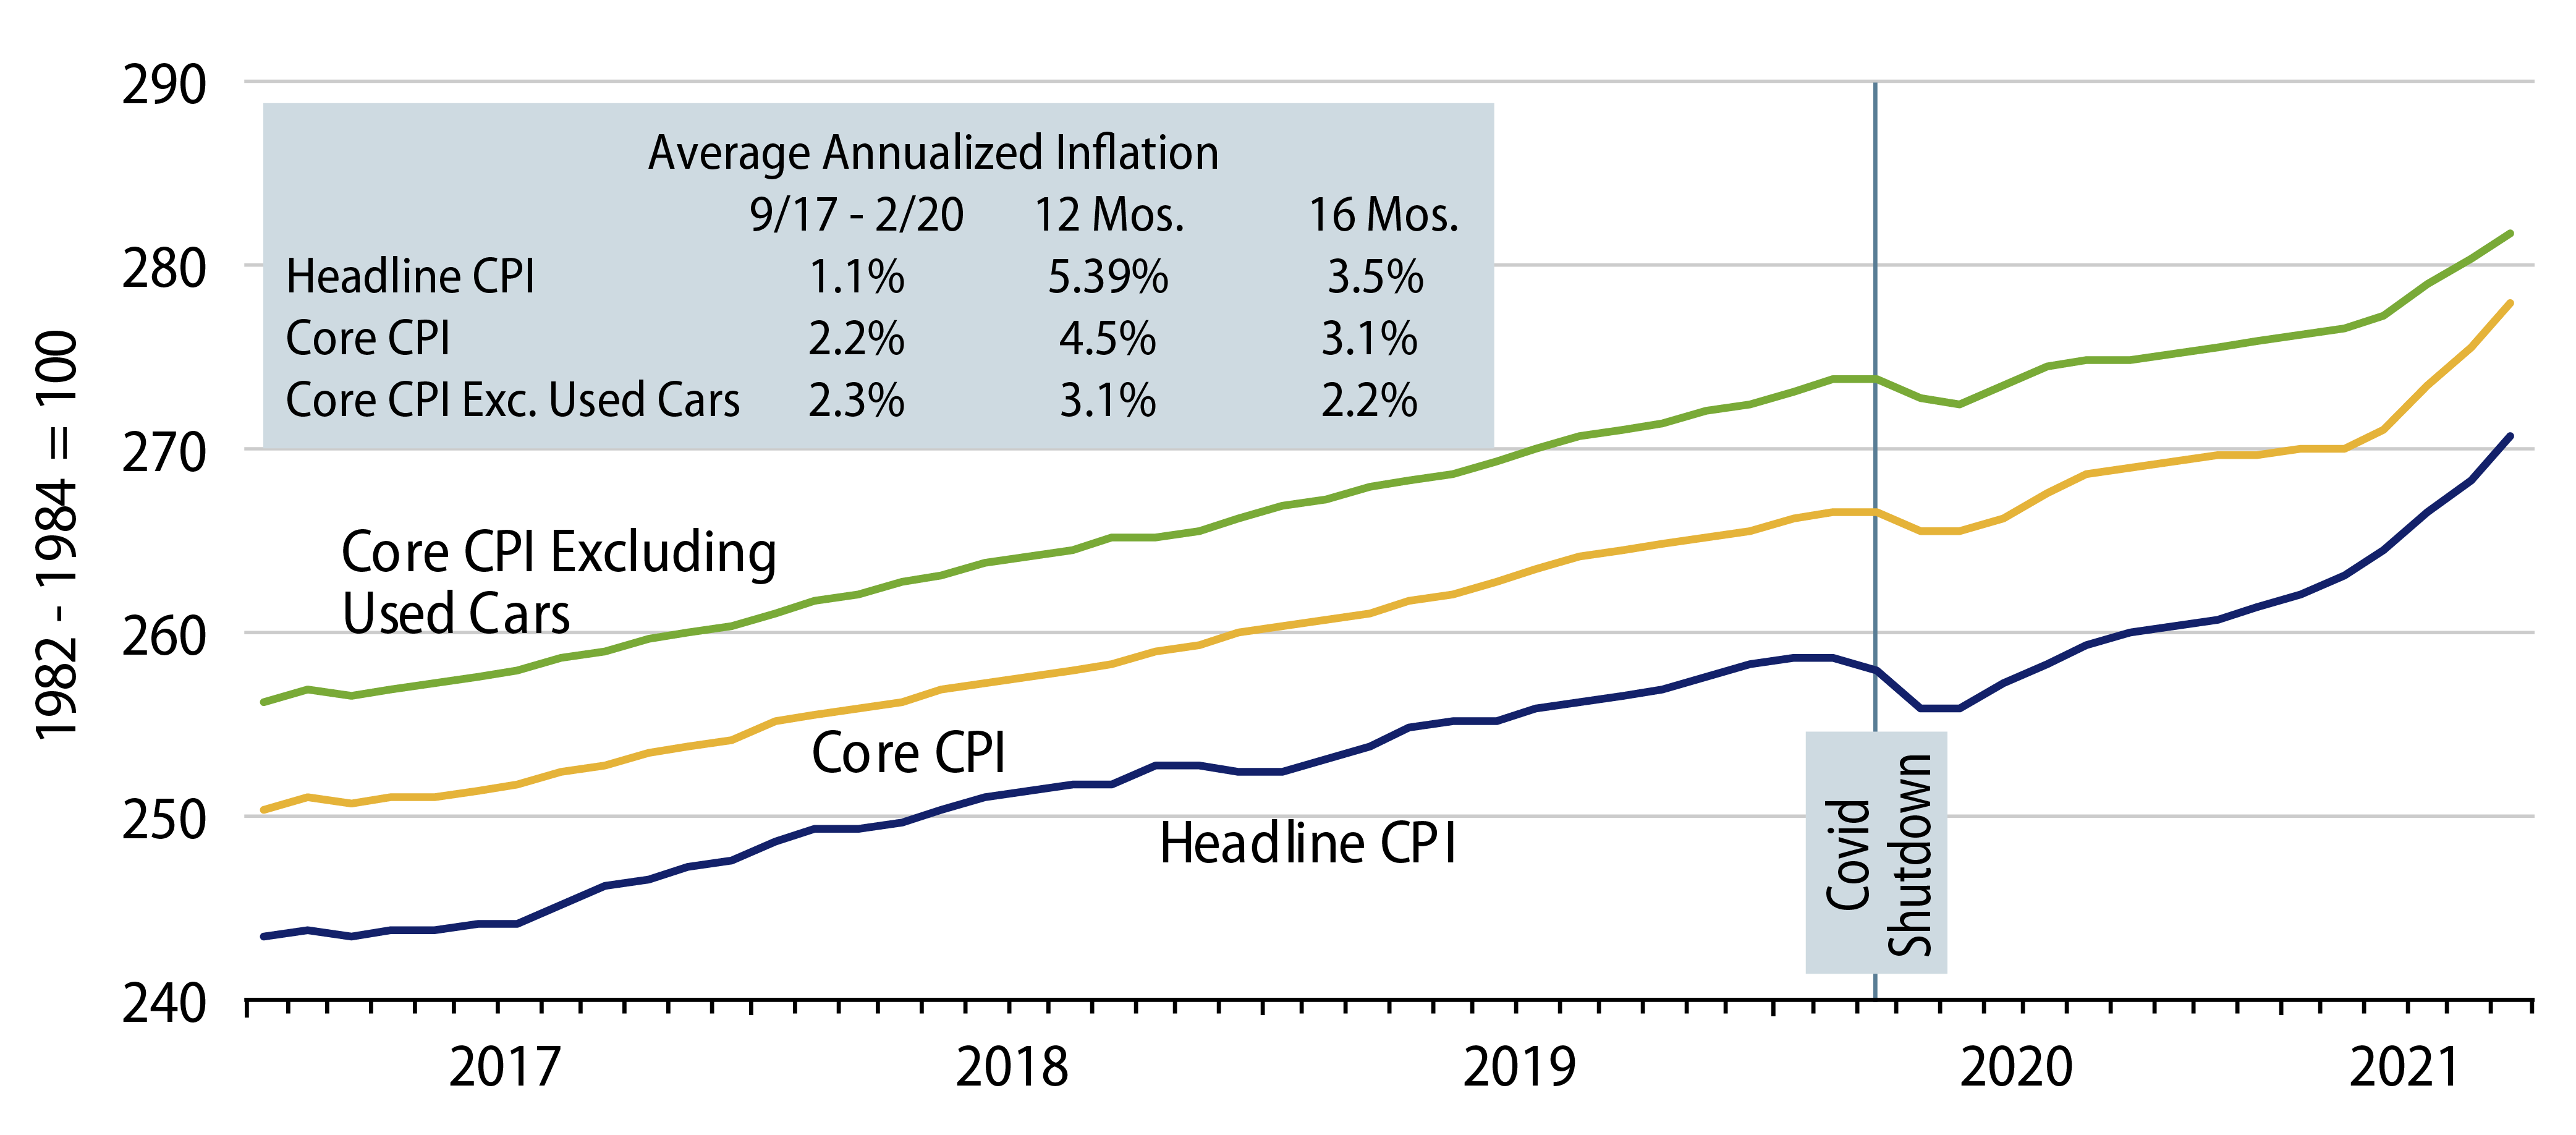
From this perspective, headline CPI inflation has been 3.5%, compared to a 1.1% trend prior to shutdown, and core inflation has been 3.1%, compared to a 2.2% pre-shutdown trend. So, it would appear that there has been some pickup in prices even apart from the (desired) post-Covid rebound. However, it is well known that a shortage of computer chips has disrupted car production, sending sharp ripples through the prices of new and used cars as well as rental cars.
It is not sober analysis to claim that obvious supply disruptions reflect inflationary pressures supposedly due to monetary or fiscal policy, yet the price measures discussed so far—which supposedly reflect inflation pressures—include the effects of vehicle pricing.
The third (green) line in the chart shows the core CPI upon excluding used car prices. That measure is up 3.1% over the past 12 months, but it too showed a marked decline during the shutdown. Its average inflation rate over the last 16 months is 2.2%, actually a little less than what was experienced prior to the shutdown. In other words, upon allowing for the natural rebounds of various prices from shutdown-depressed levels and for obvious supply chain effects on used car prices, inflation is actually still flat or down on net from its rates in place prior to the pandemic.
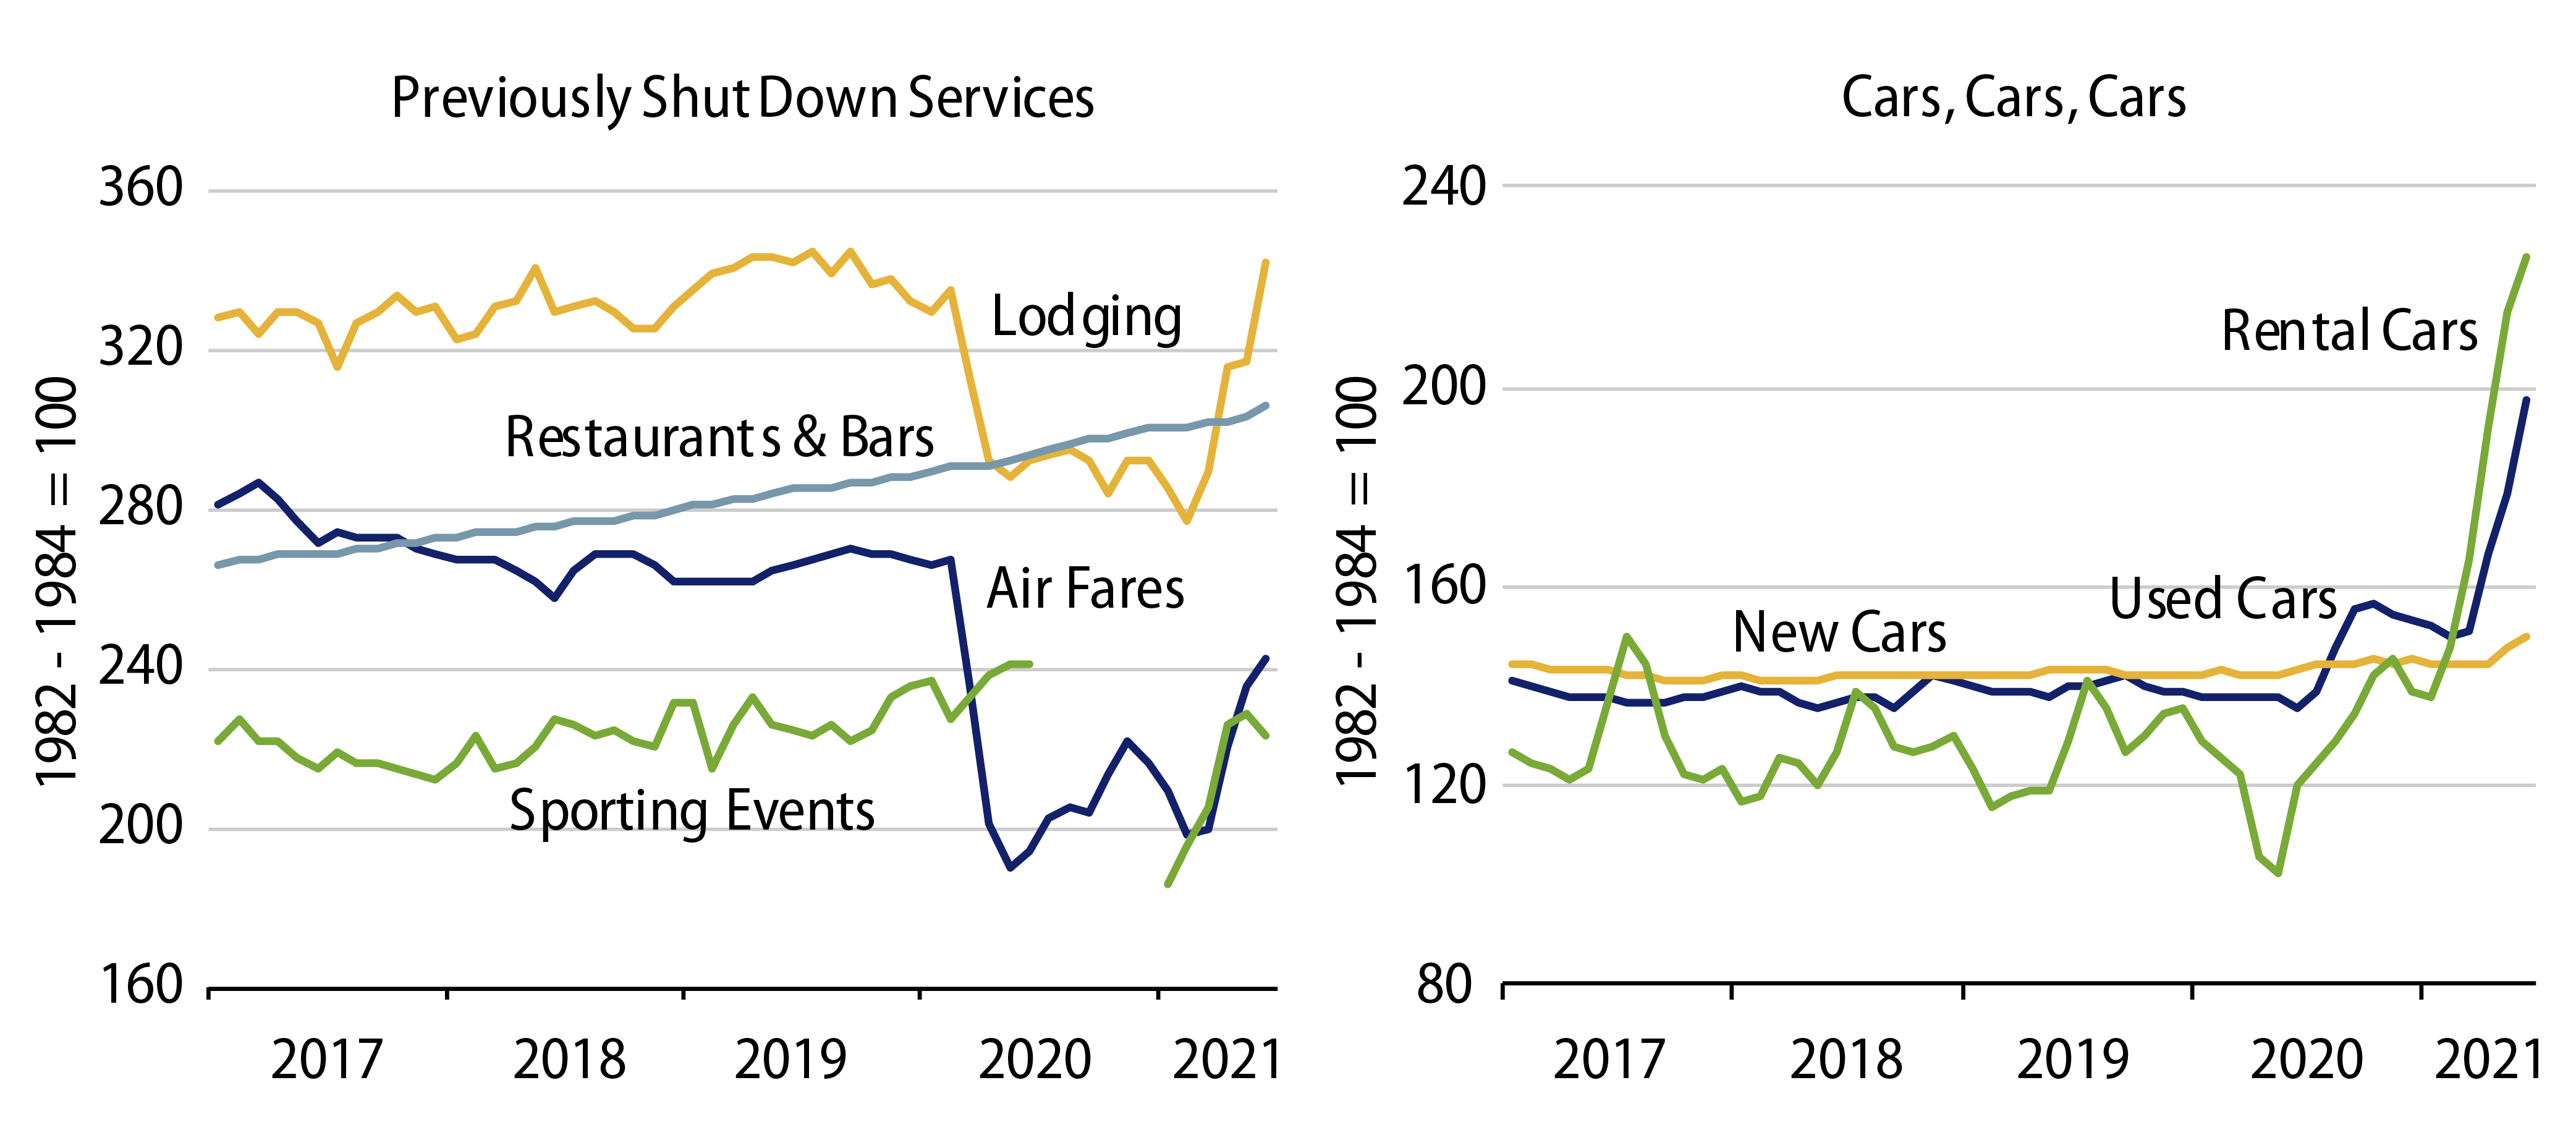
The next two charts in Exhibit 5 show details of various components of the CPI, specifically those components with the sharpest increases in recent months. As you can see in the left chart, airfares, lodging rates and sporting event prices have all shown increases of 15% to 20% non-annualized over the last five months, which have fed reported CPI inflation rates. Yet, for each of these, those supposedly fierce price increases reflect nothing more than a return toward or to pre-shutdown levels. Just to emphasize how extraordinary recent experience has been, sporting event prices were not even reported between July and December of 2020 because there was not sufficient activity there to provide a meaningful sample of prices.
Yes, car prices have risen. That these increases can be easily attributed to supply-chain disruptions means they can not reasonably be cited as evidence of inflationary pressures. They are a signal for the markets to boost car production and economize on car usage. It is a good bet each of these vehicle price increases will be reversed in the months to come. And apart from these “anomalies,” there has been no increase in inflation.
Similar remarks can be made with respect to raw materials prices. There are some scattered pockets where individual prices are up substantially during the reopening rally, for example, lumber, copper and corn prices. However, the vast majority of raw materials prices has seen only a rebound toward or to pre-shutdown levels.
Conclusion
Perhaps these factors have led to more sober pricing in financial markets, even as inflation scare stories continue to circulate in the media. It is clearly too early to assert that our inflation story has been vindicated by the data. However, it does appear to have found favor in market sentiment. We would also assert that any supposedly contrary indication in the price data can be easily dispensed once those data are carefully examined, such as we have done here.