

The long and variable lags of monetary policy following the end of the zero-interest rate policy (ZIRP) are leading to even wider cracks in the foundation of public and private credit markets. Some of these cracks may signal the economy tipping closer to a recession, despite growing confidence in the stability of the economy at higher interest rates.
As mentioned in a previous blog post referencing Hyman Minsky’s Instability Hypothesis, it is very relevant for this business cycle to monitor asset valuation multiples to assess growing default loss risks. This helps identify a potential tipping point at which the corporate sector is coerced to cut costs—including employee headcounts—raise liquidity and potentially sell assets.
Should credit problems accelerate, that might further depress asset valuations across credit sectors, creating a negative feedback loop that worsens the situation and ultimately increases the risk of a recession. The suppression of asset multiples, or lack of multiple expansion, has hindered private equity (PE) firm efforts to generate positive returns and attract new capital. For reference, PE buyout funds from the 2020 vintage are lagging 80% behind their historical distribution benchmarks to limited partners (LPs), according to Goldman Sachs Investment Banking and Ares Management. Less available equity capital can also tighten financial conditions, especially in the current environment, as many companies need more equity capital to refinance debt as asset valuations decline.
Smaller Companies Are Feeling the Pain of High Interest Rates
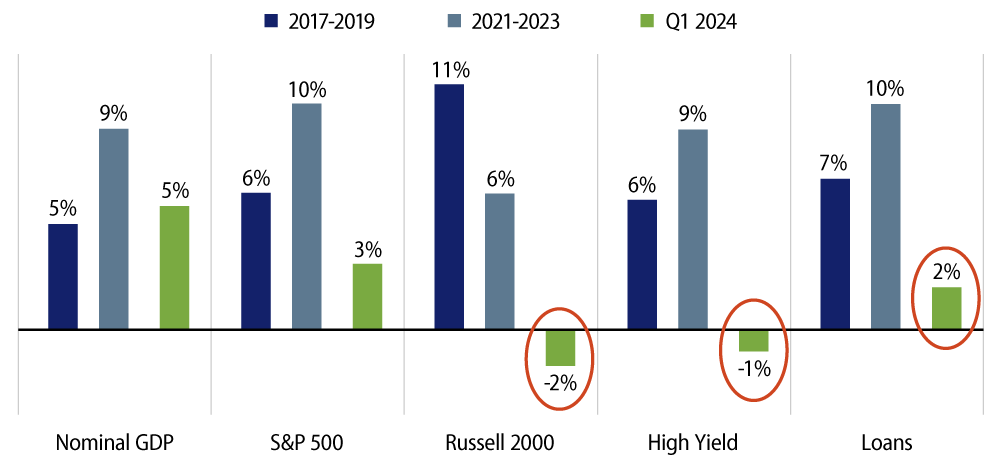
Aggregate data across businesses looked weak following 1Q earnings reports, especially for smaller companies. Revenue and earnings growth for smaller companies showed a concerning trend of much slower growth and actual declines.
When the Federal Reserve raised rates in early 2022, many companies were still able to increase prices on goods and services in excess of higher costs associated with supply-chain disruptions during 2021 and 2022, thereby improving margins and profits. However, in 2023 and as recently as 1Q24, most companies saw less willingness from consumers to accept higher prices, leading to lower sales volumes for goods and services as well as actual declines in total revenue for some companies. This trend is also reflected in many sectoral contributions to the Consumer Price Index (CPI). The median smaller company, which is more reflected in the Russell 2000 and below investment-grade markets, has seen a more meaningful impact from slower growth and higher interest rates than larger companies, like those in the S&P 500 and, specifically, the mega-cap “Magnificent 7.” In aggregate, Russell 2000 companies reported a revenue decline of 2%, which was a greater decrease than seen by the median high-yield or bank loan issuer, all of which were less than the nominal level of GDP growth for those periods.
Valuation Multiples for Most Companies Have Declined
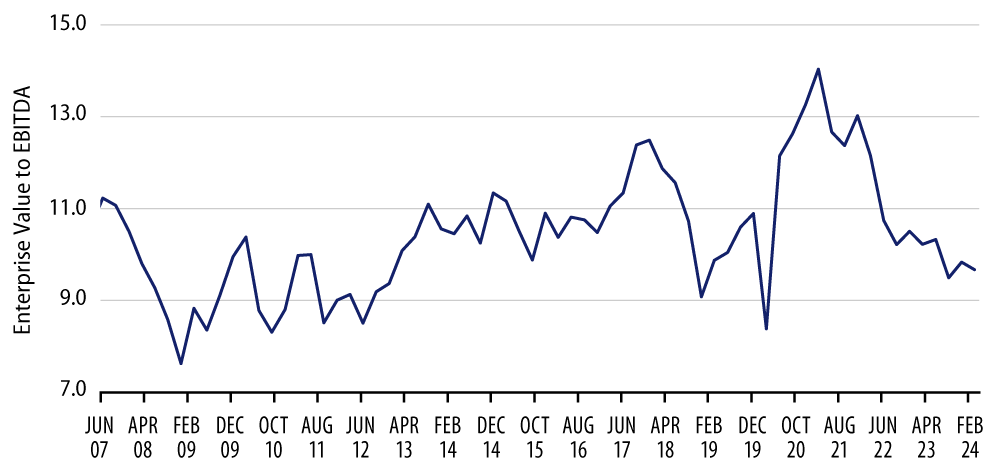
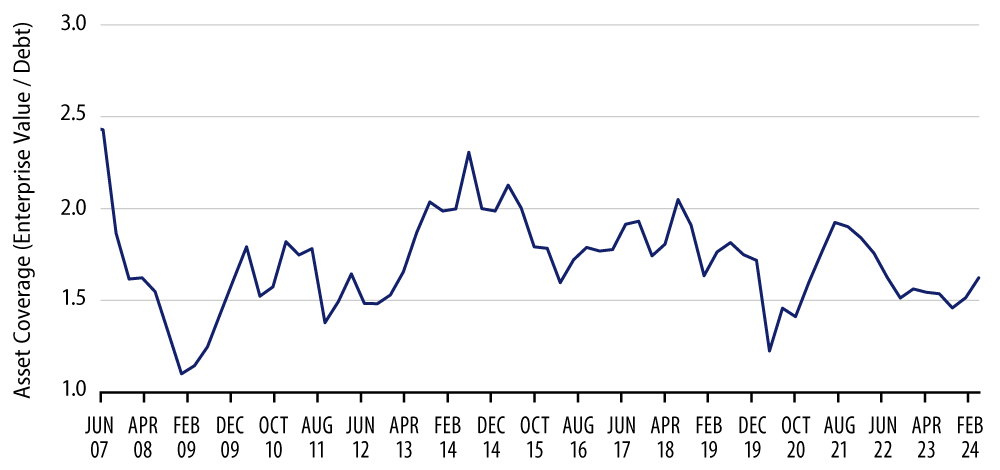
Valuation multiples for most companies moved in advance of this lower reported revenue and earnings, but also declined given the rise in interest rates. Like the fundamental dispersion between larger and smaller companies with revenue growth, the declines in enterprise value (EV) to EBITDA have been much worse for smaller companies. It’s worth noting that from the end of low interest rates at the end of 2020 to the end of 1Q24, the EV/EBITDA multiple declined by more than 40% to 15.8x for the Russell 2000 and about 30% for the equal-weighted S&P 500 Index to 13.0x, which was far worse than the S&P 500 decline of 13% to 16.2x, according to Bloomberg. When looking at public credit senior bank loans, it’s worth noting that the decline in multiples for B rated issuers was over 30% for the same period. We use B rated issuers to make a more apples-to-apples comparison to the default risk in private credit middle-market lending. The decline in valuations for this proxy for private and public credit markets was similar to the equal-weighted S&P but not as bad as the Russell 2000. This decline in asset valuations has resulted in lower asset coverage (EV to debt) for many issuers, which resulted in downgrades to CCC and a meaningful rise in defaults. Worth noting is that the trailing 12-month issuer-weighted default rate in speculative-grade US loans rose from just over 1% at the end of 2021 to over 6% in 1Q23.
Public and private credit multiples have not recovered much, which may keep default rates elevated as borrowers need to refinance.
Declines in Asset Multiples Often Result in Credit Rating Downgrades and Defaults
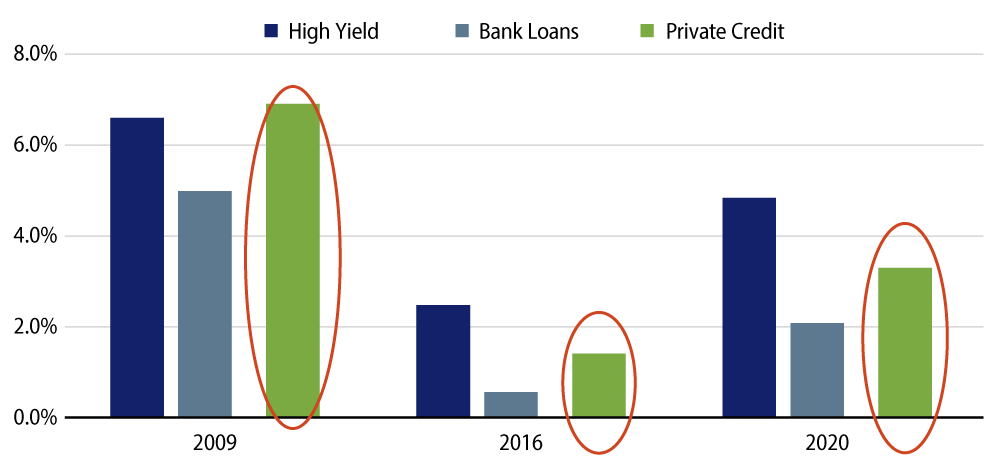
Why do defaults rise when asset valuations fall? Lenders require sufficient equity capital or asset coverage to make new loans. Loans in public and private credit markets, many of which financed private equity firms’ leveraged buyouts over the last five years, typically are floating-rate loans with maturities of about five years. As the loans originated during the “good times” pre-Covid and the quarters that followed post-Covid stimulus approach their maturity, company valuations have declined, creating tougher choices for many borrowers when they need to refinance that can sometimes result in restructuring loans or defaulting. While underwriting standards, including covenants, aim to reduce losses when default happens, the losses will be determined by what the collateral is worth. For this reason, active selection is critical to capture upside and minimize losses in credit markets. It’s also worth noting that in times of stress, there is meaningful dispersion in credit losses. Despite reportedly stronger covenants in private credit markets compared to syndicated bank loan markets, credit losses have been higher in private middle-market loans in the last few periods of stress, according to data reported by Cliffwater.
For credit market investors, especially those with floating-rate bank loans in public and private markets, we would expect defaults and liability management exercises (LME) to remain elevated or worsen if asset multiples decline. That said, the economy may be near an inflection point due to a combination of slower top-line growth, declining margins and lower asset valuations.
How Could This Be Beneficial for CLO Equity Investors?
There are several reasons why the current environment may create an optimal opportunity for buy-and-hold collateralized loan obligation (CLO) equity investors focused on broadly syndicated bank loans (BSLs). First, the meaningful decline in credit spreads over the last year has been beneficial for many CLO originators to lock in relatively low borrowing costs through issuing and/or refinancing their floating-rate CLO debt. As a result, the margin between income earned on floating-rate bank loan assets and interest expense on CLO debt improves, resulting in higher profits that can be distributed to equity holders. Another advantage for CLO equity investors is that should growth continue to slow or tip into recession, this has typically led to higher-than-average equity returns. Historically, actively managed CLOs issued just ahead of recessions improved their margins by reinvesting assets at higher yields, leaving more profit for equity investors. For more details, see our previous publication highlighting the outperformance of CLO vintages issued before previous recessions.
While CLO equity has structural advantages and optionality that enable an active manager to achieve better returns in improving or declining credit markets, the underlying collateral requires some liquidity to capitalize on these options. In other words, CLOs focusing predominately on illiquid loans may not have as much ability to improve returns when credit markets decline. That said, we see opportunities in the current environment in both public and private credit markets. However, the comparative value of CLO equity should increasingly appeal to buy-and-hold investors given anticipated return obstacles for other alternatives.