
The Consumer Price Index (CPI) jumped 0.9% in March, according to data released Friday by the Bureau of Labor Statistics. This was the first piece of data showing effects of the conflict with Iran. Indeed, that conflict could be seen as the major impetus for the big March price jump, as core CPI, which excludes food and energy prices, increased “only” 0.2%, or at a 2.4% annualized rate.
And no, food prices were not part of the problem in March. Prices for food and beverages actually declined very slightly in March. However, energy prices rose a resounding 10.87% in March, driven by a 18.80% rise in fuel oil and a 21.46% rise in motor fuel prices.
According to this CPI data, core goods prices rose only 0.11% and non-energy services prices rose just 0.23%. In other words, there was no pass-through of higher gas prices to other prices in the economy. This is not saying much, of course, as most of the March observations were collected when the Iran hostilities were just beginning.
However, as we noted in our post last week, consumers balked a bit at the price increases occurring over December-February, with nominal spending on various items holding steady, but real spending declining as prices rose. In view of this, retailers may not feel comfortable passing on higher freight costs in the months ahead.
We should also take a moment to chip away at popular wisdom regarding oil prices and the economy. Contrary to that wisdom, soaring gas prices did not cause the inflation outbursts of 1973-1974 and 1979-1980. In both of those episodes, inflation had already become rampant prior to oil price shocks. In 1973, oil prices spiked on the Arab embargo of oil exports to the West, in retaliation for Western support of Israel in the Yom Kippur War. That occurred in October 1973. Yet CPI inflation had already attained an annualized rate of 9% in the summer of 1973, months prior to the Arab embargo.
Similarly, CPI inflation was on the rise again from 1976 on and had attained a 9% annualized rate by mid-1978, well before the fall of the shah in February 1979. Oil shocks may well exacerbate inflation episodes, but they have not fomented them historically in the US. And no, we don’t regard the 2.5%-3.0% inflation of the last year as being anything comparable to the inflation episodes of 1972-1973 or 1976-1978 (prior to those oil shocks).
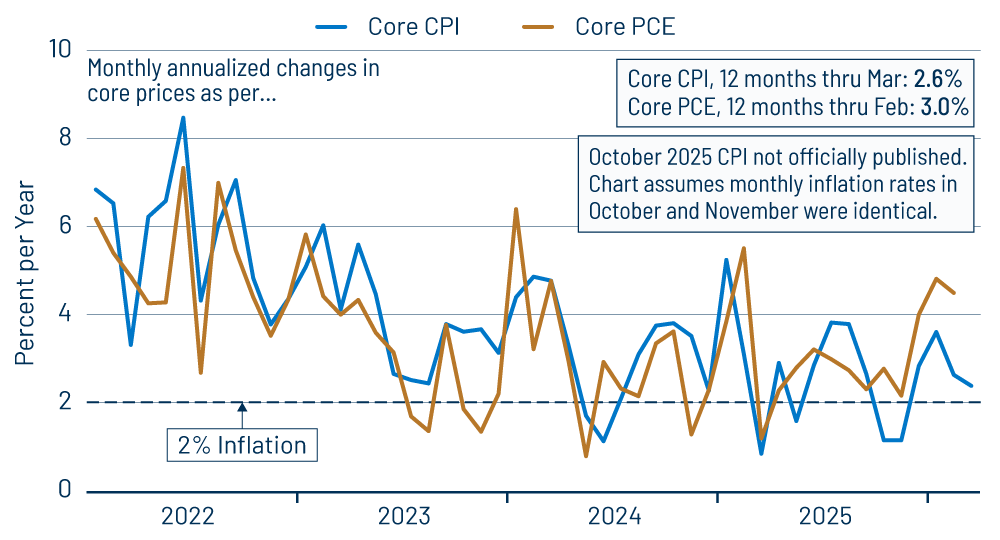
Meanwhile, in our post last week, we mentioned that within the respective core inflation measures, the core Personal Consumption Expenditures (PCE) index was behaving quite differently from the core CPI. That is, core goods PCE inflation was at sharply higher rates over December-February than what we saw in the core goods CPI, with the core goods PCE showing monthly (non-annualized) increases of 0.4%, 0.3% and 0.8%, respectively, in those months, while the core goods CPI rose by only 0.0%, 0.0% and 0.1%, respectively. This disparity was in stark contrast to the close coherence those indicators had displayed previously.
We promised to investigate the reasons for the recent disparity, and Exhibit 2 features a summary of that research. We should point out that the two indices always show some difference, thanks to differences in weighting schemes and also to the fact that the core goods CPI includes alcoholic beverage prices, whereas those are counted in the “food” complex in the PCE. Still, the various price increases for individual components typically are close for the two indices. That has not been the case in recent months.
Exhibit 2 shows weights and monthly price changes for various components of core goods inflation for the two indices. We lined up the components as closely as practicable, given differences in reporting for the PCE versus CPI. As you can see, the weights don’t add up to 100%, but we show most of the components for the respective indices. The lower sum of weights for the CPI reflects our exclusion of alcoholic beverages from the analysis, as these are not in the core PCE. Also, the weighted averages of the various columns cohere closely to the monthly core goods index increases for those months, so we believe our table in Exhibit 2 does a good job of capturing the dominant sources of difference between the two indices over December-February.
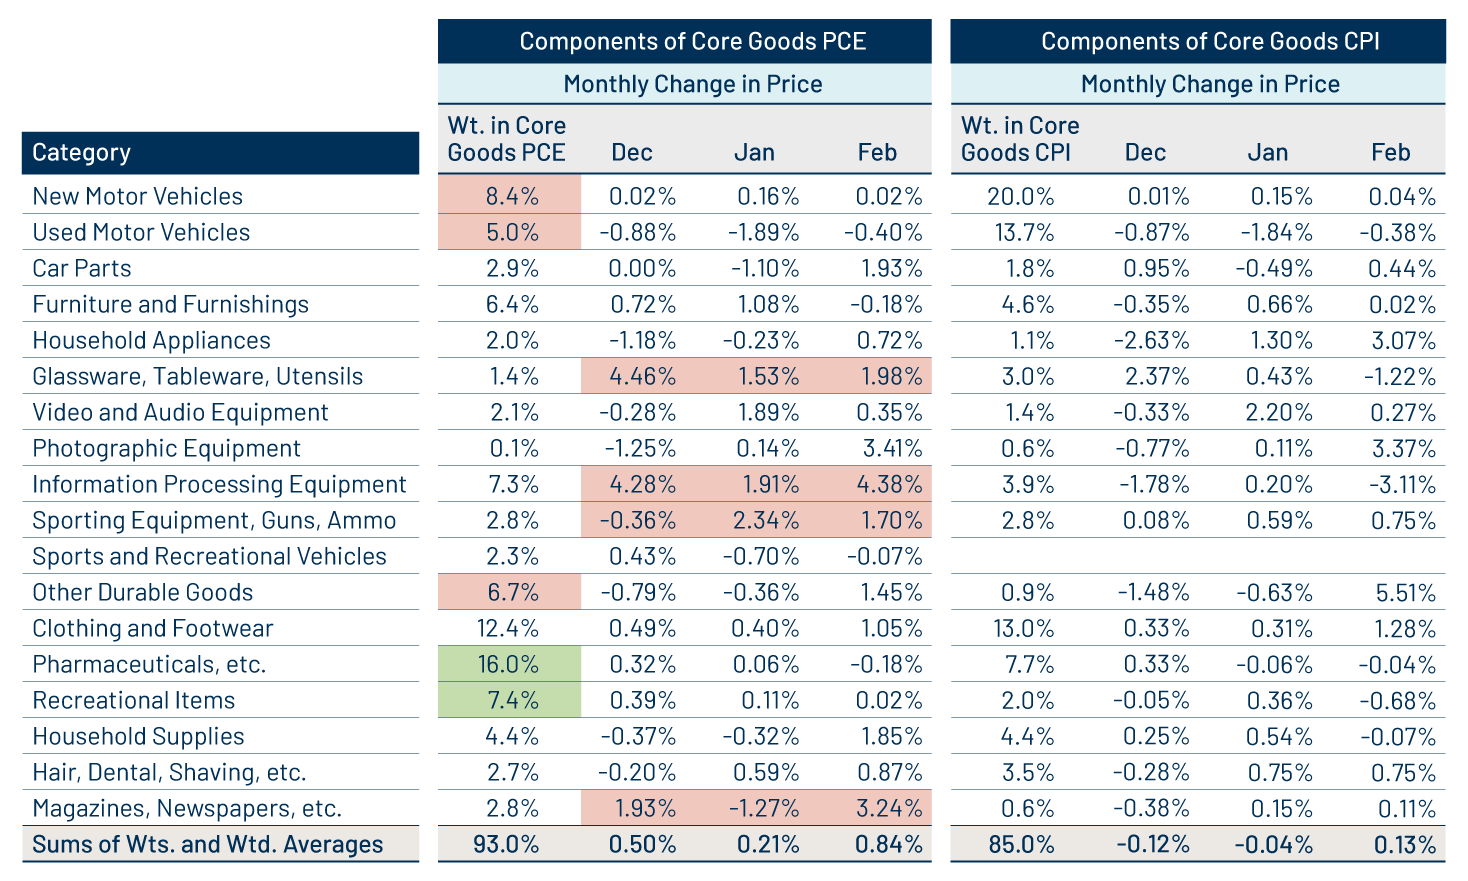
Look first at “information processing equipment,” that is, computers, software, peripherals and smartphones. CPI data show those prices generally declining substantially over the last three months. However, PCE data indicate very sharp increases. Both measures show software prices rising sharply, but the CPI apparently gives a much higher weight to smartphone prices, which were still declining sharply through February.
A similarly large discrepancy can be seen for magazine and newspaper prices. Not only does the PCE index show much bigger price increases for these items, but also it gives them a much higher weight.
Smaller but still significant differences in price changes can be seen for kitchenware and sporting equipment within the respective indices. Meanwhile, much lower weights for motor vehicles in the PCE than in the CPI reduce the impact of the stable prices there on the PCE measure.
We would not begin to argue which one of these is right and which is wrong, or, more precisely, which gives the more accurate measure of inflation over December-February. Our main point is that, again, the two indices behaved dramatically differently in recent months, and we have attempted to provide some direction as to whence those discrepancies arise.
We would expect the two measures to get back into closer agreement in months to come. We think that will come from a move in the core goods PCE toward that of the core goods CPI, but that remains to be seen.