Real GDP contracted at a -32.9% annualized rate in 2Q2020, far and away the largest quarterly decline on record for the US. Unofficial estimates for Gross National Product—the precursor to GDP—from the National Bureau of Economic Research show a 30% annualized quarterly decline in 1893 and 20-handle declines on occasion through the Great Depression, but nothing worse. Official GDP data from the US Commerce Department, extending back to 1947, showing nothing worse than a 10.0% decline in 1Q1958.
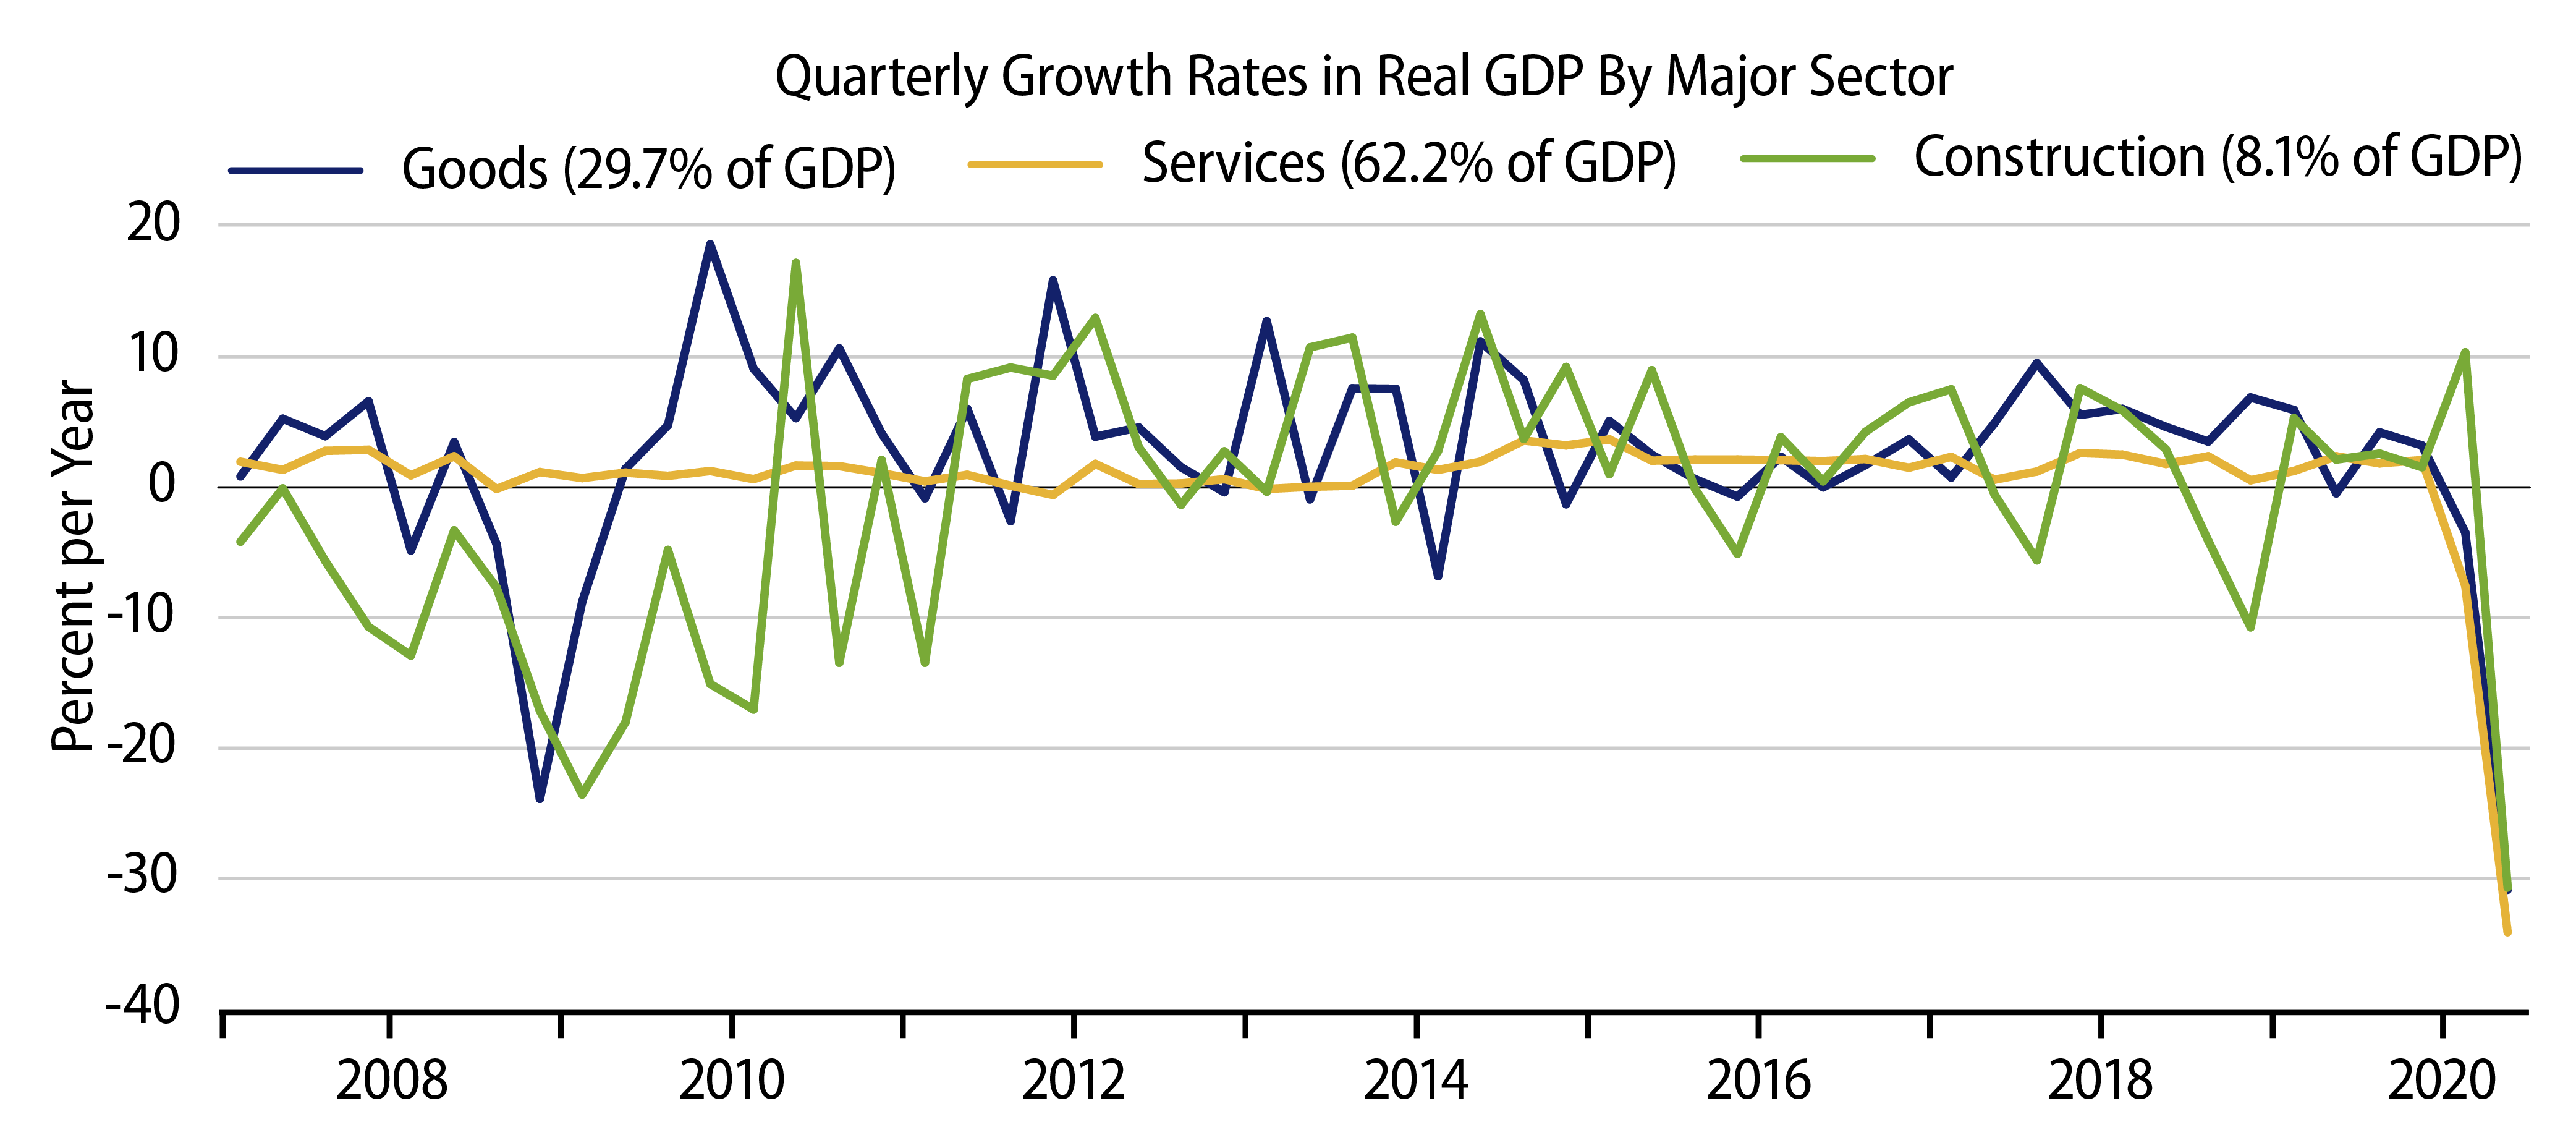
Besides the magnitude of the decline, it is worth repeating that the composition of the decline was also extremely unusual, with the service sectors accounting for the bulk of the contraction. The accompanying chart makes this point eloquently. There, GDP growth is broken down into its three main components, goods (mostly manufacturing), construction and services. These sectors presently account for roughly 30%, 10% and 60% of total GDP, respectively.

Sure, goods and construction output saw horrible declines in 2Q, but these were not beyond the pale of declines seen during the 2007-09 global financial crisis or in prior slumps. For services, however, output generally does not decline at all during recessions. But this time around services were the epicenter of the slump, showing declines even sharper than those for goods and construction.
This, of course, reflects the nature of the plunge, a combination of suppressed economic activity due to the economic shutdown and some piling-on coming from fears of the COVID virus among the populace. Both the shutdown and the fears focused on sectors where people (usually) interact closely, namely services and especially five particular service sectors: health care, restaurants, recreation, accommodations and passenger travel.
Of the 34.1% rate of decline in service-sector output, the bulk of that decline occurred in these five sectors. Similarly, while goods and construction sectors have rebounded nicely since the beginning of May, recovery has been only partial in health care and restaurants and hardly at all in recreation, accommodations and travel.
As horrendous as the GDP decline was, it was much less bad than what was expected three months ago, when most pundits were projecting annualized declines of around 40%. Looking forward, we have been relatively sanguine on the economy’s recovery prospects overall, but we have acknowledged that the hard-hit service sectors face a slower, more prolonged recovery path. Meanwhile, popular opinion seems to have it that the economy’s recovery is stalling. We offer three contrary perspectives on that.
First, the renewed shutdown initiatives in various locales do not appear to be affecting the goods and construction sectors where the recovery so far has occurred. So, what various folks are describing as a faltering recovery may in fact only be a recognition that recovery is lagging in the aforementioned, hard-hit service sectors.
Second, after the extremely high growth rates seen in May and June for measures such as payroll jobs, retail sales, etc., July/August growth rates will inevitably be much smaller. This will not be a faltering of the recovery, so much as a return to saner growth rates.
Third, along these same lines, with various components of the economy still not completely recovered, comparisons to year-ago levels are inevitably going to look anemic. Most of the anecdotal data floating around is indeed based on comparisons to year-ago levels.


