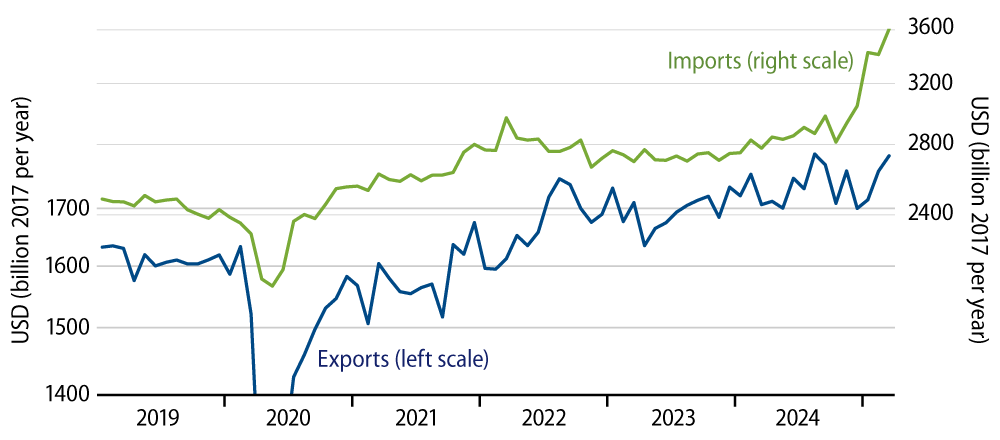
The US merchandise foreign trade deficit rose by an annualized rate of $183 billion in March over the February total, according to data released today by the Census Bureau. The merchandise trade deficit rose by an annualized rate of $566 billion for the first quarter as a whole. In real (2017) dollars, the trade deficit rose by $168 billion in March over February and by $514 billion in 1Q over 4Q.

These are eye-popping numbers and clearly reflect the effect of US importers and foreign exporters attempting to rush goods into the country prior to Mr. Trump’s tariffs taking effect. Rising imports were fully responsible for the increase in the trade deficit, as US exports rose in both nominal and real terms in 1Q. Most import categories showed increases, but the gains were outlandishly large in two sectors.
The Census Bureau breaks its foreign trade data down into six major components: food, industrial supplies, capital equipment, autos and parts, consumer goods, and other goods. For food, autos, and “other” goods, imports were little changed in 1Q over 4Q. For capital goods, imports were up, but by amounts in line with the previous year’s trends.
For industrial supplies and consumer goods, however, the 1Q gains were explosive and accounted for most of the increase in the trade deficit. You can see these increases in Exhibit 2. And within industrial supplies and consumer goods, the 1Q increases in imports were especially large in components titled “finished metal shapes” and “pharmaceutical preparations.” “Finished metal shapes” would seem to refer to metal parts other than automotive. “Pharmaceuticals” are self-explanatory.

Besides the implications for tariff policy, these data also have a bearing on the reported 1Q decline in GDP announced last week. As we remarked in our post last Friday, rising imports and a resulting increase in the trade balance accounted for the reported decline in GDP. The decline in goods sector GDP in 1Q was quite at odds with other data that showed accelerating US 1Q goods sector growth. Our suspicion was that while the increase in the trade deficit was accurately reflected in the GDP data, those imported goods went somewhere that was not commensurately reported and are possibly now warehoused in a comparably large increase in merchant inventories (of imported goods).
The trade details reported here are consistent with that suspicion. It is quite plausible that Census data collection techniques did not pick up the dramatic increase in “intermediate” inventories of metallic goods or pharmaceuticals. (Intermediate inventories are those NOT held on retailers’ shelves.)
A problem with our assertion here is that there are substantial differences between the foreign trade data reported by the Census Bureau and those of the GDP data reported by the Bureau of Economic Analysis (BEA). (Both bureaus are part of the Commerce Department but have their own individual data compilation techniques.) To wit, the GDP data from BEA do not show any substantial increase in imports of industrial supplies in 1Q.
They do show a huge increase in first quarter pharmaceutical imports and only a slight increase in consumer spending within the sector. Unfortunately, we don’t have any detail on BEA’s estimates of pharmaceutical inventories.
The fact remains that the GDP goods sector data are quite at odds with the production data for that sector for 1Q. Maybe the downstream disposition of the dramatic 1Q increase in imports can account for this disparity, but at this point, we don’t have sufficient detail to say for sure.
In the meantime, one thing to keep in mind is that just as imports soared prior to the imposition of tariffs, they are going to plummet with the onset of tariffs in the second quarter. If, indeed, the 1Q GDP data were falsely restrained by rising tariffs and faulty downstream accounting of these flows, that is likely to be reversed by a sharp boost to 2Q GDP growth as import volumes plummet. It will be especially interesting watching the data in the Brave New World of Mr. Trump and friends.


