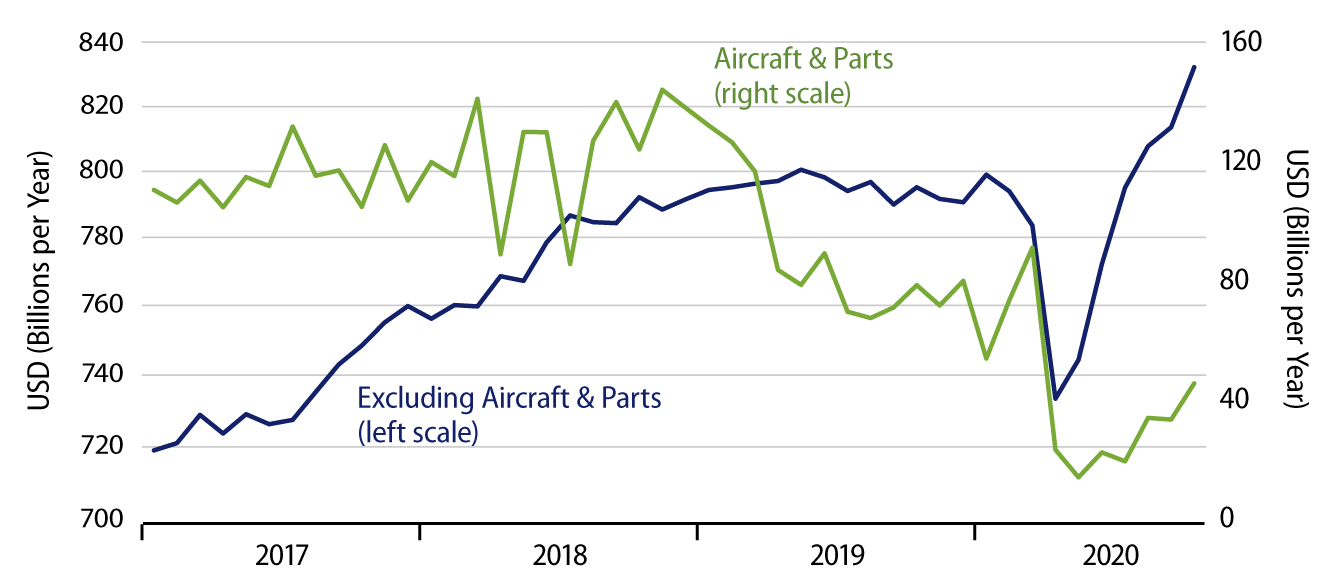
New orders for durable goods rose 1.3% in October, on top of a slight 0.1% upward revision to September. Excluding the volatile transportation equipment group, durables orders also rose 1.3%, but with a substantial 0.6% upward revision to September. Focusing on new orders for capital equipment (excluding aircraft), orders there rose 0.7% in October, with a +0.9% revision to September.
The gains here show clearly that the recovery of the last six months has not been solely a consumer spending affair. As strong as the consumer spending data have been since May, the rebounds in business spending and even in exports have been impressive as well.
The Exhibit here focuses on shipments of capital goods in order to emphasize that the rebound there has not been just orders for future purchases, but actual production and shipment of these goods as well. Such shipments have bounced 15.2% from their April low and are up 3.7% from February, pre-Covid levels.

In fact, recent levels of capital goods shipments probably cannot be sustained at current levels. The same goes for orders for all durable goods and for retail sales and consumer spending on goods. For all these indicators, recent activity levels greatly exceed pre-Covid levels, evidence that businesses and consumers are making up for purchases not transacted during the shutdown.
This is typical of economic indicators. When activity levels are artificially constrained for a month or two, subsequent months’ data typically show activity levels bouncing way above pre-constraint levels and then, after a while, falling back to pre-constraint trends. In the past, we have seen such saw-tooth patterns during and after blizzards and labor strikes. It is no surprise to see similar patterns triggered by the Covid shutdowns. The question becomes how long current elevated levels of activity can last.
For shipments of non-aircraft capital goods, average levels for 2020 through October are about 1% below the average for all of 2019. In order to bring average levels since January 2020 back to 2019 levels, capital goods shipments would have to be maintained at October levels for another two to three months.
This is a good estimate of how long the currently elevated levels of capital goods shipments can continue. After sustaining such strength for another two to three months, it is likely that capital goods shipments will then fall back to the flat trends of 2018-19 evident in the chart. Such declines would not be a sign of weakness, but merely an indication that the post-shutdown catch-up in activity is complete.
For durable goods in general, the recovery since April has not been quite as robust as that for capital goods. In fact, September shipments of all durable goods were still below pre-Covid levels, so there, the recovery can strengthen further and be maintained quite a few months longer.
By the same token, one should ignore media alarms that recent slowing in growth rates of various aggregates is worrisome. The explosive growth rates seen in various aggregates over the summer were a one-time catch-up from severely depressed levels. They were not a sign of true strength, but merely of recovery from weakness. The slower recent growth rates are not a sign of weakness, but rather of a maturing recovery. Even Shaquille O’Neal stopped growing after a while, but he was still plenty tall.


