skip navigation
Western Asset Management Company
Blog

Stay up to date on timely topics and market events. Subscribe to our Blog now.

ECONOMY
June 25, 2026

Consumption up modestly in May, but with odd details

By Michael J. Bazdarich, PhD

Stay up to date on timely topics and market events. Subscribe to our Blog now.

Real consumer spending rose 0.3% in May, or at a 3.2% annualized rate, which is a bit stronger of a pace than we had been seeing in previous months. Within the May details, spending on both basic goods and basic services rose nicely. However, there were very sharp downward revisions to previous months’ spending data all the way back to January.

This is odd in that, typically, spending data see little revision more than two months back, in this case back to March. Instead, again, the data were revised substantially all the way back to January. Similarly odd was the composition of those revisions. In preceding posts, we have been spending a lot of time talking about an apparent slowing in spending on goods, while services spending was holding up okay. Well, goods spending was actually revised up for March and April. It was services spending that saw all the big downward revisions back to January. (We’ll get into the details of the services downgrade shortly.)

Exhibit 1: Real Consumer Spending by Type
Real Consumer Spending by Type
Source: Bureau of Economic Analysis. As of 31 May 26. Select the image to expand the view.

So, with consumer spending revised down big-time all the way back to January, 1Q GDP was also revised lower, right? Wrong. Annualized 1Q real GDP growth was actually revised substantially higher, from 1.6% to 2.1%. Yes, 1Q real consumer spending was indeed revised substantially lower, from 1.4% to 0.5% growth. However, 1Q imports of merchandise were sharply lower, from 25.5% to 16.6% annualized growth, and since imports enter GDP negatively, that accounted for more than all of the upward lift to 1Q growth.

We hate to sound like a “two-handed” economist, but there are two conflicting aspects to this story. On the one hand, it is really odd to see such downward revisions to imports of merchandise at the same time there were (modest) upward revisions to consumer spending on merchandise. Both revisions served to boost estimated growth in domestic output of merchandise. (Higher domestic spending on goods obviously works to boost domestic output, and if the goods didn’t come from imports, they must have come from domestic production.)

And this is the “other hand” of the story. When preliminary 1Q GDP data were first announced two months ago, we pointed out that those data showed weak growth in domestic goods output, even while Federal Reserve data on industrial production were showing relatively strong 1Q growth in manufacturing output. Well, today’s revisions go a long way toward bringing the GDP and industrial production data back into agreement.

In other words, the data as they now stand actually make sense. It was just a long, strange trip getting here.

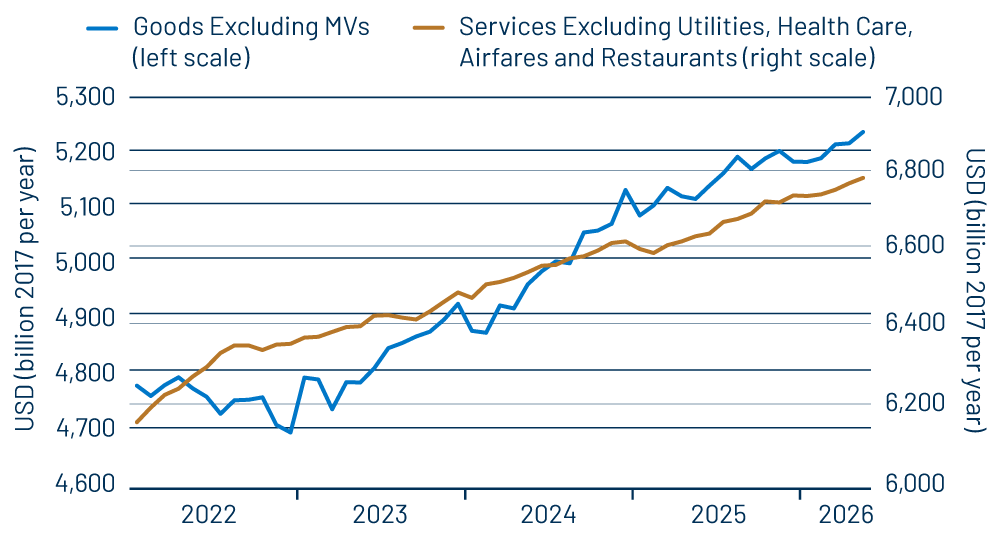
So, when the dust settles, where does the consumer stand? Well, again, the data actually show better performance lately for consumer spending on goods, as is evident from Exhibit 1. As you can also see there, consumer spending on services is still shown to be growing okay, just not as strongly as previously estimated. Services spending shows a little “wobble” in January and February but has resumed growth in the months since then.

As for the locations of the downward revisions to services spending, as large as they were, they were focused in just a few sectors. Health care spending was revised down slightly, recreational services and social services were revised down substantially, and motor vehicle services (repair, leasing and rentals) were revised down very sharply. Other services sectors actually saw upward revisions.

This is quite a complicated array of data. Our take has been that ever since the government shutdown ended, the data have evinced peculiarities. It was again so today, but again also, the data as currently portrayed are actually starting to make sense.

As for inflation, both headline and core Personal Consumption Expenditures (PCE) inflation registered relatively high monthly rates in May, with annualized monthly rates of 5.5% and 3.9%, respectively. Gas prices boosted headline inflation relative to core, and services prices rose sharply. Core goods prices declined, though, which finally brings PCE data back into accord with what the Consumer Price Index (CPI) is saying, for the month of May at least. With gas prices declining presently, both inflation measures look set to soften in June, and with goods prices behaving, there still looks to be little evidence of pass-through from Iran-affected fuel prices to the rest of the economy.

© Western Asset Management Company, LLC 2026. The information contained in these materials ("the materials") is intended for the exclusive use of the designated recipient ("the recipient"). This information is proprietary and confidential and may contain commercially sensitive information, and may not be copied, reproduced or republished, in whole or in part, without the prior written consent of Western Asset Management Company ("Western Asset").
Past performance does not predict future returns. These materials should not be deemed to be a prediction or projection of future performance. These materials are intended for investment professionals including professional clients, eligible counterparties, and qualified investors only.
For the Franklin Templeton global-non product disclosures, please click here.
These materials have been produced for illustrative and informational purposes only. These materials contain Western Asset's opinions and beliefs as of the date designated on the materials; these views are subject to change and may not reflect real-time market developments and investment views.
Third party data may be used throughout the materials, and this data is believed to be accurate to the best of Western Asset's knowledge at the time of publication, but cannot be guaranteed. These materials may also contain strategy or product awards or rankings from independent third parties or industry publications which are based on unbiased quantitative and/or qualitative information determined independently by each third party or publication. In some cases, Western Asset may subscribe to these third party's standard industry services or publications. These standard subscriptions and services are available to all asset managers and do not influence rankings or awards in any way.
Investment strategies or products discussed herein may involve a high degree of risk, including the loss of some or all capital. Investments in any products or strategies described in these materials may be volatile, and investors should have the financial ability and willingness to accept such risks.
Unless otherwise noted, investment performance contained in these materials is reflective of a strategy composite. All other strategy data and information included in these materials reflects a representative portfolio which is an account in the composite that Western Asset believes most closely reflects the current portfolio management style of the strategy. Performance is not a consideration in the selection of the representative portfolio. The characteristics of the representative portfolio shown may differ from other accounts in the composite. Information regarding the representative portfolio and the other accounts in the composite are available upon request. Statements in these materials should not be considered investment advice. References, either general or specific, to securities and/or issuers in the materials are for illustrative purposes only and are not intended to be, and should not be interpreted as, recommendation to purchase or sell such securities. Employees and/or clients of Western Asset may have a position in the securities or issuers mentioned.
These materials are not intended to provide, and should not be relied on for, accounting, legal, tax, investment or other advice. The recipient should consult its own counsel, accountant, investment, tax, and any other advisers for this advice, including economic risks and merits, related to making an investment with Western Asset. The recipient is responsible for observing the applicable laws and regulations of their country of residence.
Founded in 1971, Western Asset Management Company is a global fixed-income investment manager with offices in Pasadena, New York, London, Singapore, Tokyo, Melbourne, São Paulo, Hong Kong, and Zürich. Western Asset is a wholly owned subsidiary of Franklin Resources, Inc. but operates autonomously. Western Asset is comprised of six legal entities across the globe, each with distinct regional registrations: Western Asset Management Company, LLC, a registered Investment Adviser with the Securities and Exchange Commission; Western Asset Management Company Ltda. is regulated by Comissão de Valores Mobiliários; Western Asset Management Company Pty Ltd ABN 41 117 767 923 is the holder of the Australian Financial Services License 303160; Western Asset Management Company Pte. Ltd. Co. Reg. No. 200007692R is a holder of a Capital Markets Services License for fund management and regulated by the Monetary Authority of Singapore; Western Asset Management Company Ltd, a registered Financial Instruments Business Operator and regulated by the Financial Services Agency of Japan; and Western Asset Management Company Limited is authorised and regulated by the Financial Conduct Authority ("FCA") (FRN 145930). This communication is intended for distribution to Professional Clients only if deemed to be a financial promotion in the UK as defined by the FCA. This communication may also be intended for certain EEA countries where Western Asset has been granted permission to do so. For the current list of the approved EEA countries please contact Western Asset at +44 (0)20 7422 3000.