
Real consumer spending grew a scant 0.1% in April and maintained the same pace as seen in March, following slight declines in January and February. The January/February declines in overall spending were due to a pullback in spending on motor vehicles, but by the same token, a strong rebound in vehicle spending in March and April boosted total spending. The goods and services spending aggregates shown in Exhibit 1 exclude vehicle spending gyrations, and reveal a somewhat more stable spending story, though still demonstrate some chop.
That is, services spending has grown decently over the last two months after a mild sputter in January/February. Meanwhile, underlying goods spending did pull back in April, but on the heels of good growth in March and April.
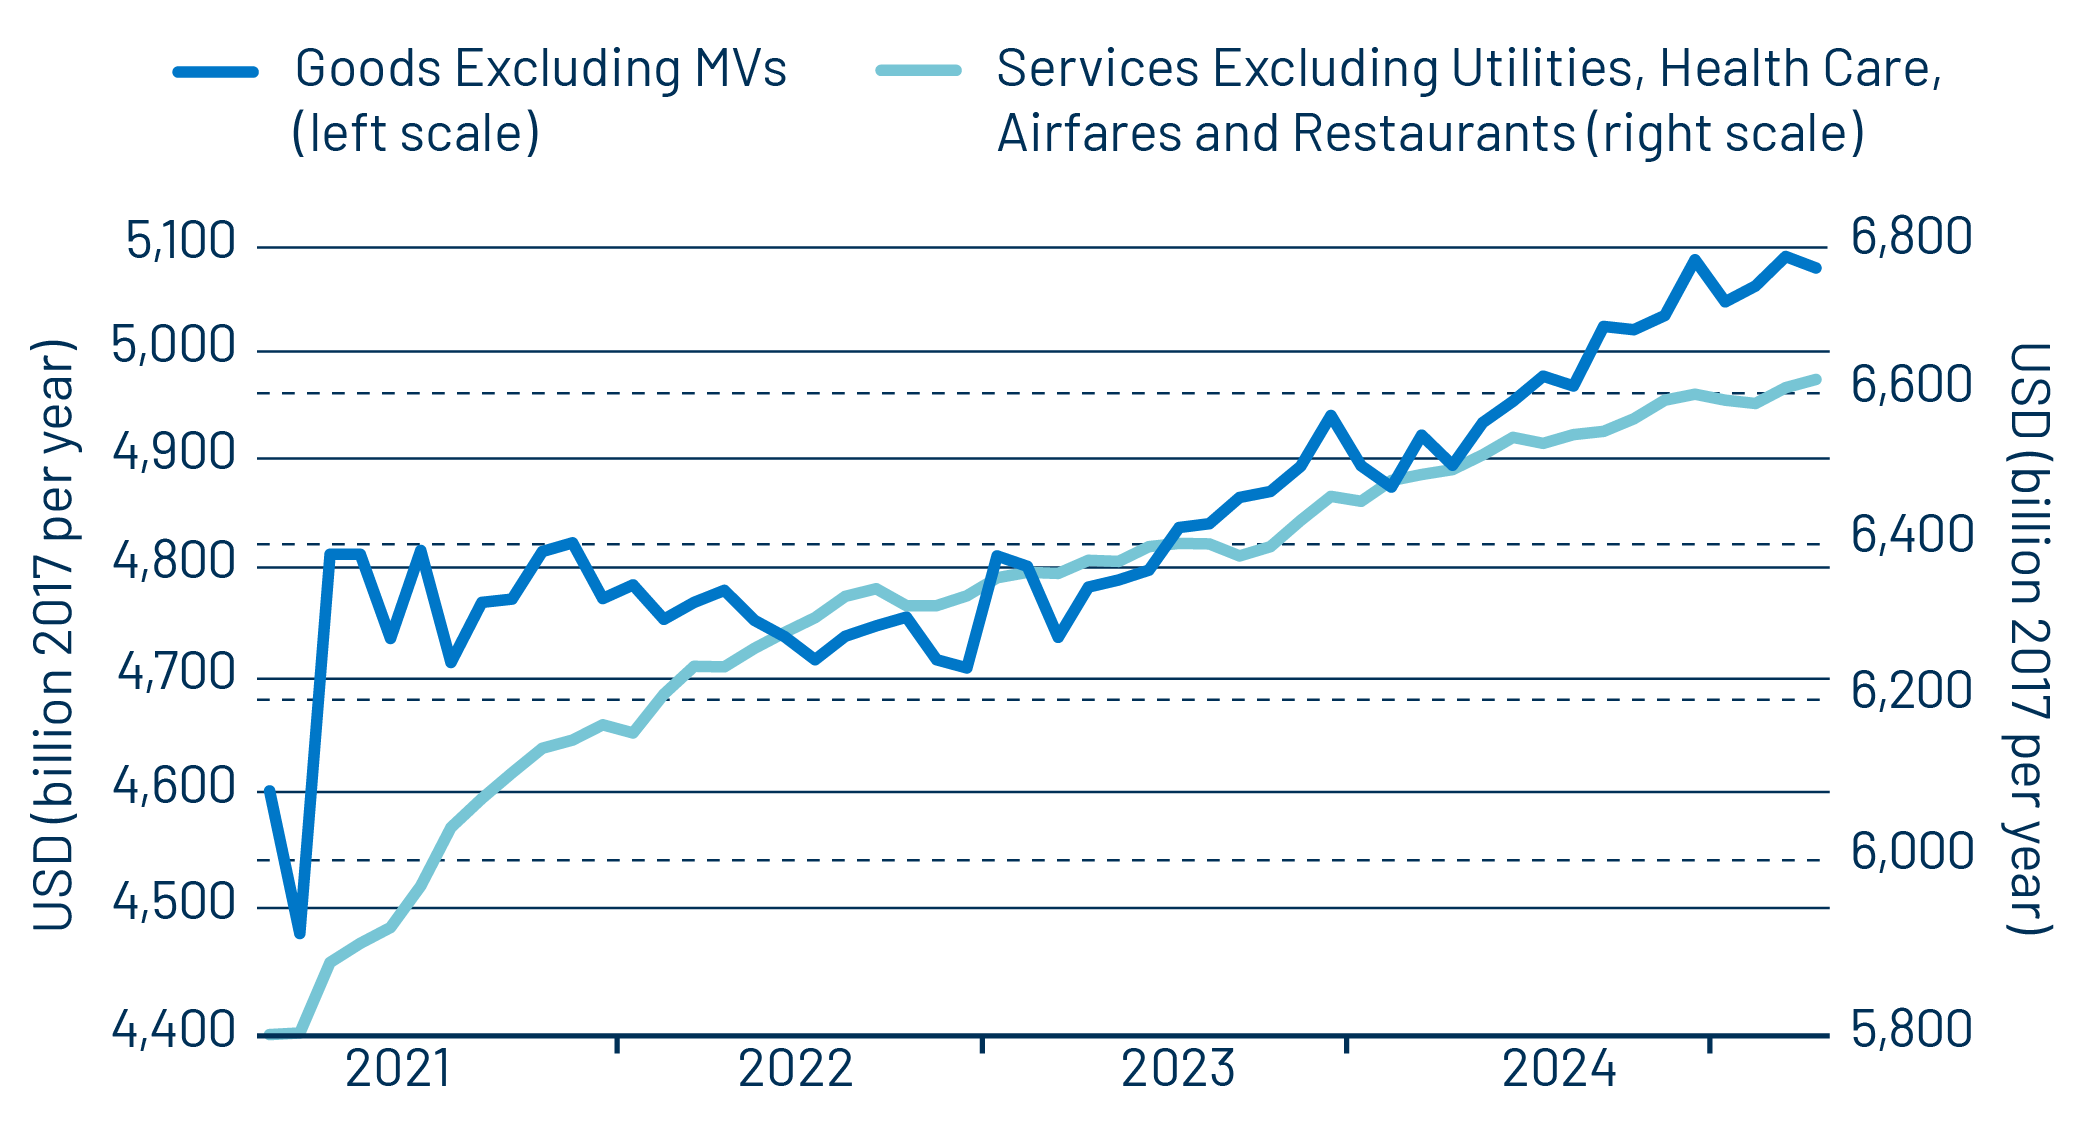
It will likely be said in the popular media that the data reflect some uneasiness by consumers in the face of tariff woes. That may be the case, but even if so, consumer behavior lately is not quite debilitated. That is, the recent goods spending softness was mostly in furniture, home electronics, jewelry and luggage. Spending on other staples has held up, and, again, spending on vehicles has been generally strong lately. (Even the January/February declines in vehicle spending merely brought them down to late-2024 levels, and March/April have been well above those levels.) Similarly, the decline in furniture spending follows very strong 2024 gains and may reflect slowing in the housing sector.
As for services, spending there has held up steadily in virtually every area except travel (fares and lodging), which has been flat for more than a year. Restaurant spending (not included in Exhibit 1) also was reported as rebounding nicely in March and April.
Meanwhile, Personal Consumption Expenditures (PCE) inflation also came in soft for April, with headline inflation at -0.1% monthly (-0.9% annualized) and core inflation at +0.1% monthly (+1.4% annualized). We also track a core measure that excludes shelter costs, due to the vagaries of measuring shelter costs. That aggregate grew at a 0.1% monthly rate (0.8% annualized).
All these rates are within Federal Reserve (Fed) tolerances, as was also the case in March. Over the past year, the core inflation measure excluding shelter has averaged 2.2% inflation, compared to the Fed’s target of 2%.
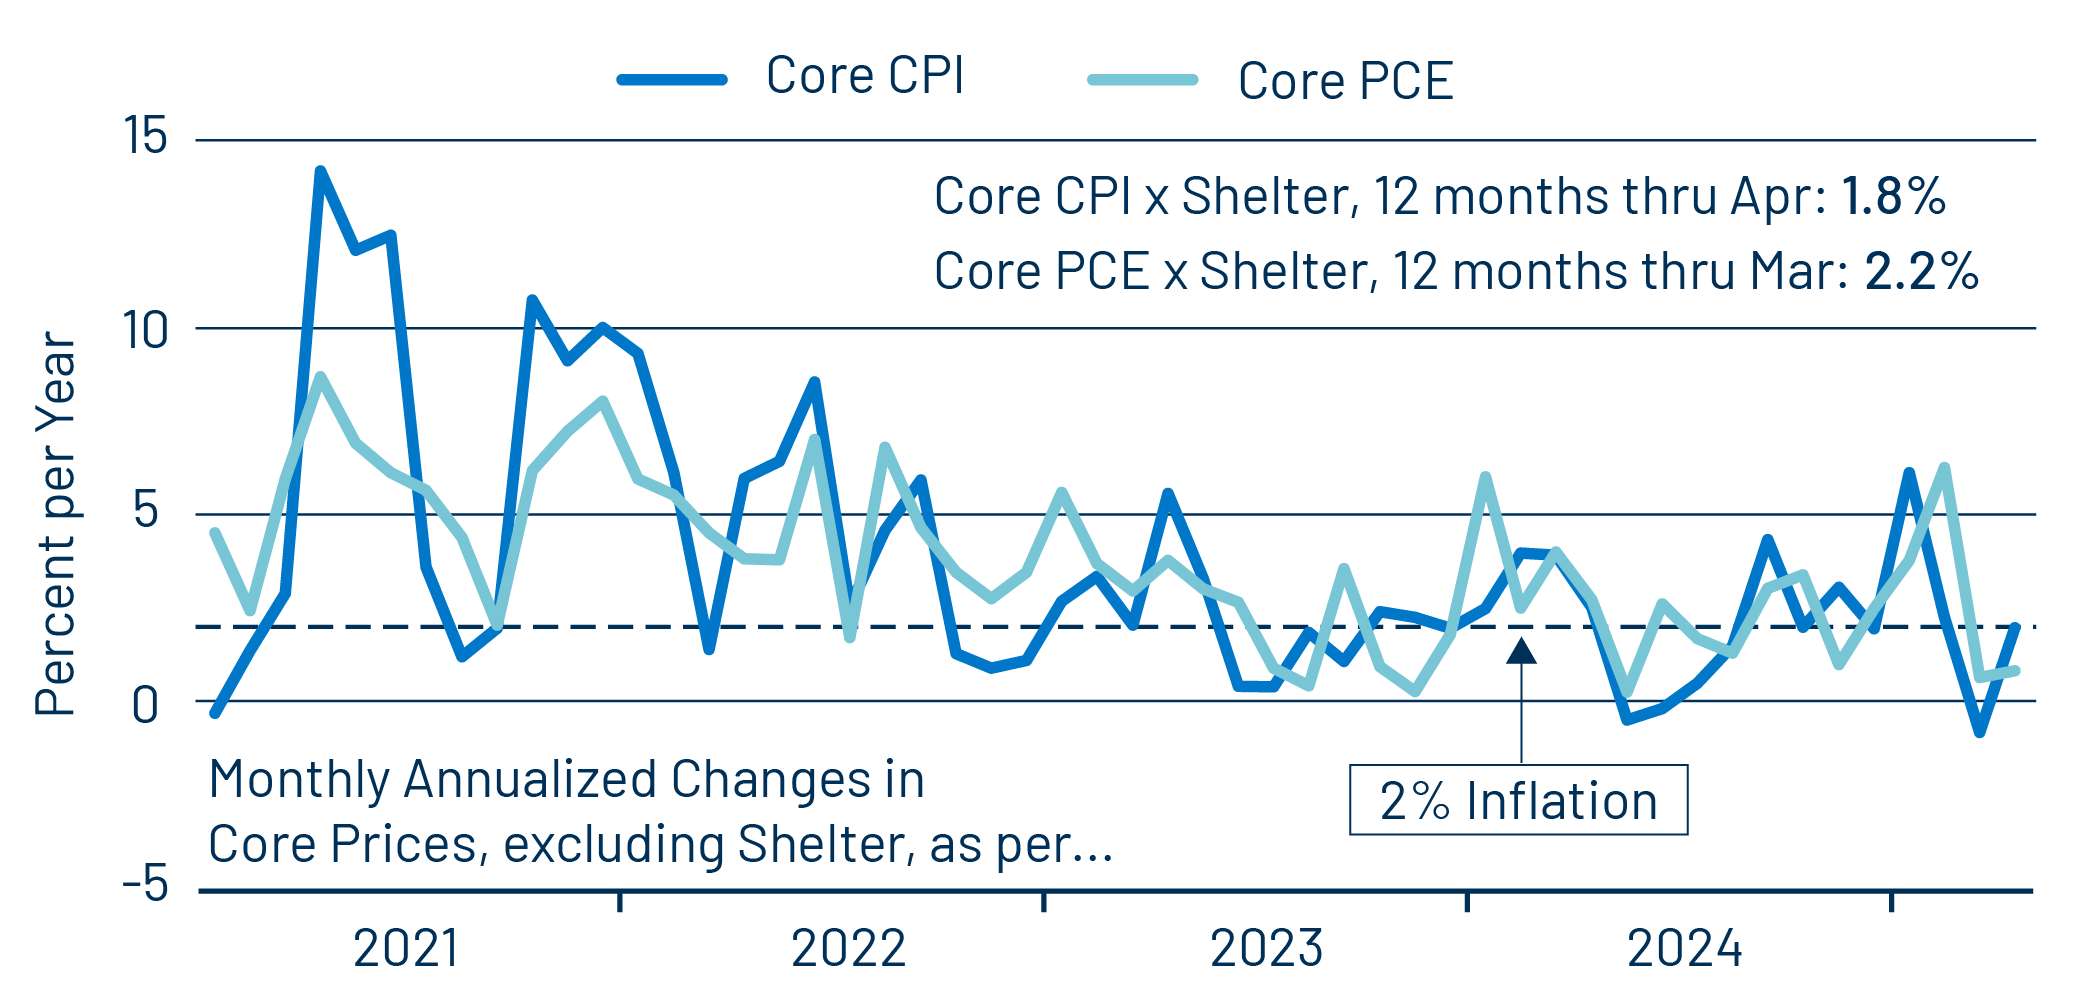
Exhibit 2 shows this inflation measure in both its Consumer Price Index (CPI) and PCE versions, the former from the Labor Department and the latter from the Commerce Department. The differences reflect different weighting and methodologies for the various components, but as you can see, those differences typically average out.
One recent development has been that while services prices have moderated sharply, goods prices have ticked higher. This is the opposite situation of what we were seeing both a year ago and in 2023, when goods prices were declining, but service inflation was sticky. It is fair to say that the recent decline in services inflation reflects the successful anti-inflation efforts of the Fed over the last three years.
It is similarly fair to say—and likely obvious—that the tick up in goods prices reflects tariff concerns. Over the last few months, the goods price increases have been centered in home furnishings, appliances, recreational goods and electronics, all items likely to be affected by tariffs. Then again, prices have declined recently for apparel, jewelry, watches and eyeglasses; also items that one would expect to be tariff-sensitive.
We don’t mean to be castigating nor dismissive with respect to possible tariff effects. The truth is that both the spending and the price swings lately have been relatively modest, and it is conceivable that there is context other than tariff considerations underlying these trends.