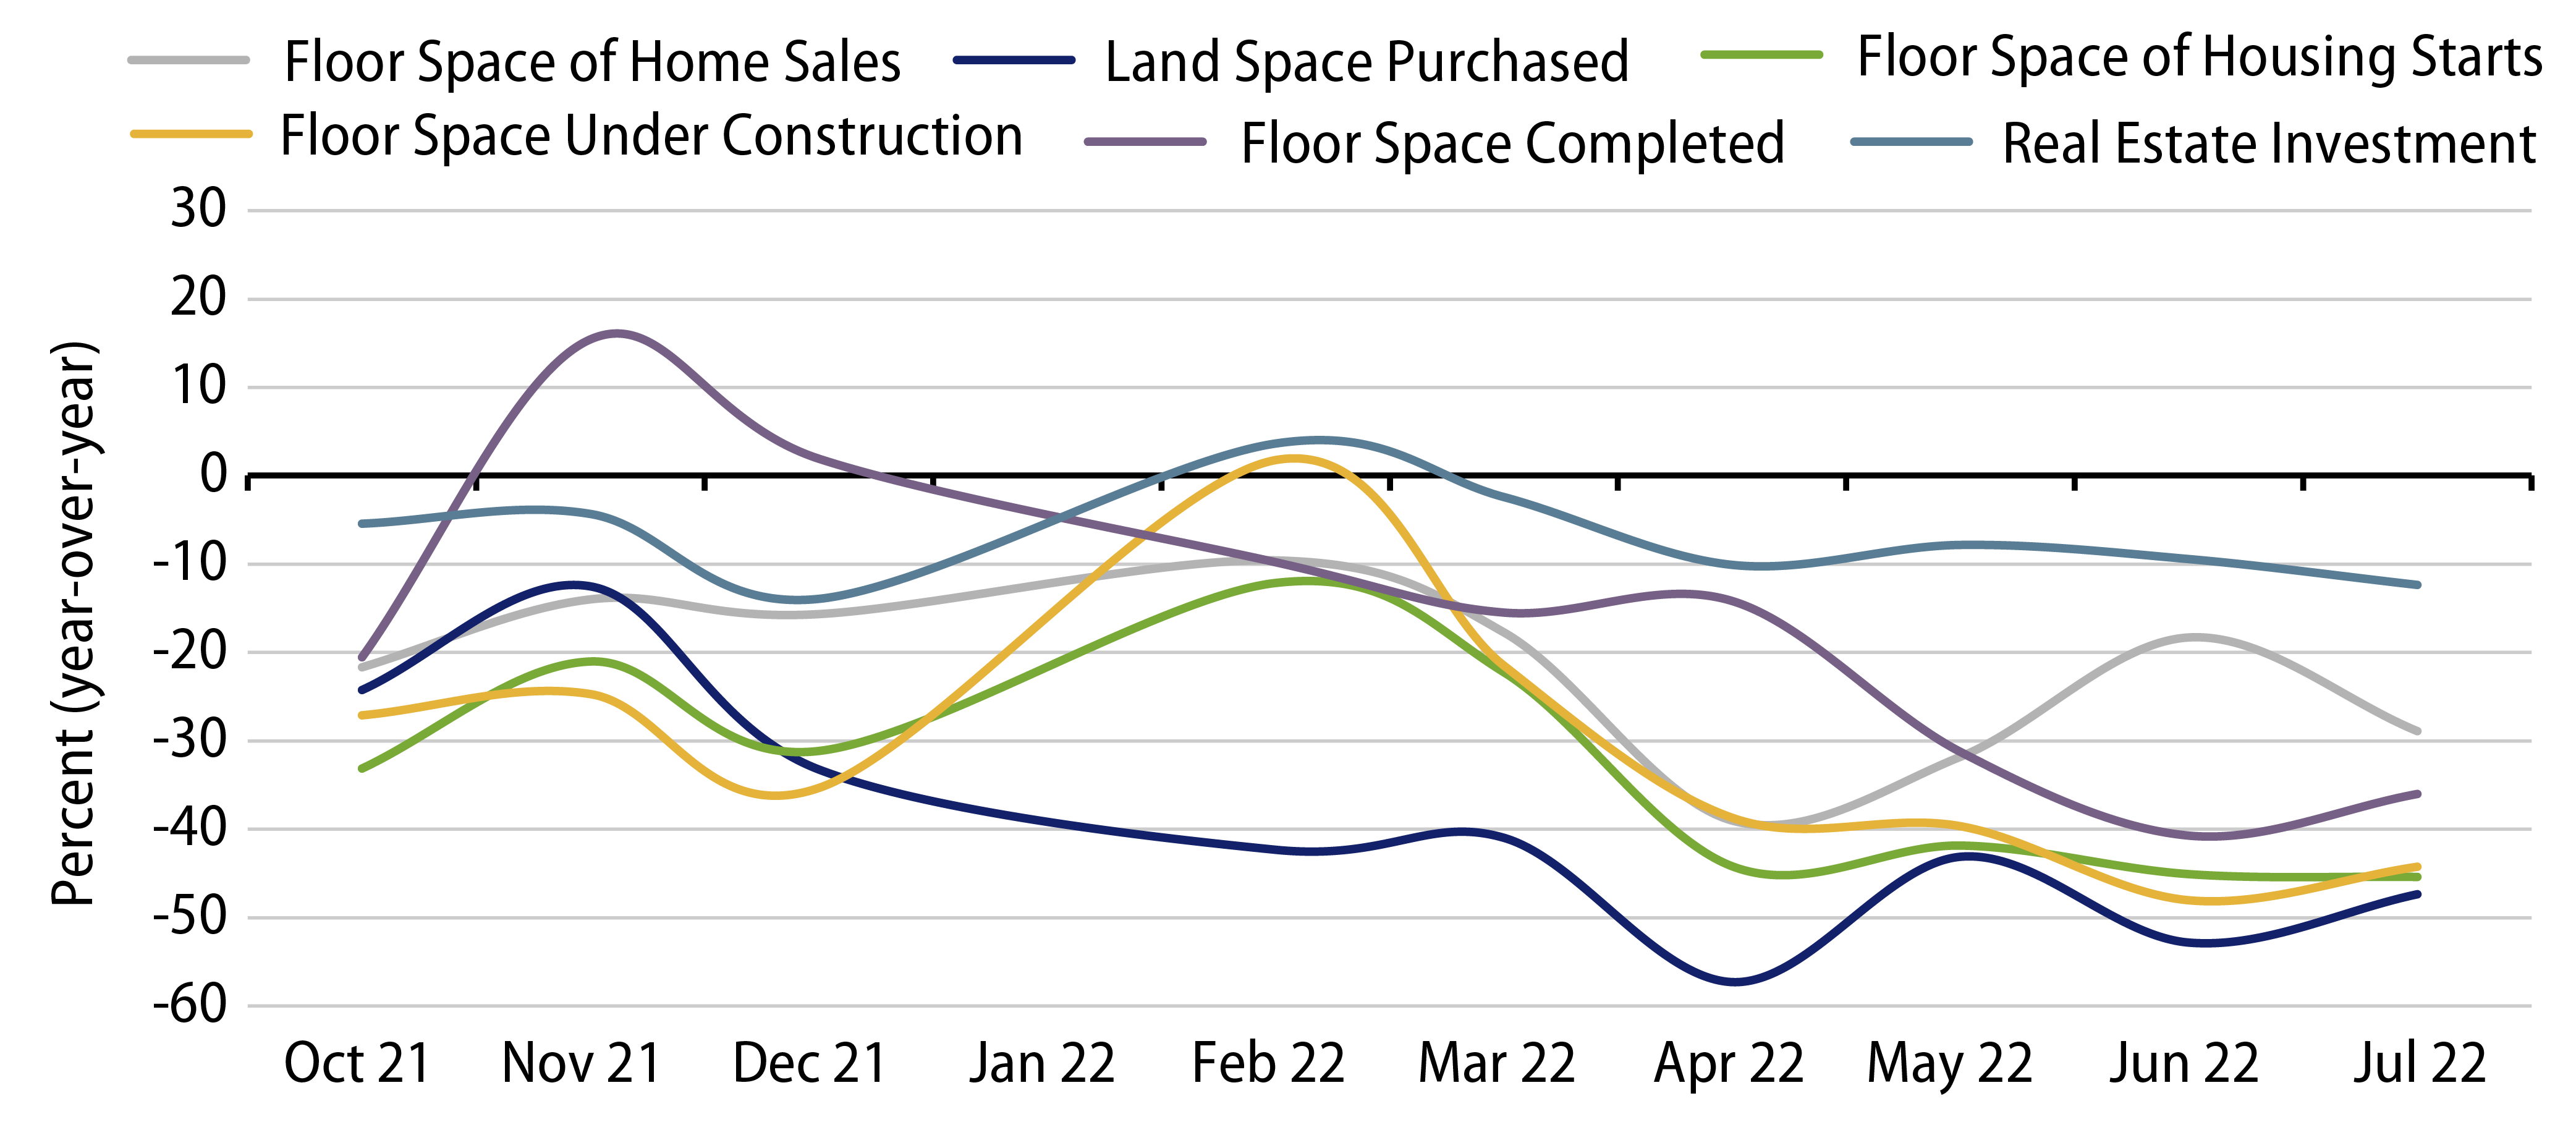
Ever since the high-profile credit woes of highly leveraged Chinese property developer Evergrande came to light in September 2021, the ensuing fallout has continued to permeate and plague the Chinese property sector with more negative developments. Here we discuss the most significant issues we see concerning China’s property market as well as the country’s Zero-Covid Policy (ZCP) and its impact on Chinese growth, the yuan and rates:
1. The Mortgage Payment Boycott on Unfinished Apartments
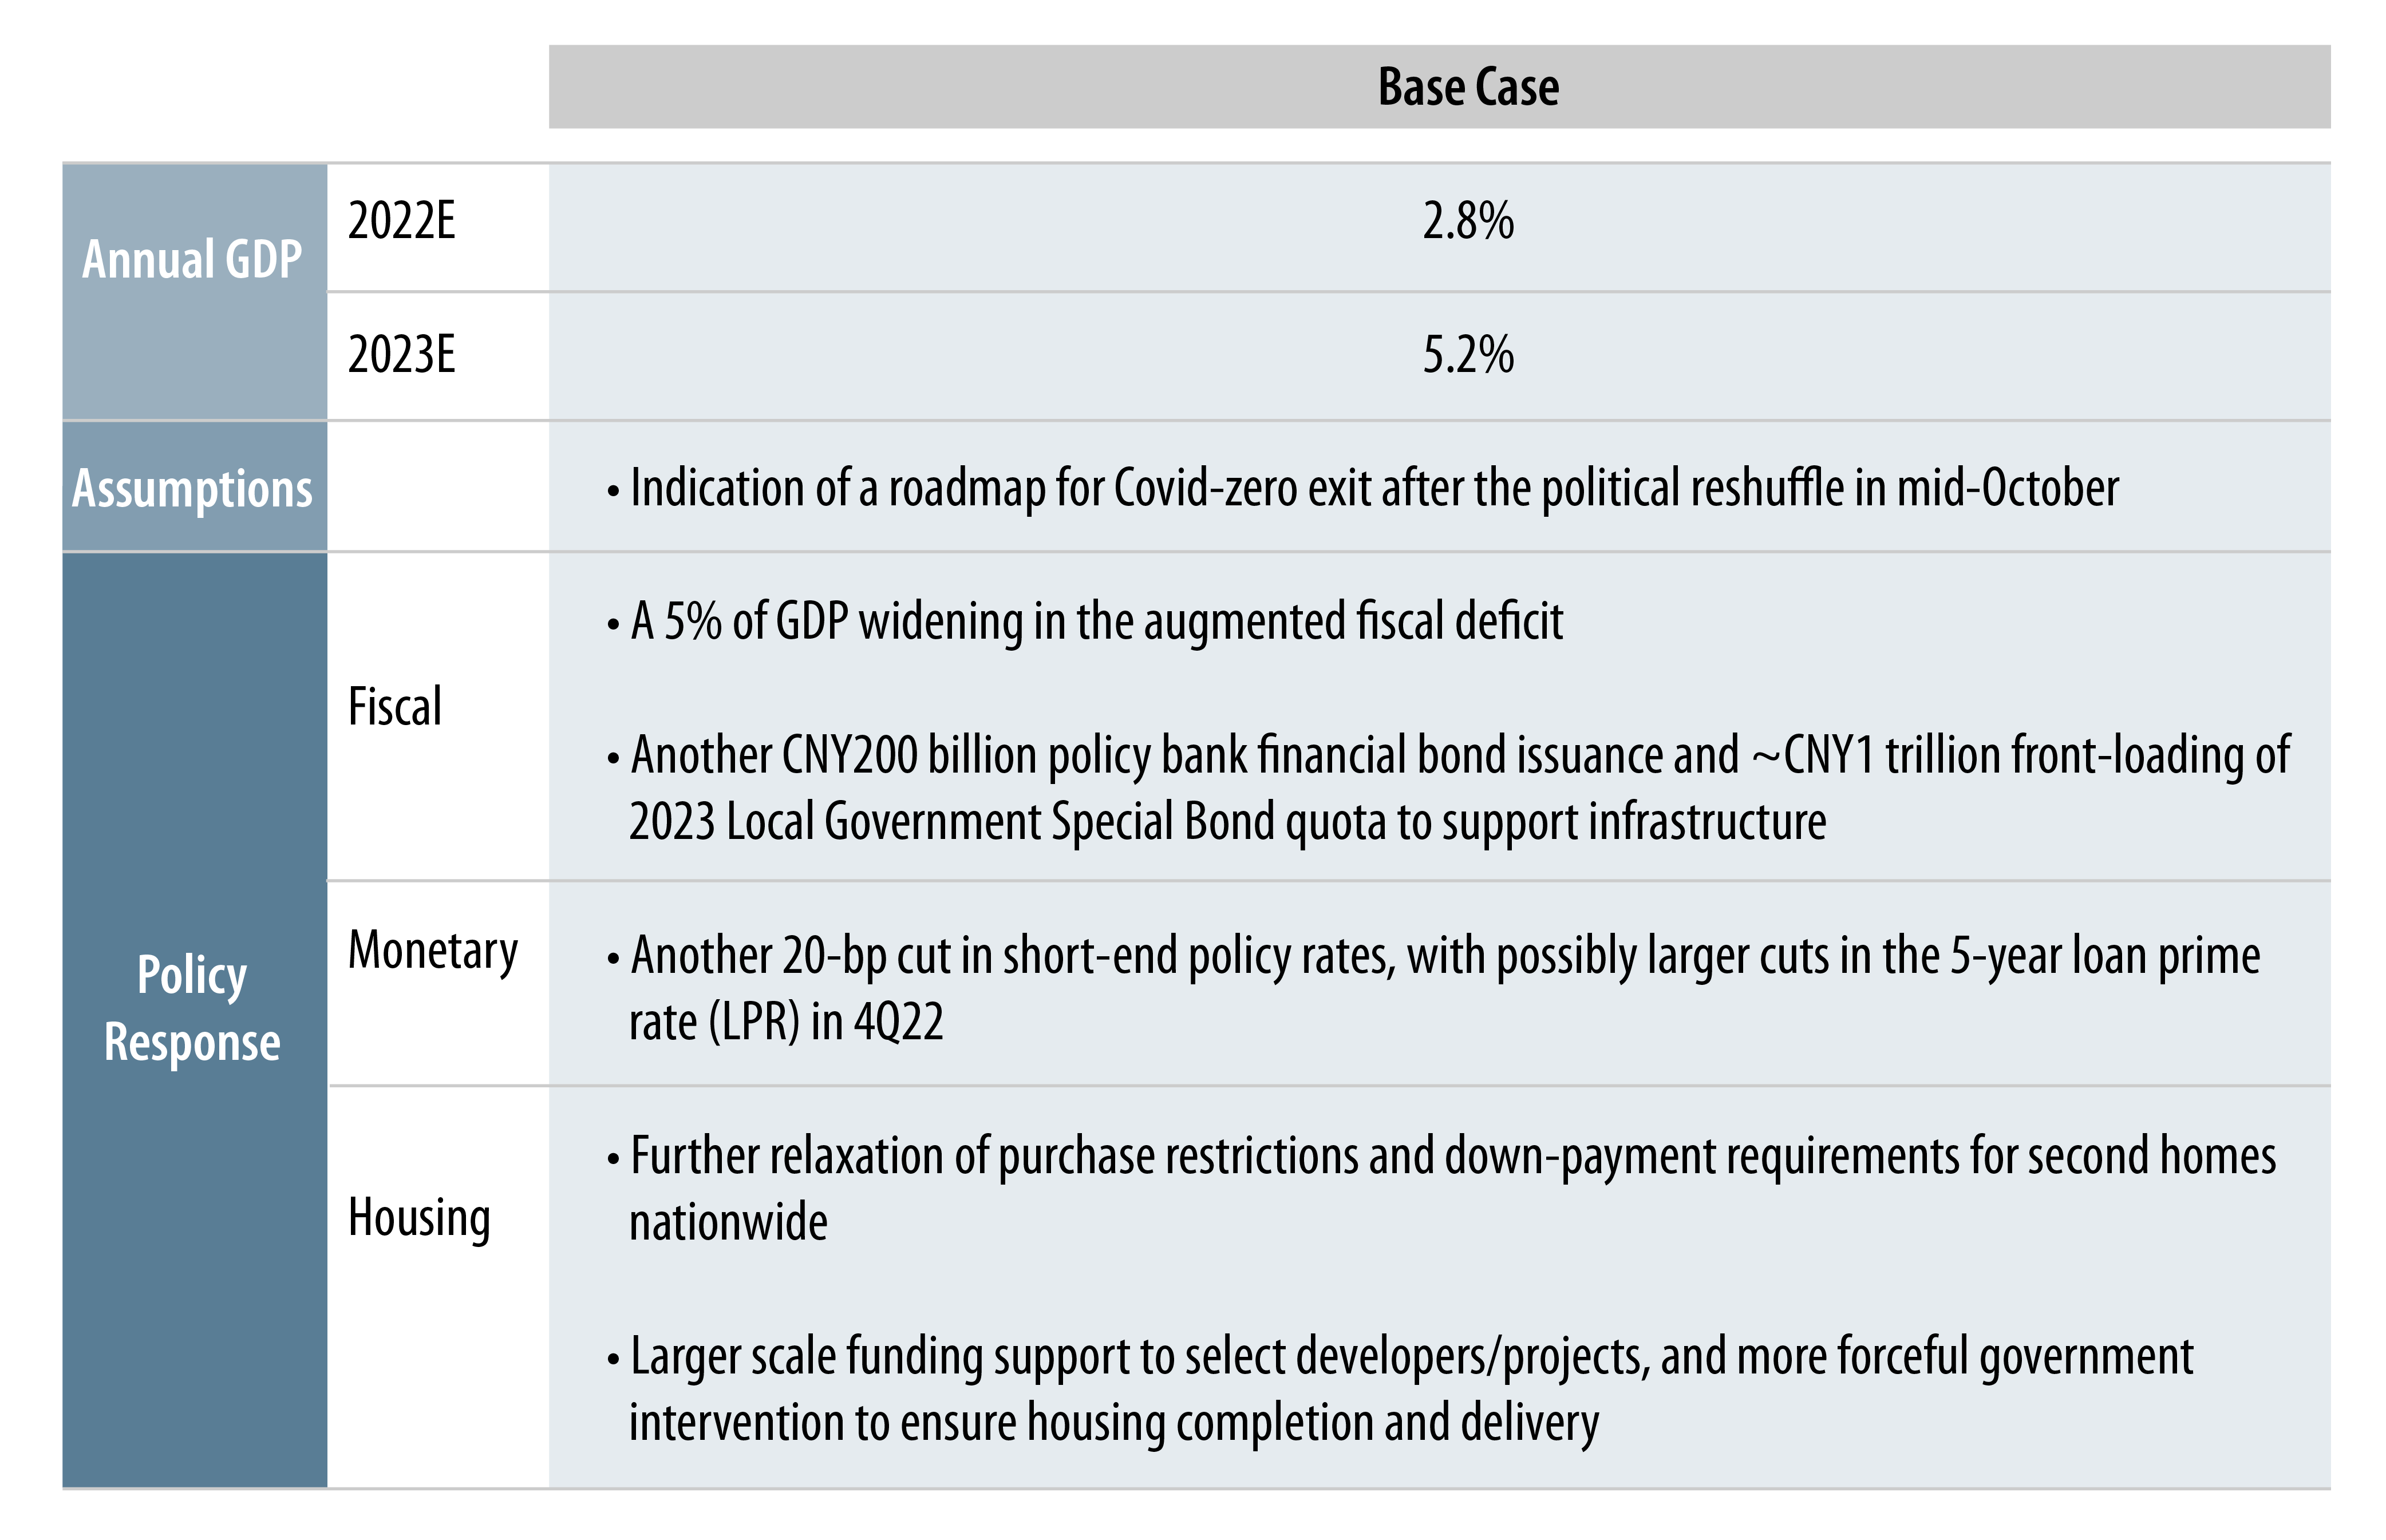
It was widely reported that Chinese homebuyers in some 300 unfinished residential projects in about 100 cities chose not to make mortgage payments, out of frustration that cash-strapped developers could not build and deliver the pre-sold homes in a timely manner. However, the mortgage boycotts of unfinished apartments constitute a modest portion of total Chinese home mortgages. Given that China’s household leverage remains healthy at approximately 60% of GDP, the recent mortgage boycott does not appear to reflect an inability-to-pay issue, but rather that homebuyers are using the widely reported boycott as a tool to pressure the authorities to step in to solve the problem. Indeed, the boycott has served as a catalyst for Chinese regulators and local governments to work out a plan to speed up the completion of the housing projects to prevent a further weakening in housing demand and potential social instability. Since the outbreak of the event, the authorities have announced a slew of swift measures, including a government onshore bond guarantee for key developers focused on project completion, special loans by policy banks to help project completion, state-owned enterprises (SOEs) taking over unfinished projects and the People’s Bank of China (PBoC) policy rate cut. In our view, if these measures are effectively implemented, it will prevent the situation from escalating.
2. The Impact on China’s Financial System—Likely to Be Contained
Total mortgage loans in China stood at CNY39 trillion (US$5.6 trillion), accounting for just under 25% of China’s total system loans of CNY165 trillion (US$24 trillion). Our analysts estimate that total mortgages with potential completion/delivery issue to be CNY1.1 trillion, which is less than 3% of China’s total mortgage loans and less than 1% of China’s total banking system loans. The amount also looks small compared to Chinese total banking assets of CNY358 trillion as of 1Q22. In a distressed scenario, assuming most of the risky mortgages default, the impact to Chinese bank’s non-performing loan (NPL) ratio would be contained. Currently, China’s banking system NPL ratio is relatively low at 1.7%. Furthermore, China’s banking system’s high provision coverage ratio of over 200% and about CNY6 trillion in risk buffers would provide decent room to absorb property credit losses. On average, mortgages in China have a 40% home owner equity and banks have full recourse on the borrower’s assets for the any loan default. Hence, we do not expect elevated systemic risk in the Chinese banking system arising from the deteriorating mortgage loans.
3. Infrastructural Spending—Unlikely to Fully Offset the Property Woes
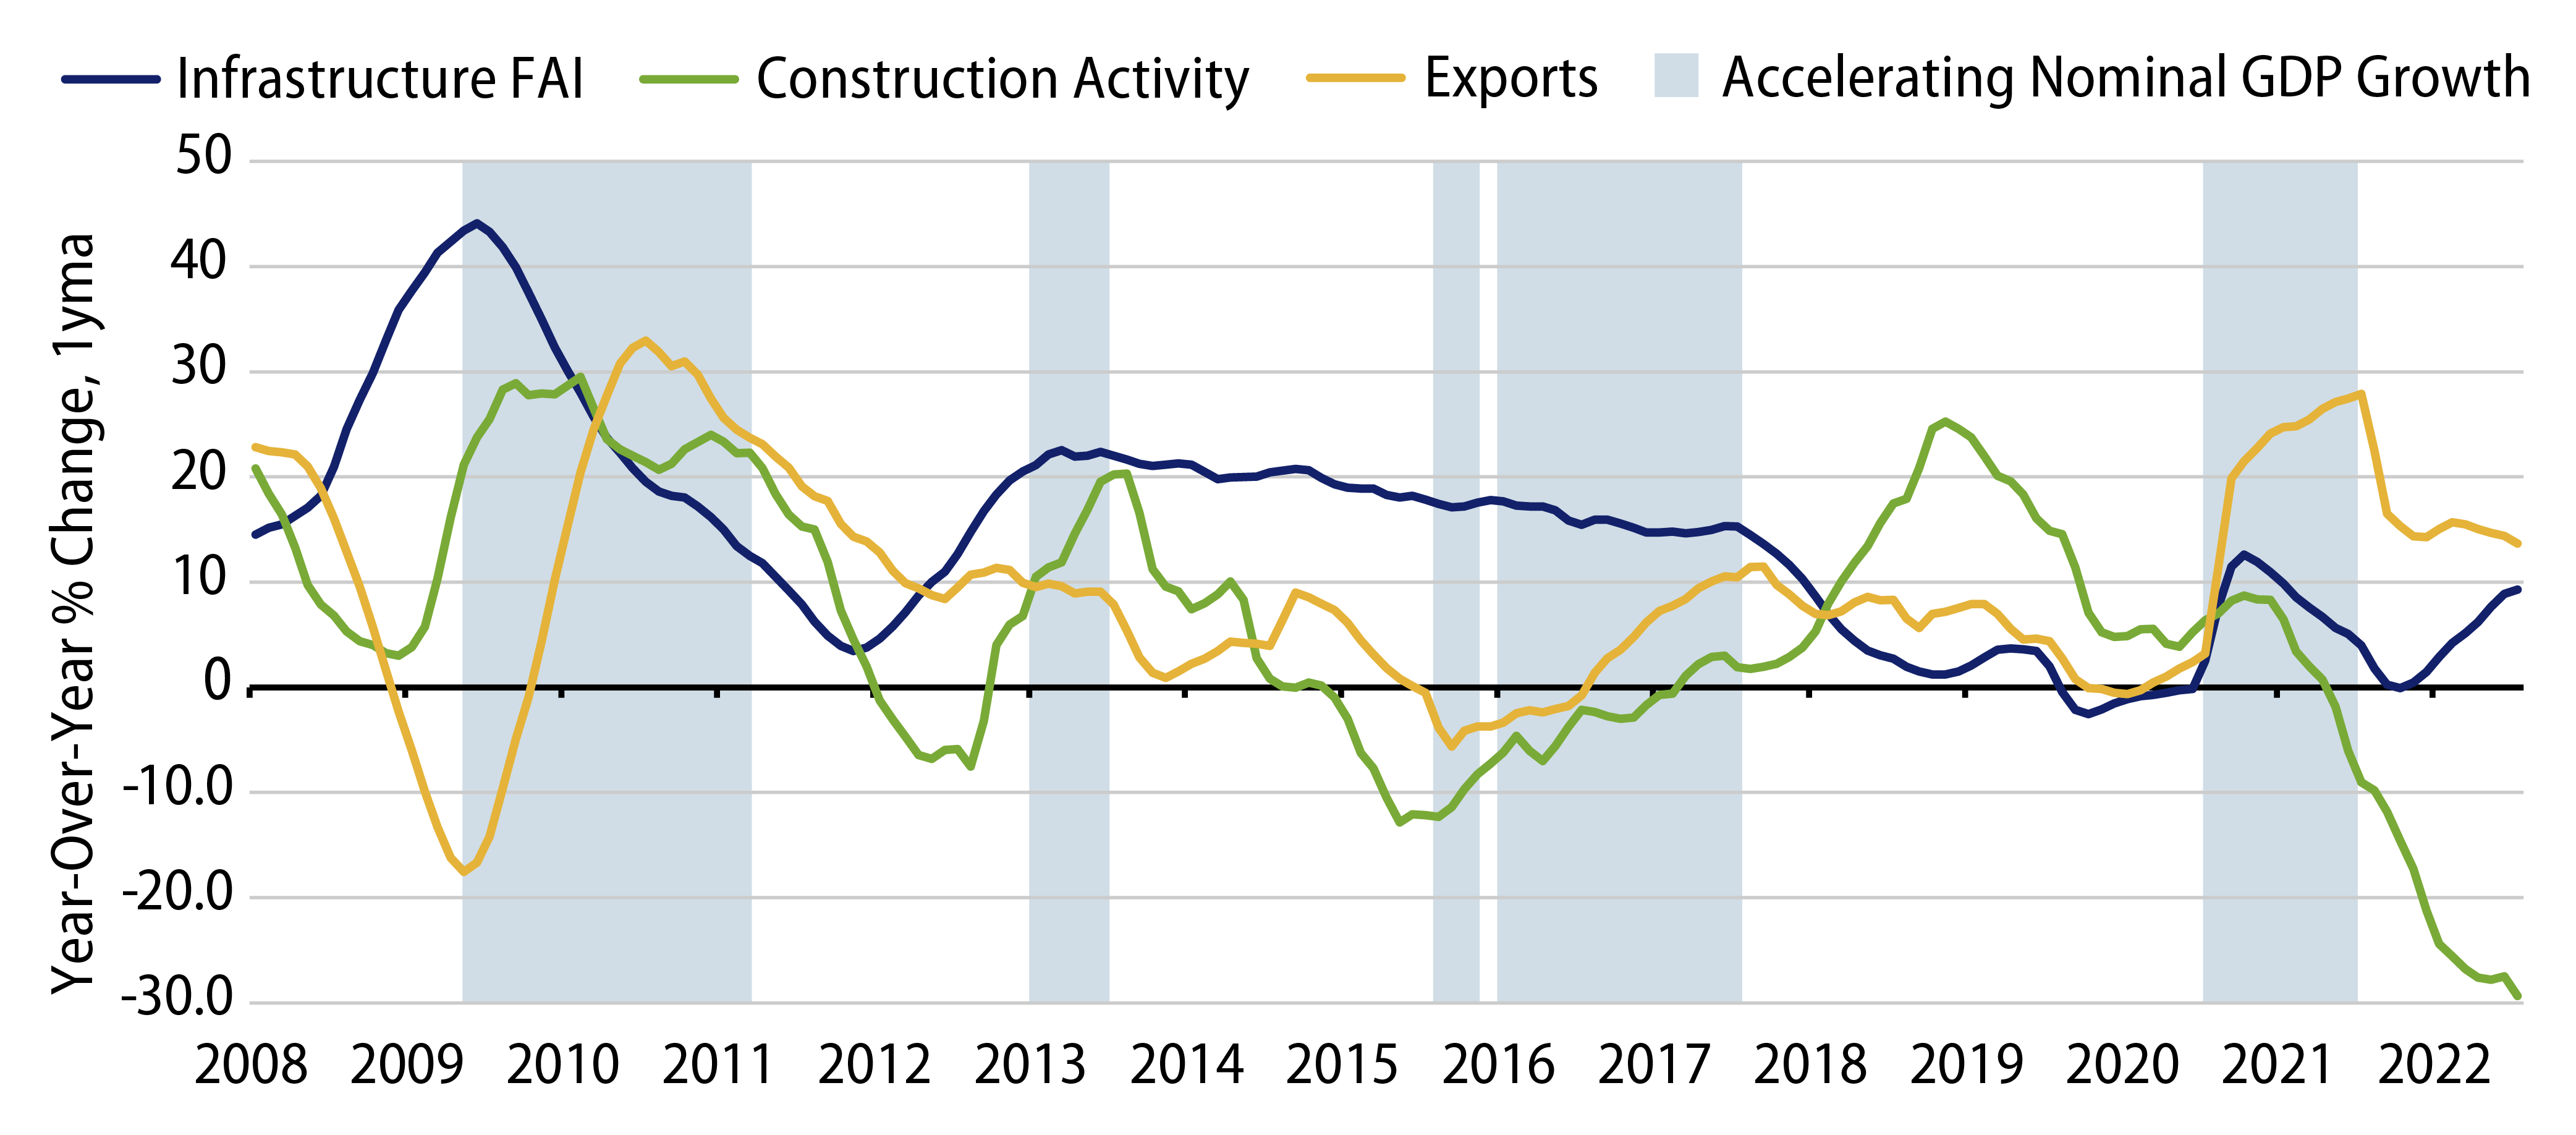
As China faces a historic property downturn and sluggish consumer spending, its government is relying heavily on public-sector infrastructure investment to stabilize growth. This toolkit is hardly new: infrastructure has been a regular countercyclical tool for China since the response to the global financial crisis of 2008. This time around, the government started to ramp up infrastructure stimulus in late-2021 as the property downturn hit, urging local governments to quickly spend the proceeds raised through special bond sales. In 2022, China doubled down on infrastructure, adding new sources of funding via Chinese policy banks and extending special bond issuance quota for state-owned railway, aviation and power companies. But the efficacy of infrastructure spending is often overrated. Our view is that unless and until the government can stabilize and regain the Chinese homebuyer’s confidence in the property market, growth could continue to grind lower despite the huge public-works support. In the historical example of Japan in the late-1980s, years of massive infrastructural spending following the busting of the property bubble was not enough to turn around the growth slowing cycle. The likelihood of infrastructure spending being sufficient to turn around China’s business cycle without support from either the property market or external demand is low.
4. The Impact of China’s Zero-Covid Policy (ZCP) on Growth
Unlike the rest of the world, China continues to pursue a zero-Covid policy (ZCP), out of key considerations such as the low booster vaccination rate among seniors and fear of a resurgence of cases and potential strain to the country’s medical resources in the event of a full-blown Covid outbreak. More importantly, from the political perspective, the Chinese Communist Party will hold its 20th Party Congress in October 2022 that will see a once-in-a-decade leadership reshuffle in which President Xi is widely expected to win an unprecedented third term. Leading up to the all-important Party Congress, maintaining social stability and safeguarding public health are of utmost priority. As a result, Chinese leaders seeking another term will likely play it safe by sticking to the status quo, as a deviation from the existing strategy could increase undesirable risks. ZCP undoubtedly has put downward pressure on Chinese growth given the draconian measures and recurrent lockdowns. Disruption to mobility has also severely impacted business and household spending and sentiment. While no official Covid exit roadmap has been announced, the base case is that China will likely look to relax the ZCP after the 20th Party Congress concludes in October. By then, the political reshuffle would be complete and we also expect the booster rate for elders (currently ~67%) to improve.
5. The Implications of a Slowing Economy on the Yuan
Despite the slowing economy and PBoC’s diverging monetary policy with the US, we expect the Chinese yuan foreign exchange (FX) rate to remain resilient following the “catch-up” depreciation seen in mid-April to mid-May.
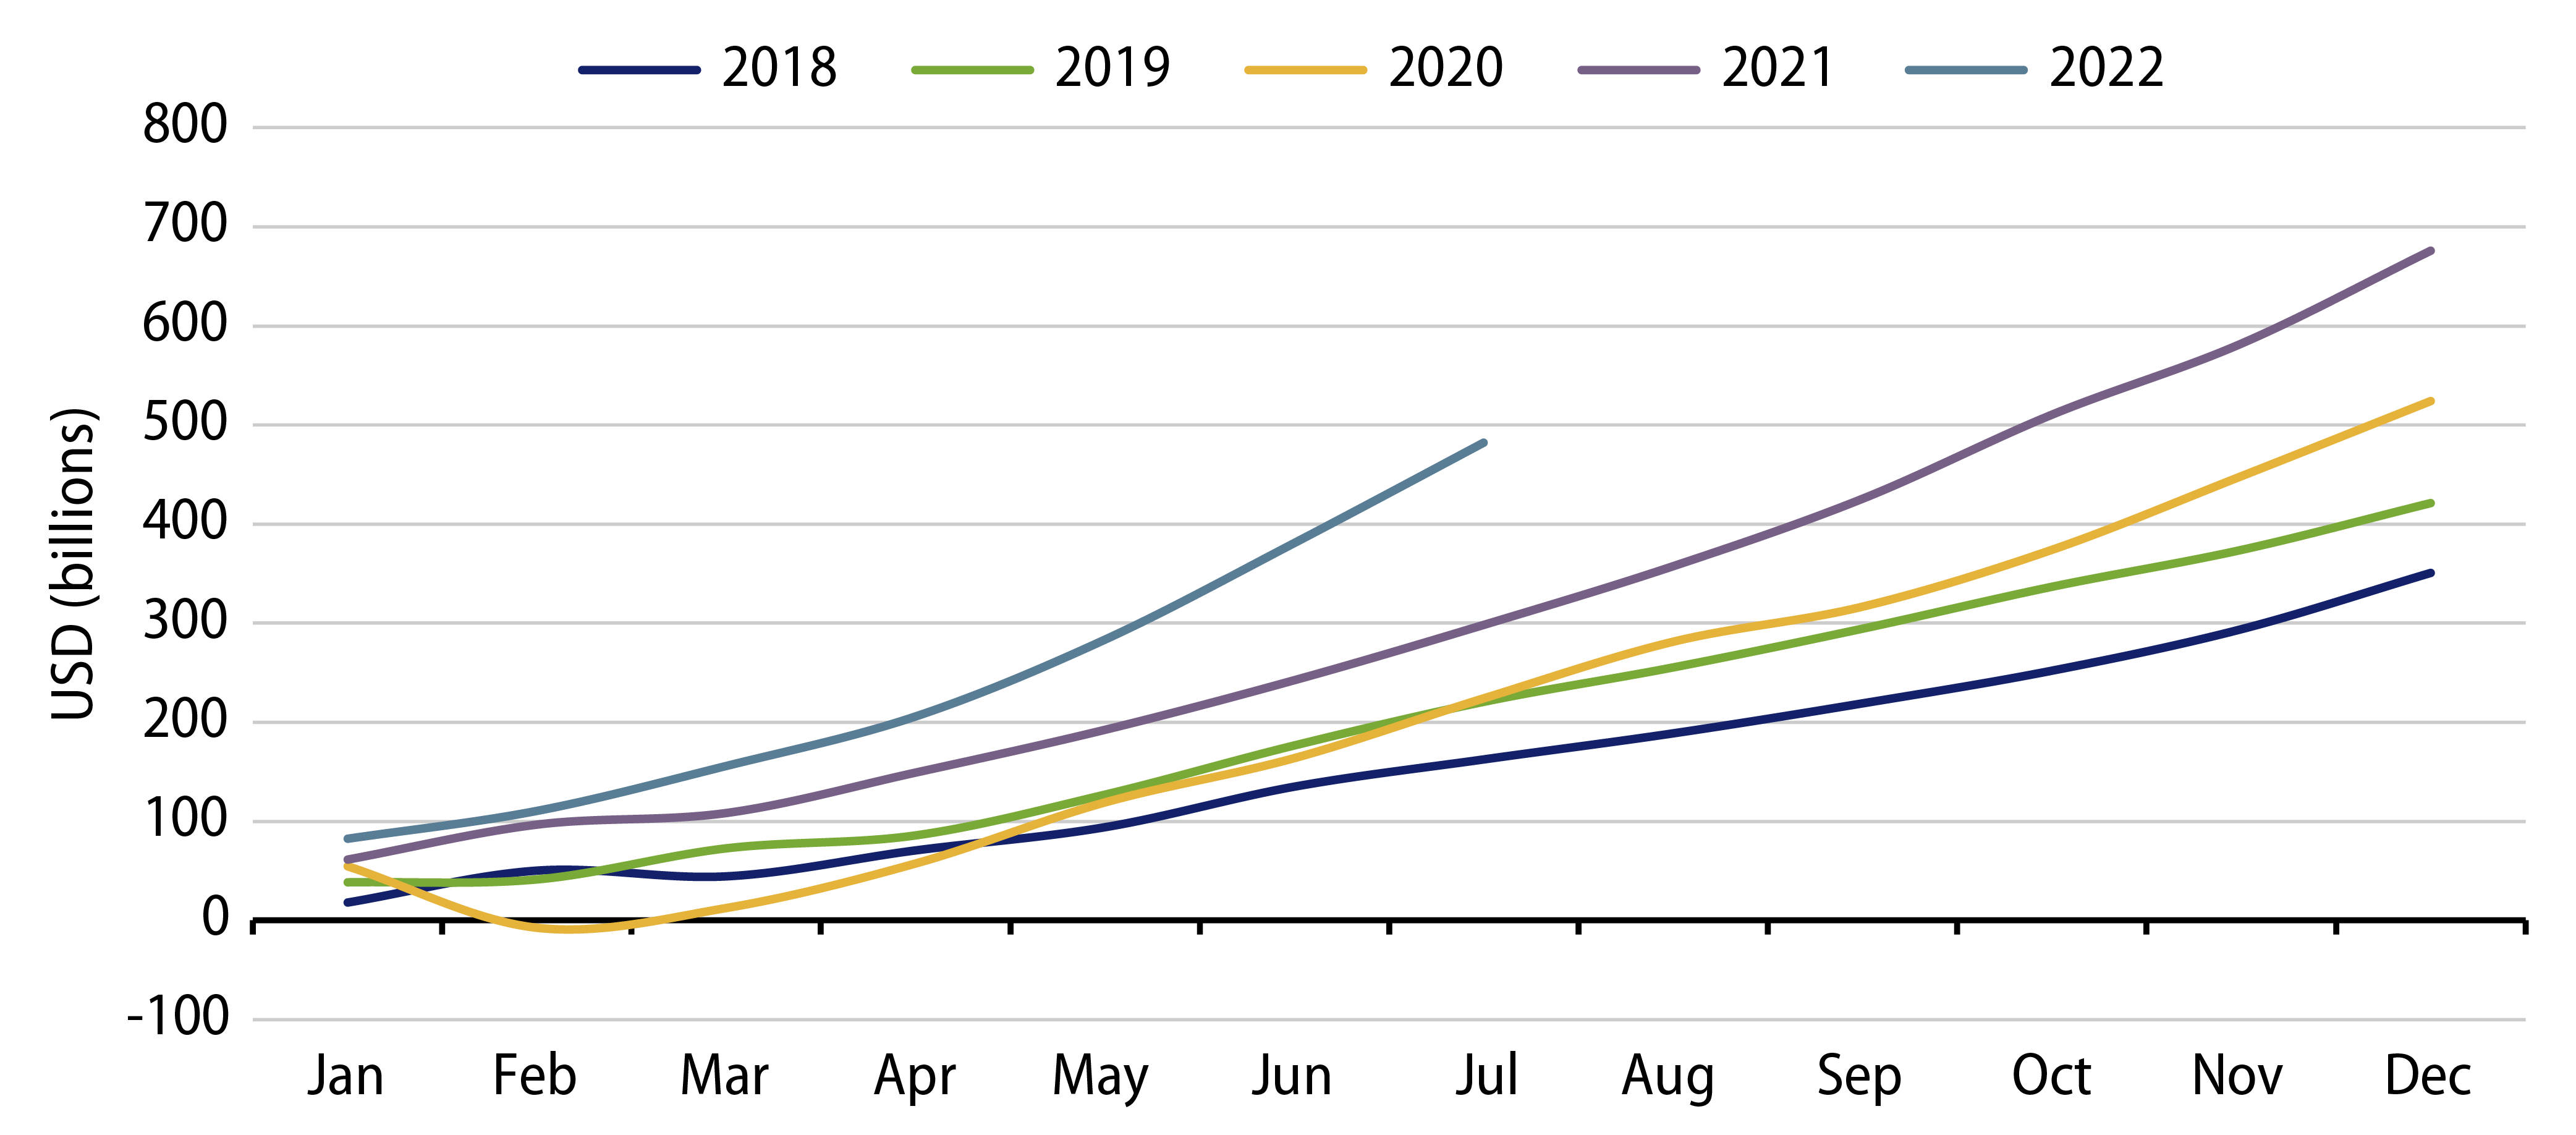
First, China’s trade surplus remains strong and should remain as key support for the Chinese yuan (CNY). The trade surplus rose by 59% to a new high in the first seven months of 2022 (Exhibit 4) as a result of strong exports and sluggish imports due to weak local demand.
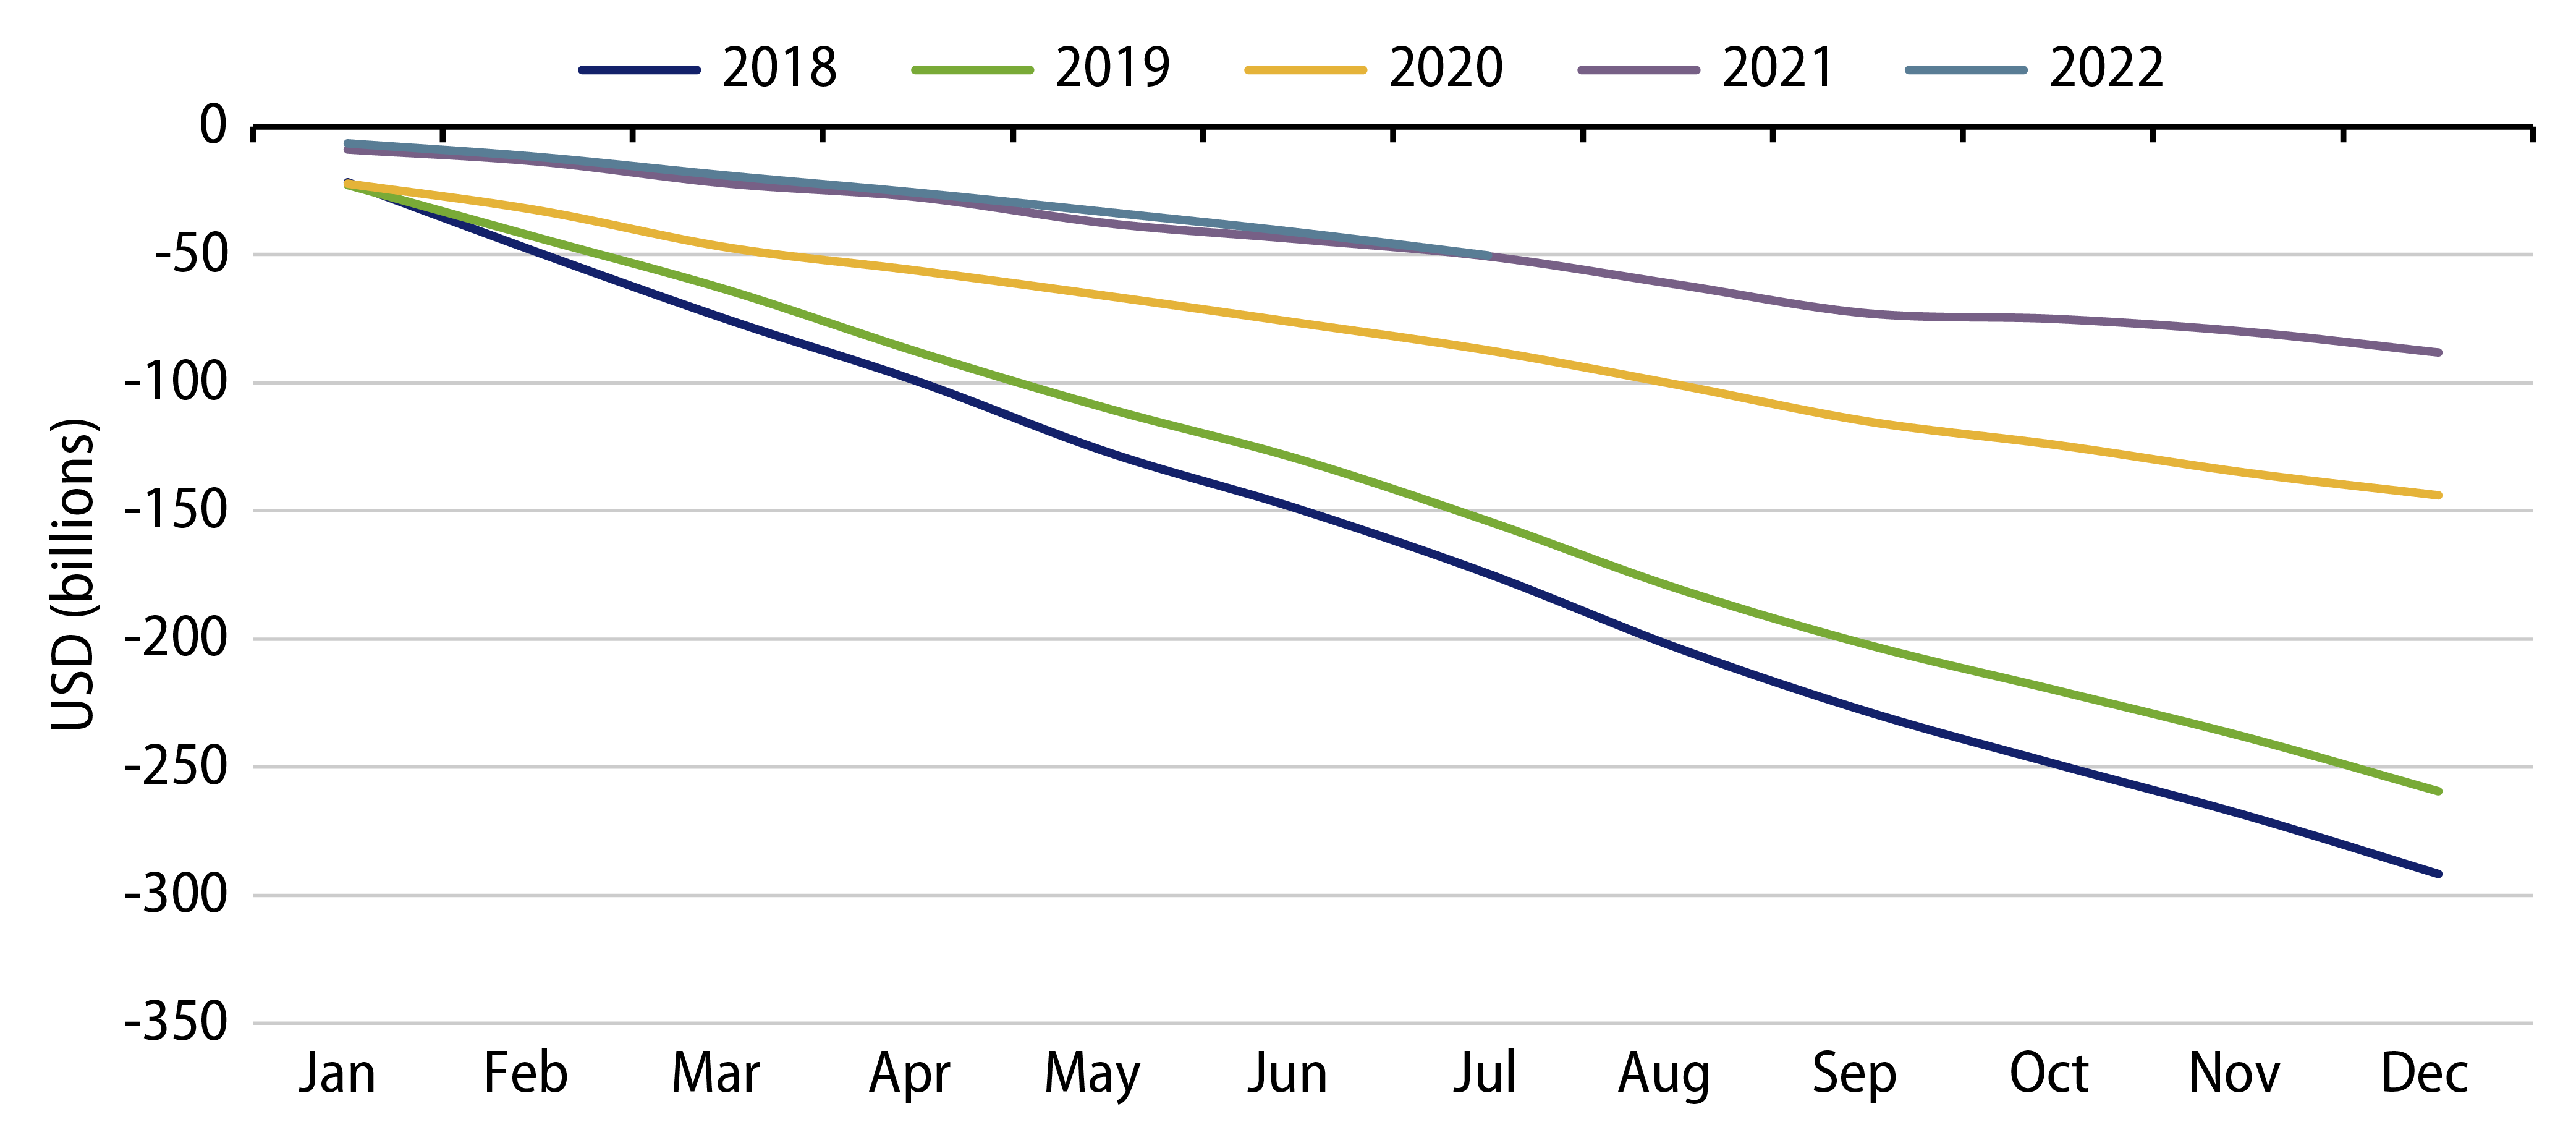
Second, China’s services deficit continued to narrow (Exhibit 5). International travel, a traditional conduit for capital outflows and offshore M&A activities, has virtually ceased since the onset of the pandemic. While our base case is that Chinese authorities will materially lift/reduce Covid restrictions post the National Party Congress, strict border controls that prevent Chinese money and high net worth citizens from leaving the mainland are likely to persist for a much longer period. This, coupled with the robust trade balance, will largely cushion outflows.
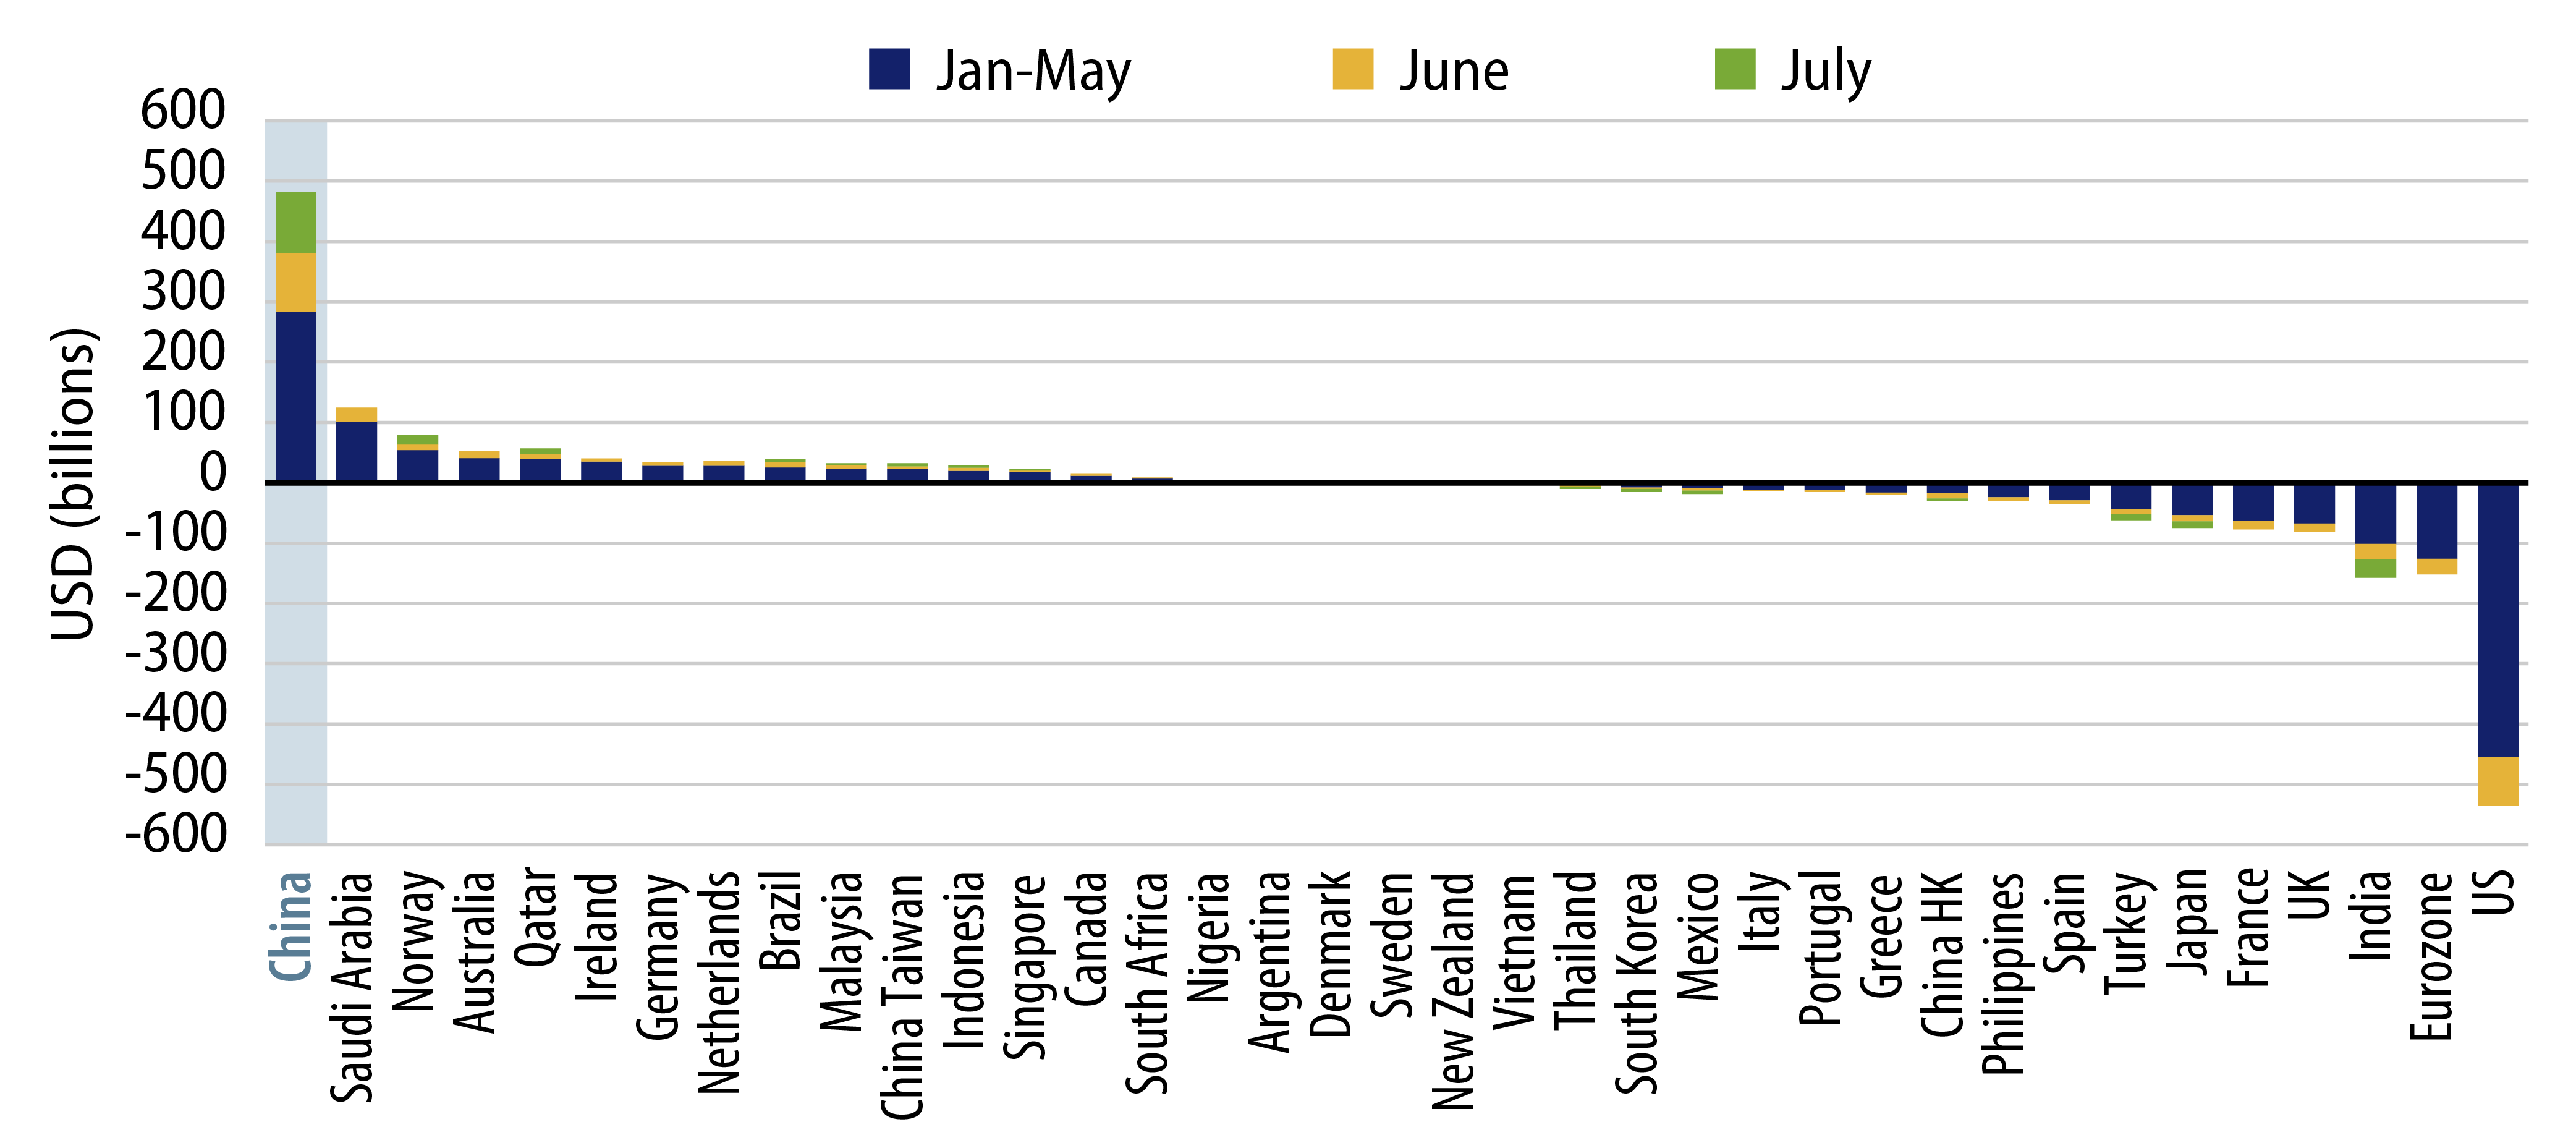
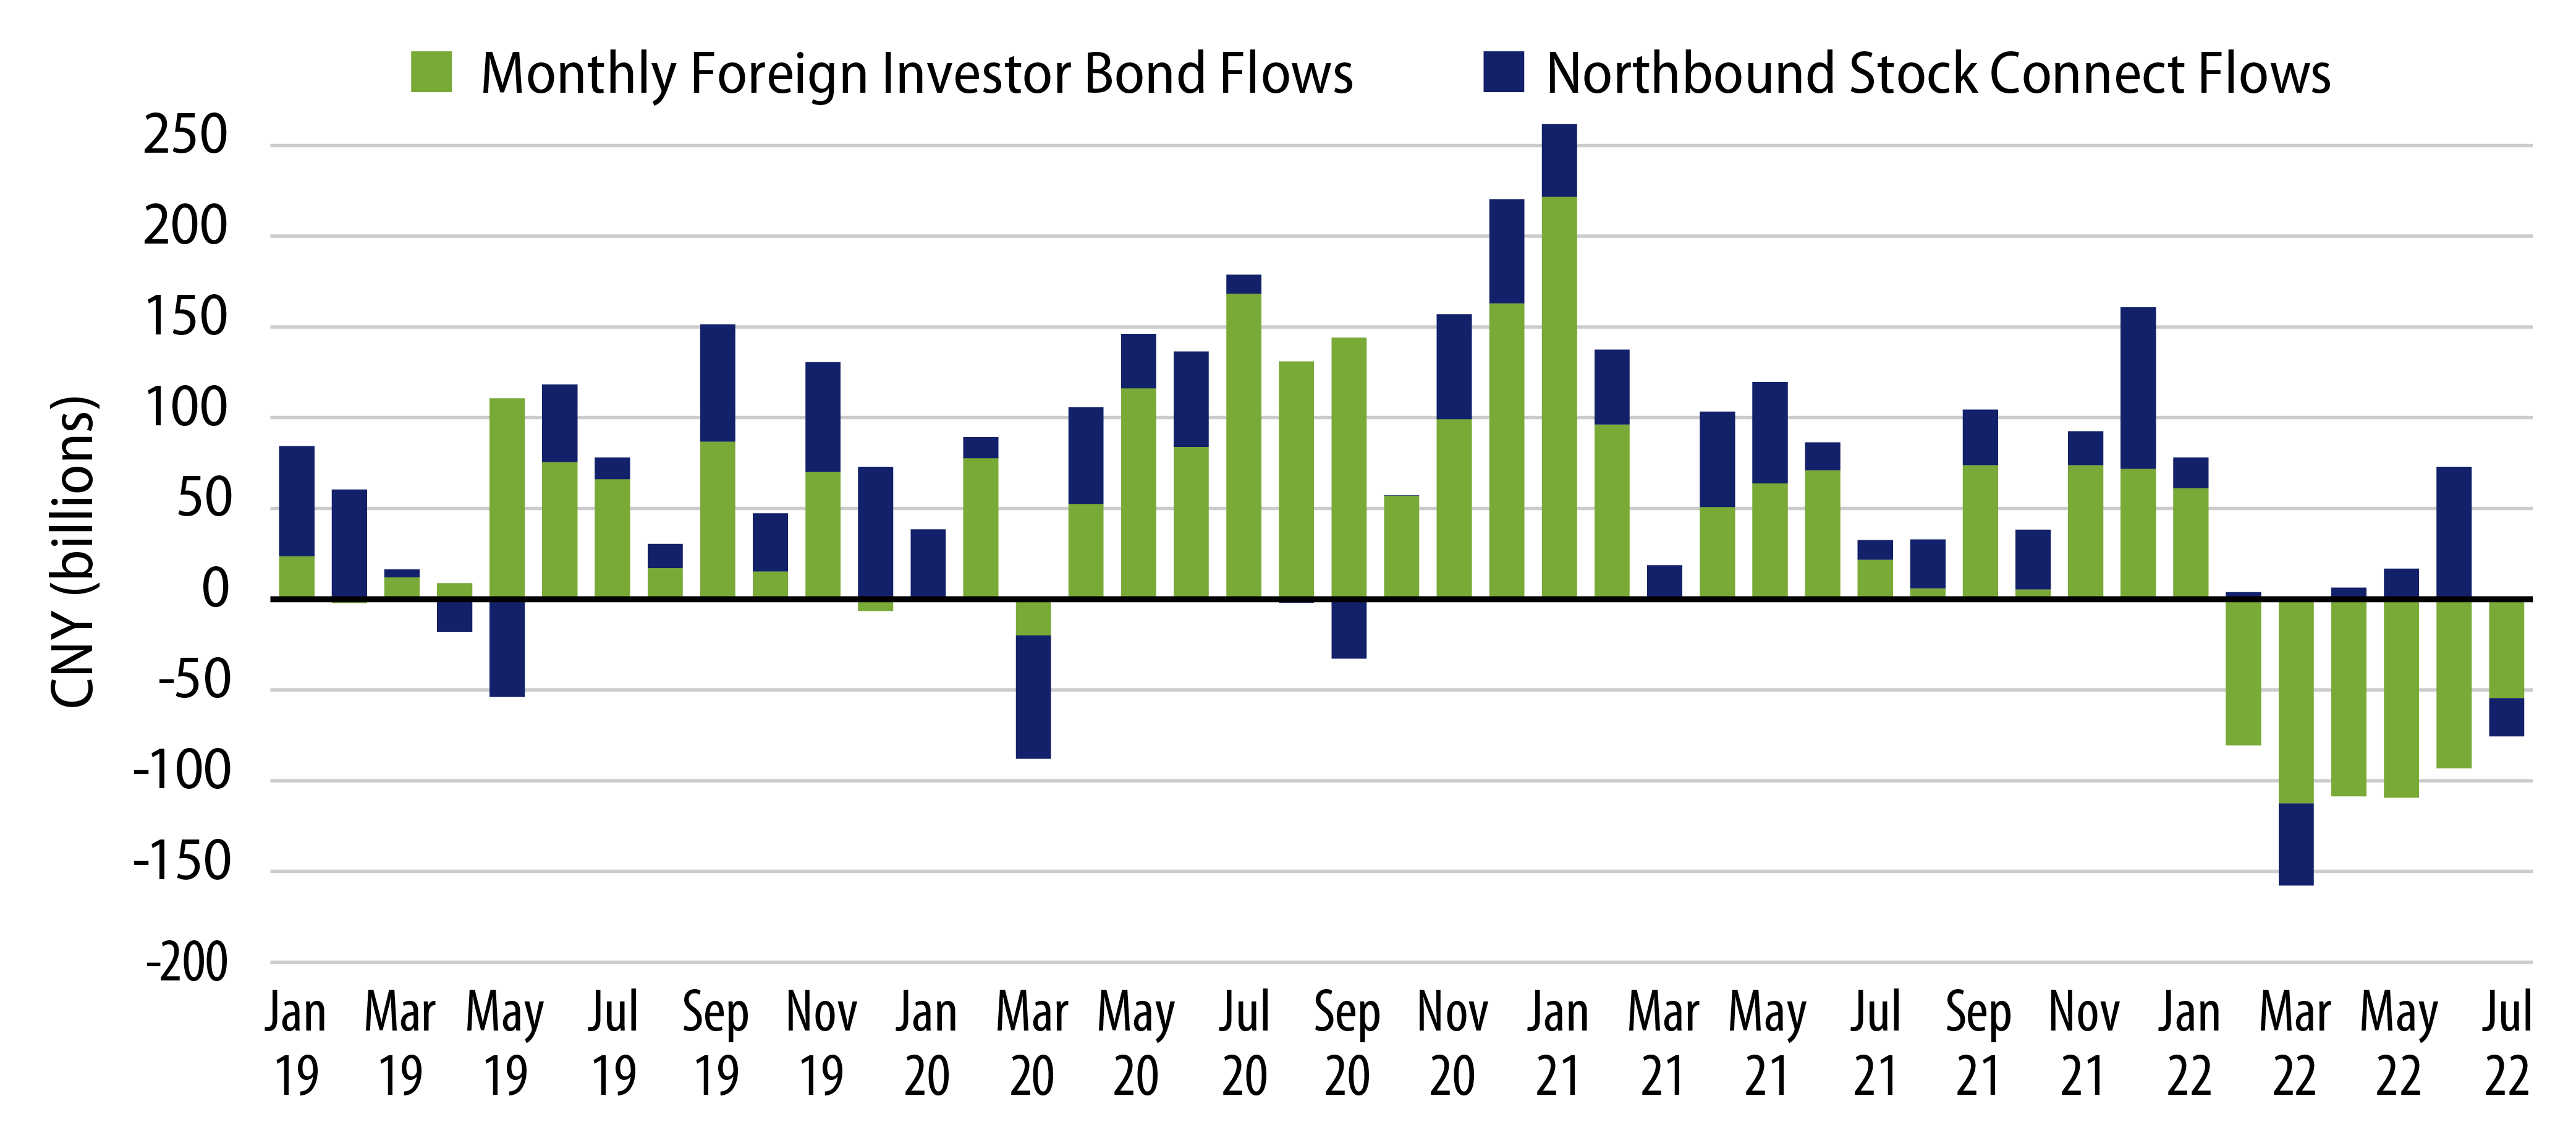
Foreigners have divested from the Chinese bond market in the aftermath of the Russia Ukraine war. This is mainly due to profit-taking as Chinese government bonds (CGBs) have had positive returns and concerns over secondary sanctions due to China’s purchase of sanctioned Russian energy. But the latest monthly data suggested that portfolio outflow pressure has subsided, with equity inflows returned in June while bond outflows declined (Exhibit 7).
In addition, with little foreign currency loan demand, the stock of US dollar deposits held by exporters and corporates in China’s onshore banking system continued to stay at an elevated level of about US$1 trillion—which puts a cap to the upside for US dollar versus the Chinese yuan.
6. The Implications of a Slowing Economy on Chinese Government Bond (CGB) and Interest Rates
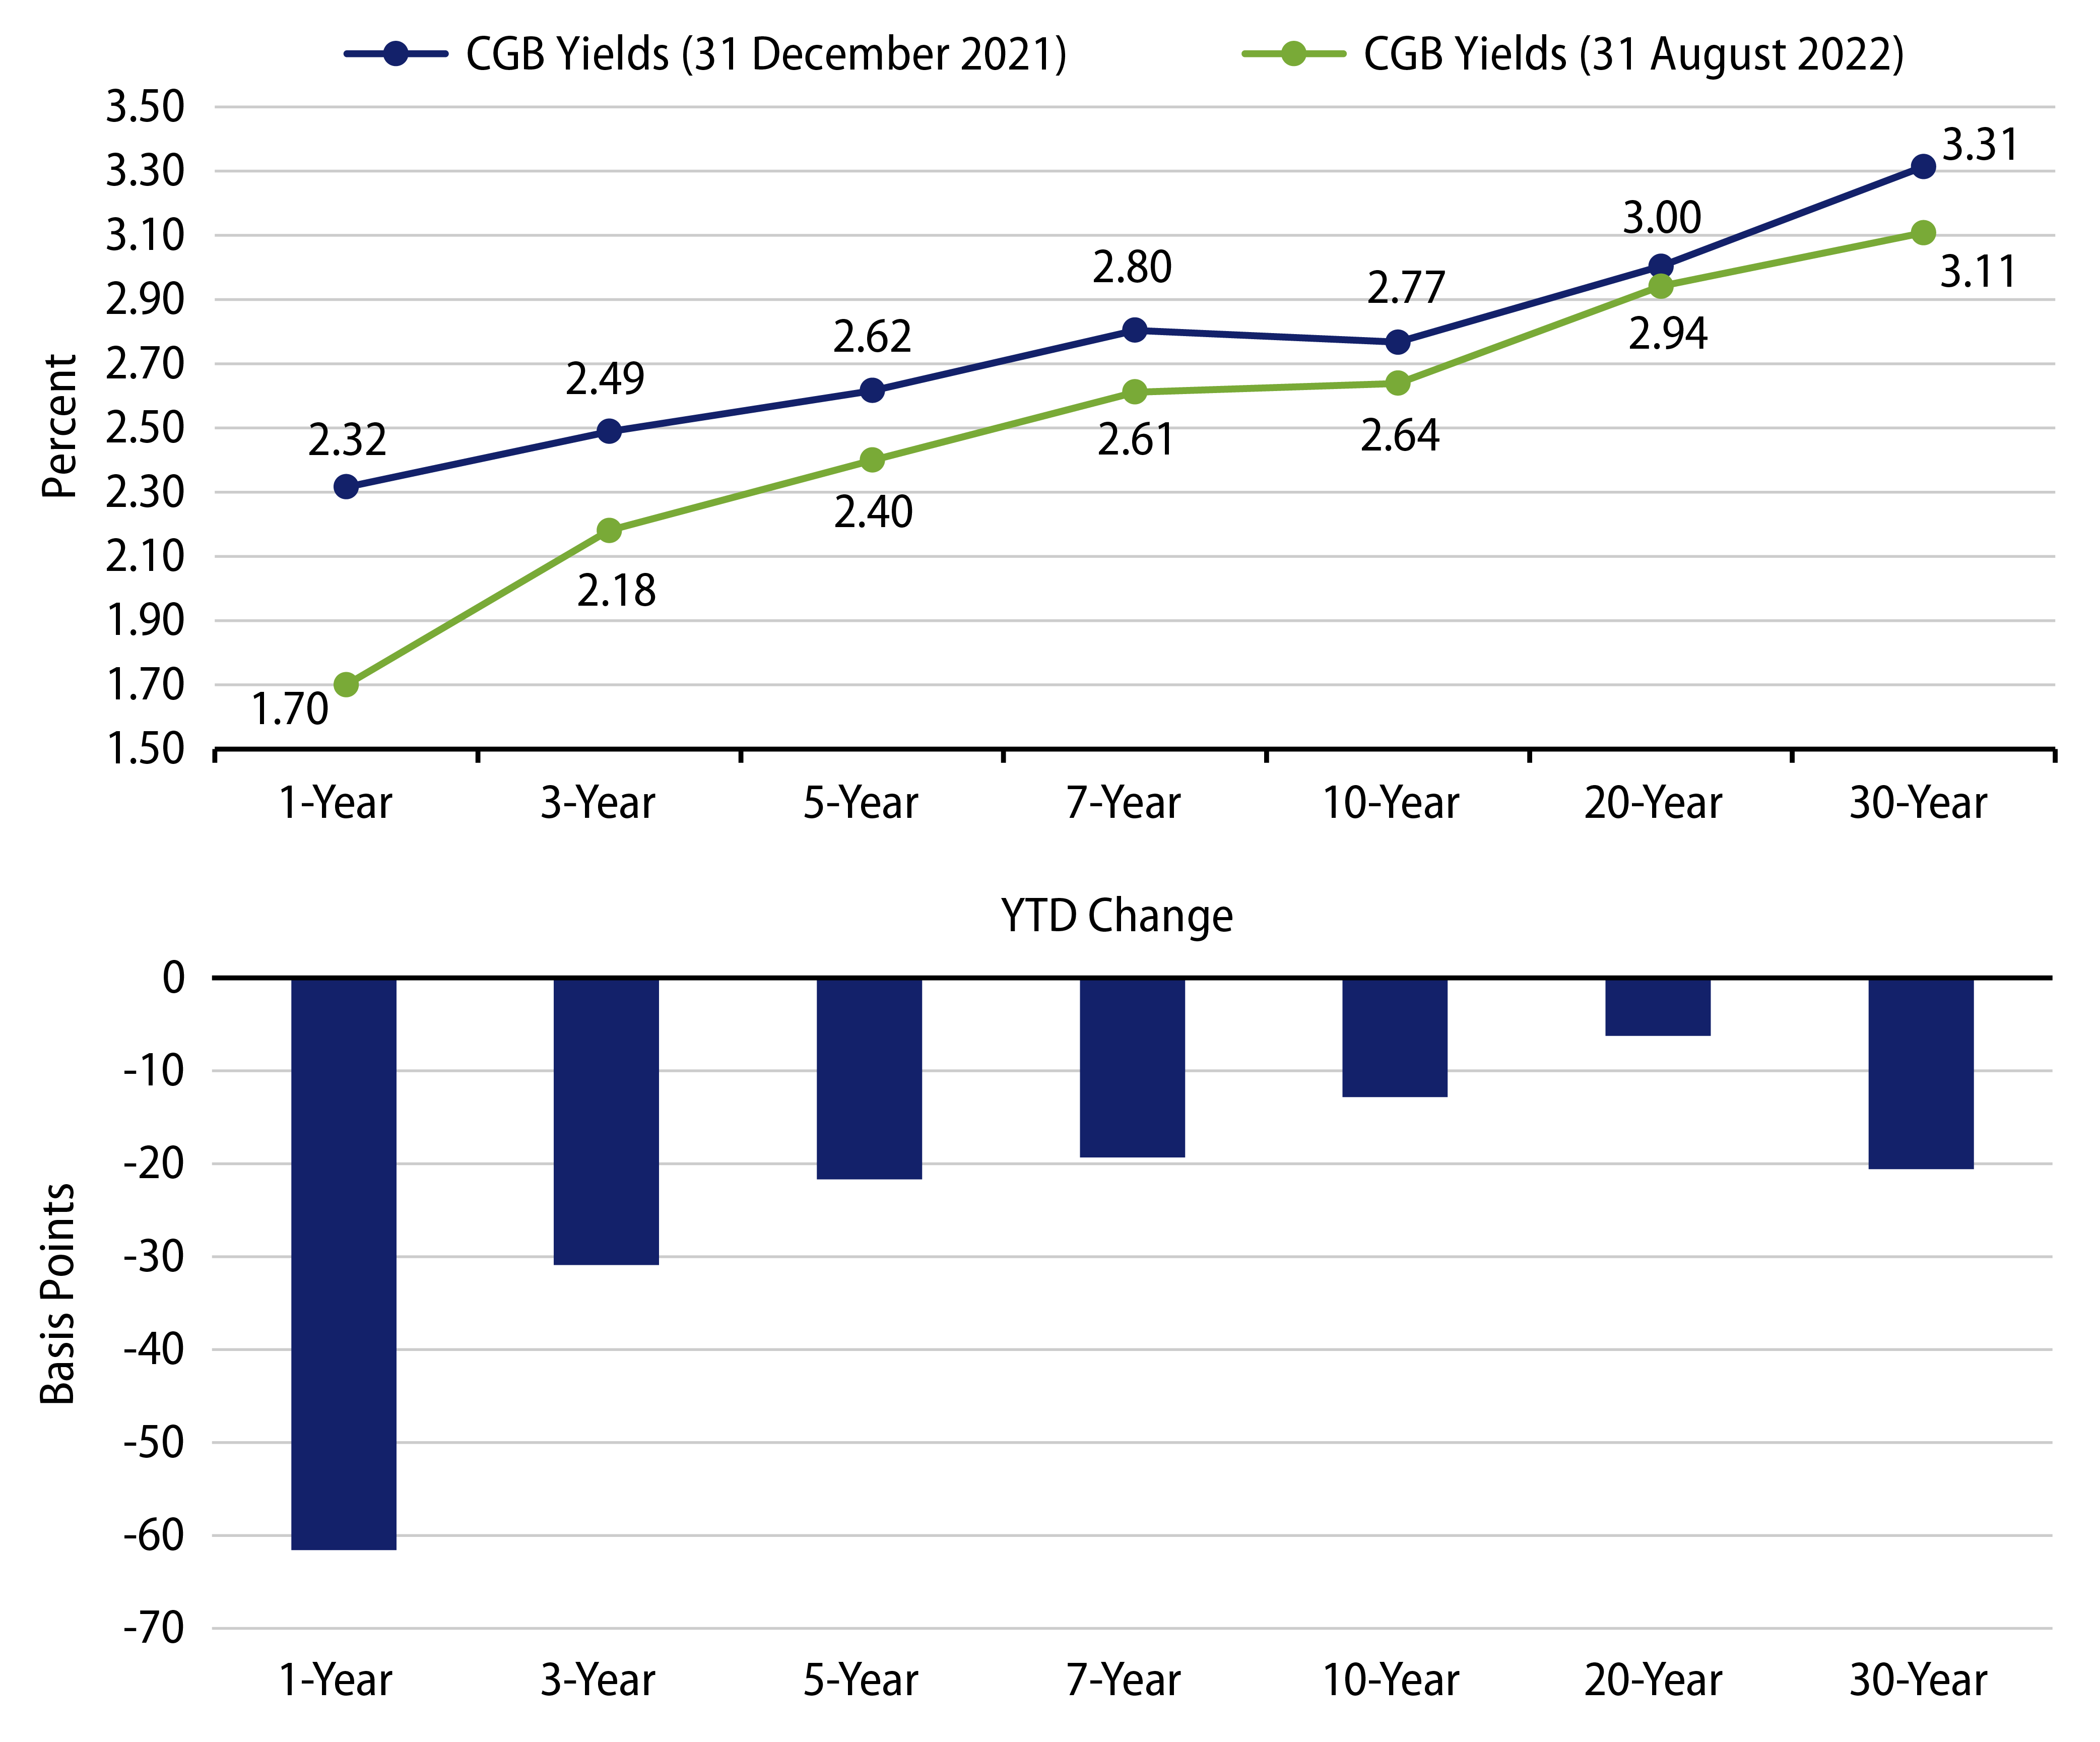
Yields on CGBs have bucked the trend in global sovereign bond yields this year as the PBoC pursued a divergent easing of domestic interest rates in contrast to rising interest rates elsewhere. As foreign ownership of onshore CGBs remains modest at about 10%, the Chinese bond market remains dominated by domestic investors including Chinese banks, pension and mutual funds. The low sensitivity of CGB yields to global interest rates (correlation with US Treasury yields is very low at 0.08 over the past two years and 0.30 over the past five years) has demonstrated CGBs’ strong diversification attributes within a global government bond portfolio; we believe that the low correlation will continue.
The increase in fiscal spending to counteract the property market downturn and adherence to ZCP will certainly means that the supply of CGBs and Local government bonds (LGBs) will increase significantly. In order for Chinese banks to support the bond market, the PBoC has been flushing the money market to positively steepen the yield curve to incentivize banks to buy more CGBs in the belly of the yield curve (Exhibit 8). Hence, we think onshore 10-year CGBs will remain range-bound, with the 5-7 year tenor well anchored. Bonds issued by China’s three policy banks and most LGBs are quasi-government risk with an attractive pickup over CGBs.
