skip navigation
Blog

Stay up to date on timely topics and market events. Subscribe to our Blog now.

STRATEGY
February 18, 2021

The Case for Active Management in High-Yield Investing

By James Raffini

Stay up to date on timely topics and market events. Subscribe to our Blog now.

Nowhere in previous publications have we made the claim that positive alpha is easy to generate. Investment managers, however, have shown results over time that reflect the benefits of an active approach to high-yield investing. As we look back on 2020, the year presented a complex, diverse set of circumstances including, among others: the pandemic, transformative technological innovations, changes in consumer behavior and massive stimulus programs. In the first quarter of 2020, the high-yield market (based on the Bloomberg Barclays US High Yield Index) fell close to 13%, with spreads reaching 1,100 bps over Treasuries. But, given the subsequent rally in the following three quarters, high-yield generated a total return of 7.1% for the year and spreads ended 2020 only 24 bps wider from where they began the year. These extreme moves resulted in a standard deviation for the index of approximately 15%—almost 3x higher than the annual average from 2010 to 2020.

Last year’s volatility underscored the benefits of active management, particularly in regard to fixed-income investing. Passive strategies are rooted in the notion that markets are too efficient for active managers to exploit consistently over time. Yet this ignores the obvious fact that markets vary considerably in terms of type, size, diversity and liquidity, which are all important determinants of a market’s complexity and its potential for greater pricing anomalies, instability and technical noise. Over the past decade, passive equity and fixed-income investment vehicles experienced robust inflows given the appeal of buying (what is often assumed to be) inexpensive index performance. As we will highlight, however, there are a number of reasons why we believe passive fixed-income investments have fallen short of their objectives by consistently underperforming the index. These reasons include:

  • Index construction criteria that have an overweight bias toward the largest debtors;

  • Monthly index rebalancing—prices tend to rise or fall as passive investors are forced to rebalance, whereas active investors seek to anticipate and profit from these swings;

  • The inability to exploit off-benchmark opportunities, often foregoing the prospects of enhanced yield or reduced volatility;

  • An asymmetric duration risk profile with rates already at historical lows, potentially leading to less yield per unit of duration;

  • An inherent liquidity mismatch between the structure of ETFs and their underlying holdings as reflected in the 1Q20 drawdowns;

  • Lack of research and resulting structural biases (as provided by active strategies) that target certain factors such as sector/quality/issuer exposures or duration/curve profiles. The energy sector, for example, represents approximately 13% of the high-yield index (as well as JNK, the SPDR Bloomberg Barclays High Yield Bond ETF, and HYG, the iShares iBoxx High Yield Corporate Bond ETF). During March 2020, the sector underperformed the broader high-yield index by 270 bps. An active manager with an underweight energy allocation would have significantly boosted its relative returns from a sector perspective given energy’s relative underperformance; and

  • Elevated trading costs/fees associated with structuring passive high-yield ETFs compared to other asset classes.

In addition to these factors, what is often overlooked is the relatively higher management fees associated with passive high-yield ETFs as compared with actively managed strategies.

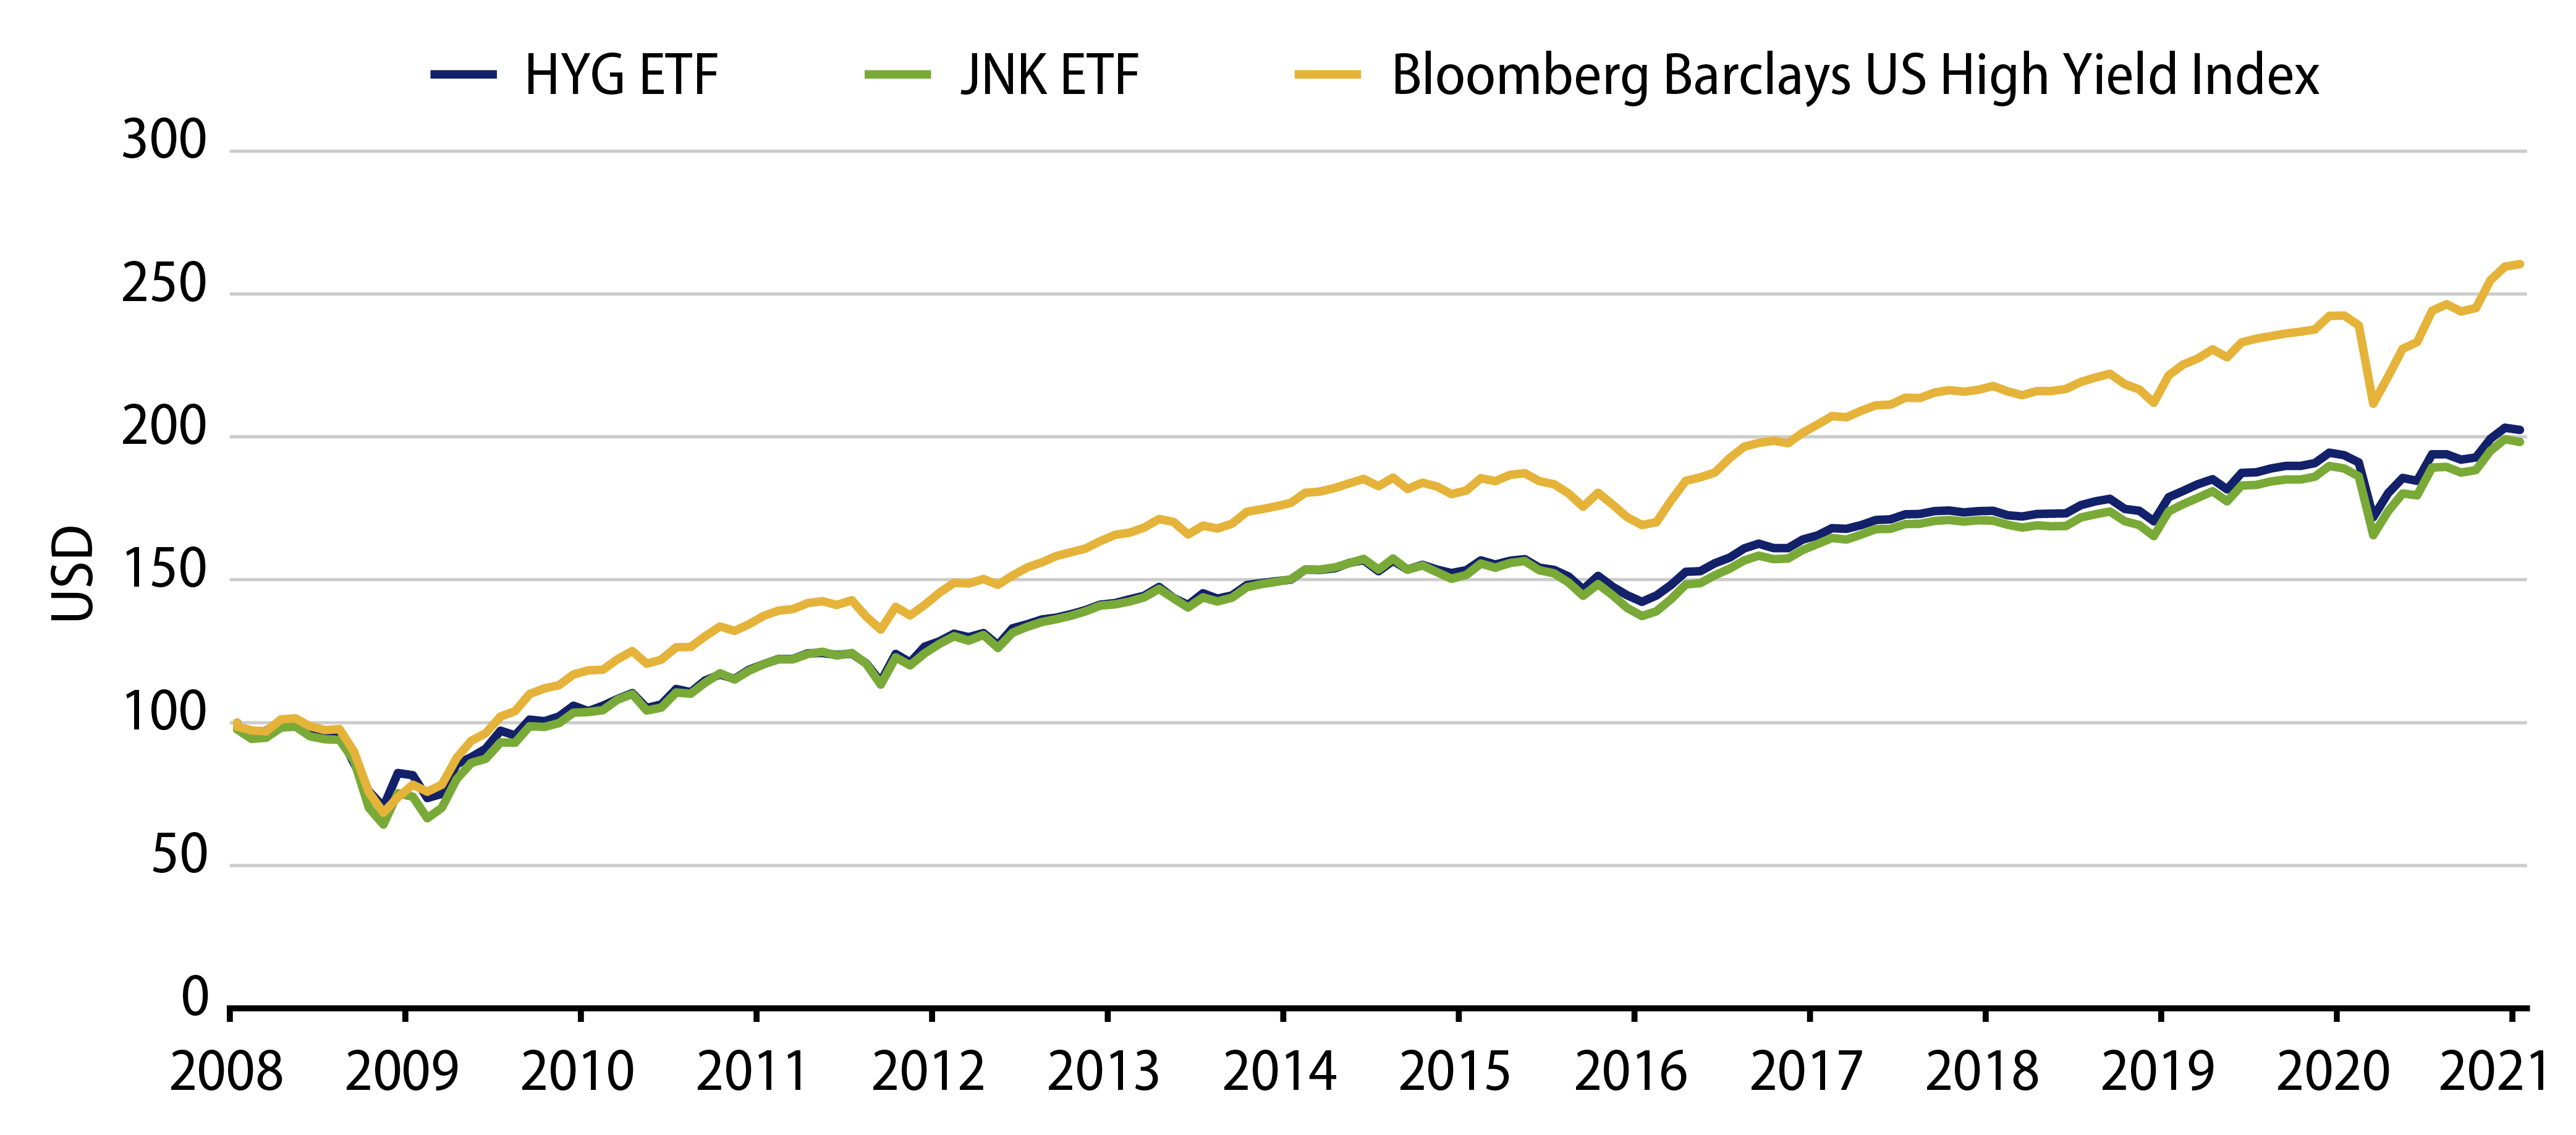
Historical return comparisons between active and passive funds show that a passive approach might make sense for highly liquid and efficient markets such as US large cap equities or US government bonds. But, on the high-yield front, the data tells a very different story. Investors have primarily pursued two passive high-yield vehicles in order to gain exposure—HYG and JNK, which have combined assets of close to $40 billion. Since the inception of both of these vehicles in 2007, they have meaningfully underperformed the Bloomberg Barclays US High Yield Index and the EVestment High Yield Peer Group. On an annualized basis from January 1, 2008 through January 31, 2021, HYG and JNK have underperformed the Bloomberg Barclays Index by 187 bps and 200 bps, respectively (see Exhibit 1). For context, the index has returned 7.6% annually during the period. As a result, passive investors, with the goal of replicating index-like returns, would have foregone more than 25% of the annualized total return. Further, not only did JNK materially underperform the index, it also generated a tracking error in excess of 2%. The significant underperformance and tracking error are unsurprising given the structural issues of ETFs noted earlier. Together, they underscore the benefits of having an active high-yield allocation.

Exhibit 1: Passive High-Yield ETFs Underperformed the Index
Explore Growth of a Dollar—Passive High-Yield ETFs Underperformed the Index.
Source: Bloomberg. As of 31 Jan 21. Select the image to expand the view.

To summarize, we believe actively managed high-yield investment strategies have an inherent advantage over passive strategies. Since our founding nearly 50 years ago, Western Asset has taken a value approach to investment decision-making premised on the view that fixed-income markets often misprice securities. As an active manager, we are well positioned to provide clients with opportunities for stronger risk-adjusted returns compared to relevant indices. We expect more bouts of volatility as markets emerge from the COVID-19 pandemic and, therefore, support active over passive high-yield manager allocations. We believe this positioning will provide investors with greater flexibility to manage risk and harvest value opportunities as they arise.

© Western Asset Management Company, LLC 2024. The information contained in these materials ("the materials") is intended for the exclusive use of the designated recipient ("the recipient"). This information is proprietary and confidential and may contain commercially sensitive information, and may not be copied, reproduced or republished, in whole or in part, without the prior written consent of Western Asset Management Company ("Western Asset").
Past performance does not predict future returns. These materials should not be deemed to be a prediction or projection of future performance. These materials are intended for investment professionals including professional clients, eligible counterparties, and qualified investors only.
These materials have been produced for illustrative and informational purposes only. These materials contain Western Asset's opinions and beliefs as of the date designated on the materials; these views are subject to change and may not reflect real-time market developments and investment views.
Third party data may be used throughout the materials, and this data is believed to be accurate to the best of Western Asset's knowledge at the time of publication, but cannot be guaranteed. These materials may also contain strategy or product awards or rankings from independent third parties or industry publications which are based on unbiased quantitative and/or qualitative information determined independently by each third party or publication. In some cases, Western Asset may subscribe to these third party's standard industry services or publications. These standard subscriptions and services are available to all asset managers and do not influence rankings or awards in any way.
Investment strategies or products discussed herein may involve a high degree of risk, including the loss of some or all capital. Investments in any products or strategies described in these materials may be volatile, and investors should have the financial ability and willingness to accept such risks.
Unless otherwise noted, investment performance contained in these materials is reflective of a strategy composite. All other strategy data and information included in these materials reflects a representative portfolio which is an account in the composite that Western Asset believes most closely reflects the current portfolio management style of the strategy. Performance is not a consideration in the selection of the representative portfolio. The characteristics of the representative portfolio shown may differ from other accounts in the composite. Information regarding the representative portfolio and the other accounts in the composite are available upon request. Statements in these materials should not be considered investment advice. References, either general or specific, to securities and/or issuers in the materials are for illustrative purposes only and are not intended to be, and should not be interpreted as, recommendation to purchase or sell such securities. Employees and/or clients of Western Asset may have a position in the securities or issuers mentioned.
These materials are not intended to provide, and should not be relied on for, accounting, legal, tax, investment or other advice. The recipient should consult its own counsel, accountant, investment, tax, and any other advisers for this advice, including economic risks and merits, related to making an investment with Western Asset. The recipient is responsible for observing the applicable laws and regulations of their country of residence.
Founded in 1971, Western Asset Management Company is a global fixed-income investment manager with offices in Pasadena, New York, London, Singapore, Tokyo, Melbourne, São Paulo, Hong Kong, and Zürich. Western Asset is a wholly owned subsidiary of Franklin Resources, Inc. but operates autonomously. Western Asset is comprised of six legal entities across the globe, each with distinct regional registrations: Western Asset Management Company, LLC, a registered Investment Adviser with the Securities and Exchange Commission; Western Asset Management Company Distribuidora de Títulos e Valores Mobiliários Limitada is authorized and regulated by Comissão de Valores Mobiliários and Brazilian Central Bank; Western Asset Management Company Pty Ltd ABN 41 117 767 923 is the holder of the Australian Financial Services License 303160; Western Asset Management Company Pte. Ltd. Co. Reg. No. 200007692R is a holder of a Capital Markets Services License for fund management and regulated by the Monetary Authority of Singapore; Western Asset Management Company Ltd, a registered Financial Instruments Business Operator and regulated by the Financial Services Agency of Japan; and Western Asset Management Company Limited is authorised and regulated by the Financial Conduct Authority ("FCA") (FRN 145930). This communication is intended for distribution to Professional Clients only if deemed to be a financial promotion in the UK as defined by the FCA. This communication may also be intended for certain EEA countries where Western Asset has been granted permission to do so. For the current list of the approved EEA countries please contact Western Asset at +44 (0)20 7422 3000.