Macros, Markets and Munis
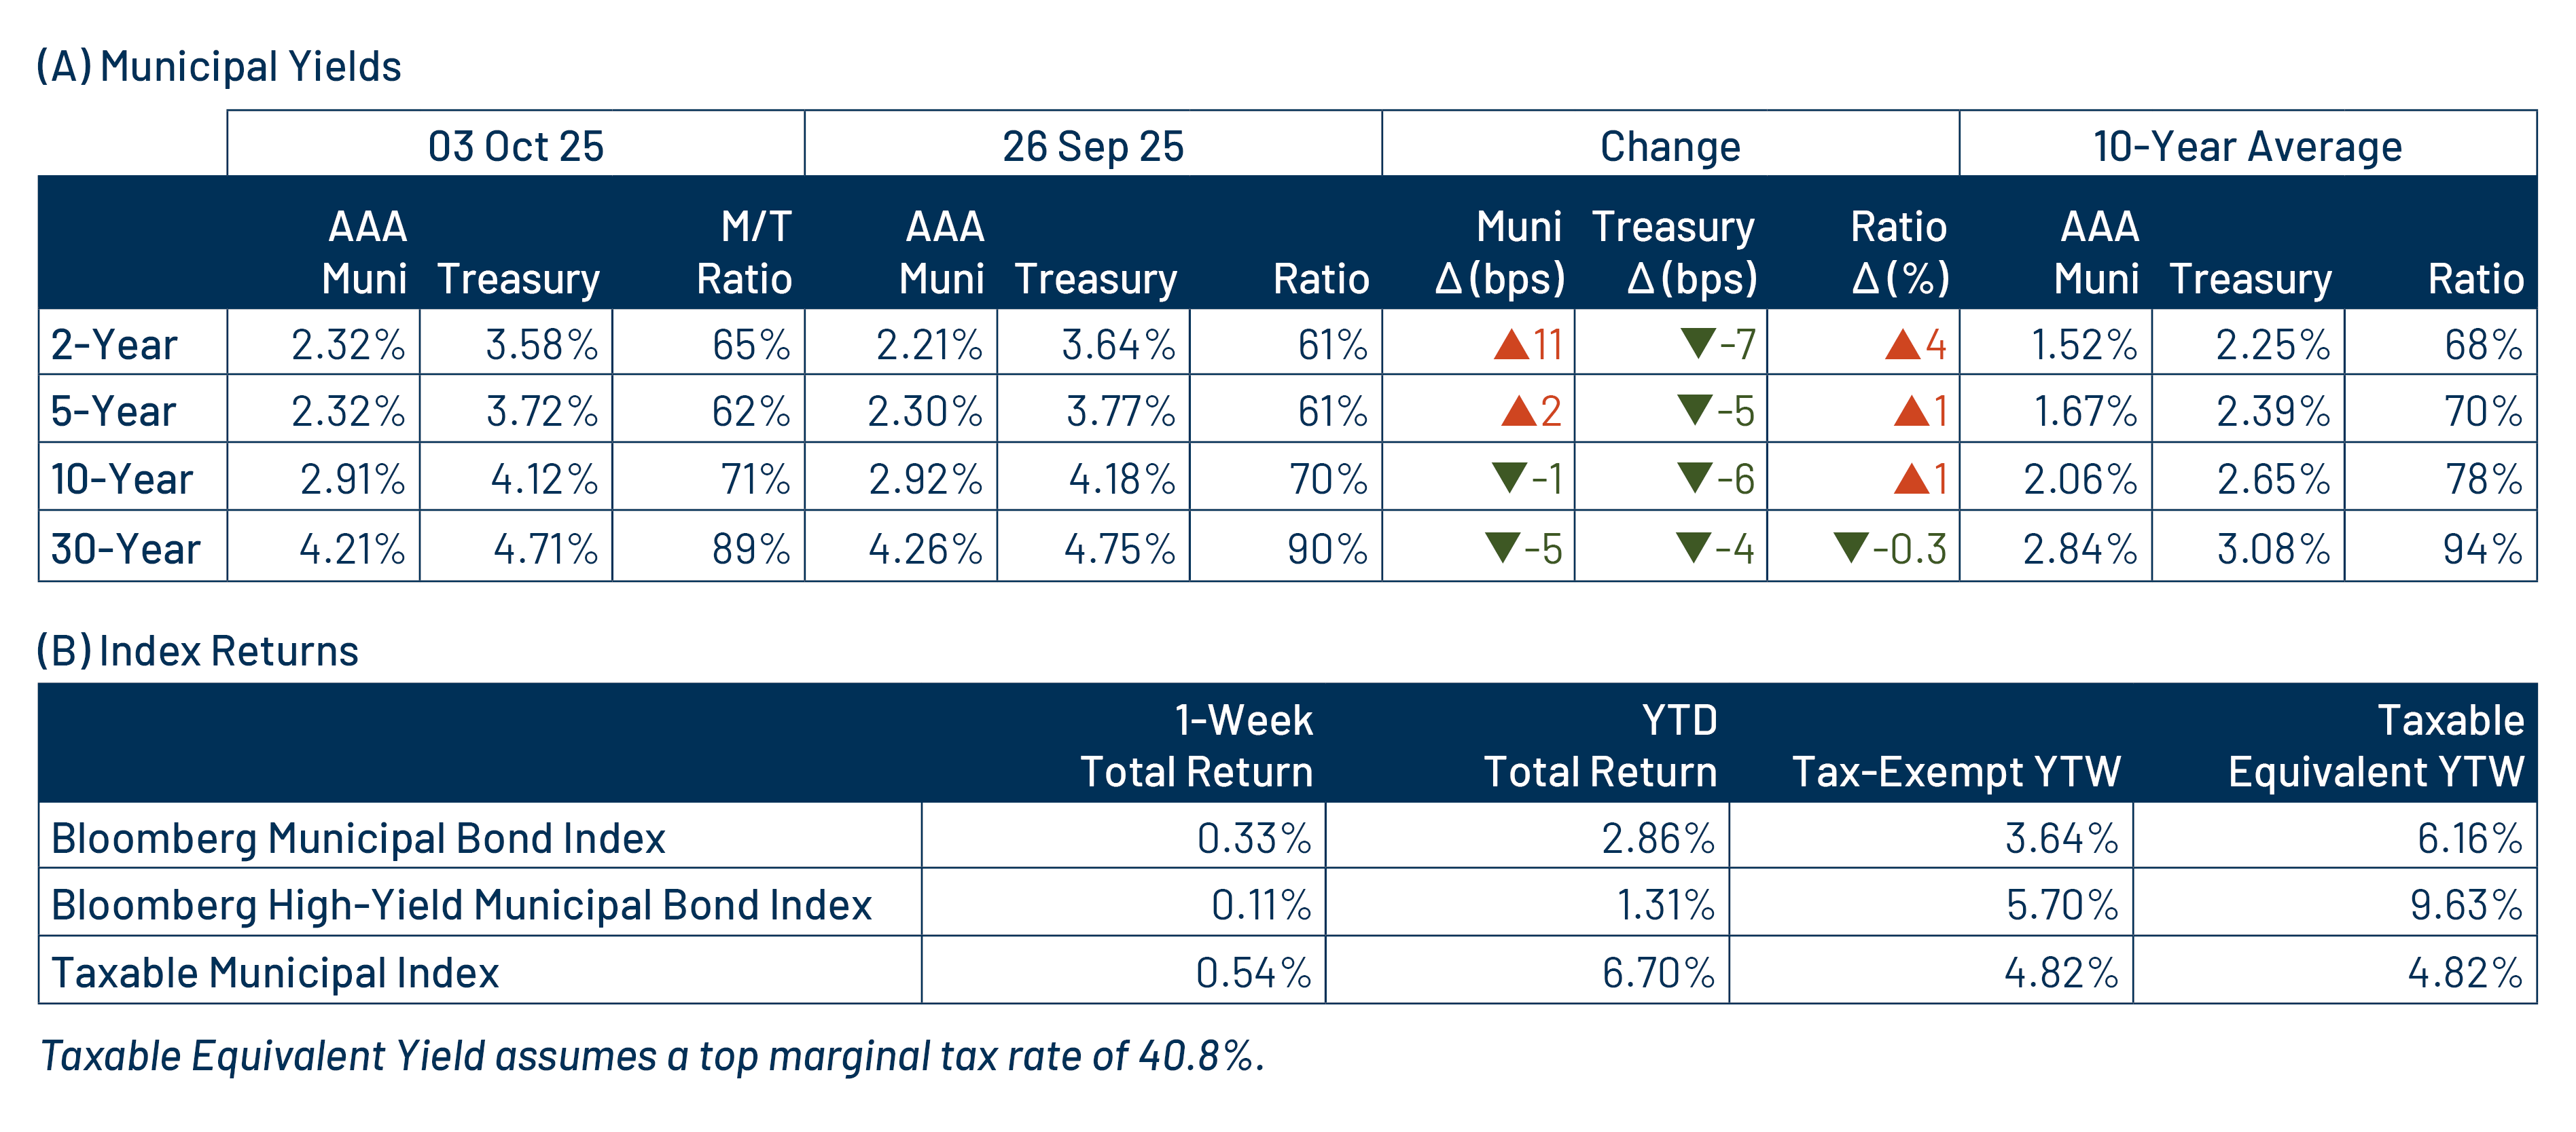
Munis posted positive returns and Treasuries moved lower across the yield curve last week. The high-grade muni curve followed Treasuries lower in longer maturities, but muni yields generally underperformed and moved higher in shorter maturities. Muni demand remained positive amid elevated supply conditions. The federal government shutdown last week delayed the September employment release. Meanwhile, available economic data signaled economic softness, as consumer confidence data declined and fell below expectations early in the week, followed by the ADP employment report that indicated a decline in private sector jobs and included a downward revision to the prior month’s readings. This week we touch on municipal demand data as outlined by last month’s Federal Reserve (Fed) data release.
Muni Demand Remained Steady as Elevated Supply Persisted
Fund Flows ($1.1 billion of net outflows): During the week ending October 1, weekly reporting municipal mutual funds recorded $1.1 billion of net outflows, according to Lipper. Long-term funds recorded $591 million of inflows, intermediate funds recorded $438 million of inflows and the short-term category recorded $91 million of inflows. Last week’s inflows led year-to-date (YTD) inflows higher to $32 billion.
Supply (YTD supply of $439 billion; up 18% YoY): The muni market recorded $10 billion of new-issue supply last week, down 36% from the prior week but still keeping an elevated pace. YTD new-issue supply of $439 billion is 18% higher than the prior year, with tax-exempt issuance up 19% year-over-year (YoY) and taxable issuance in line with prior year levels. This week’s calendar is expected to pick up to $13 billion. The largest deals include $1.7 billion Texas Transportation Financing Corporation and $834 million Kentucky Public Energy Authority transactions.
This Week in Munis: Individual Growth Surpassing Institutions
In September, the Fed released updated Flow of Funds data, highlighting the primary holders of municipal debt through 2Q25. According to the data, the size of the municipal market grew by approximately $30 billion in the second quarter and by $140 billion YoY, aligning with the record supply levels observed over the past year.
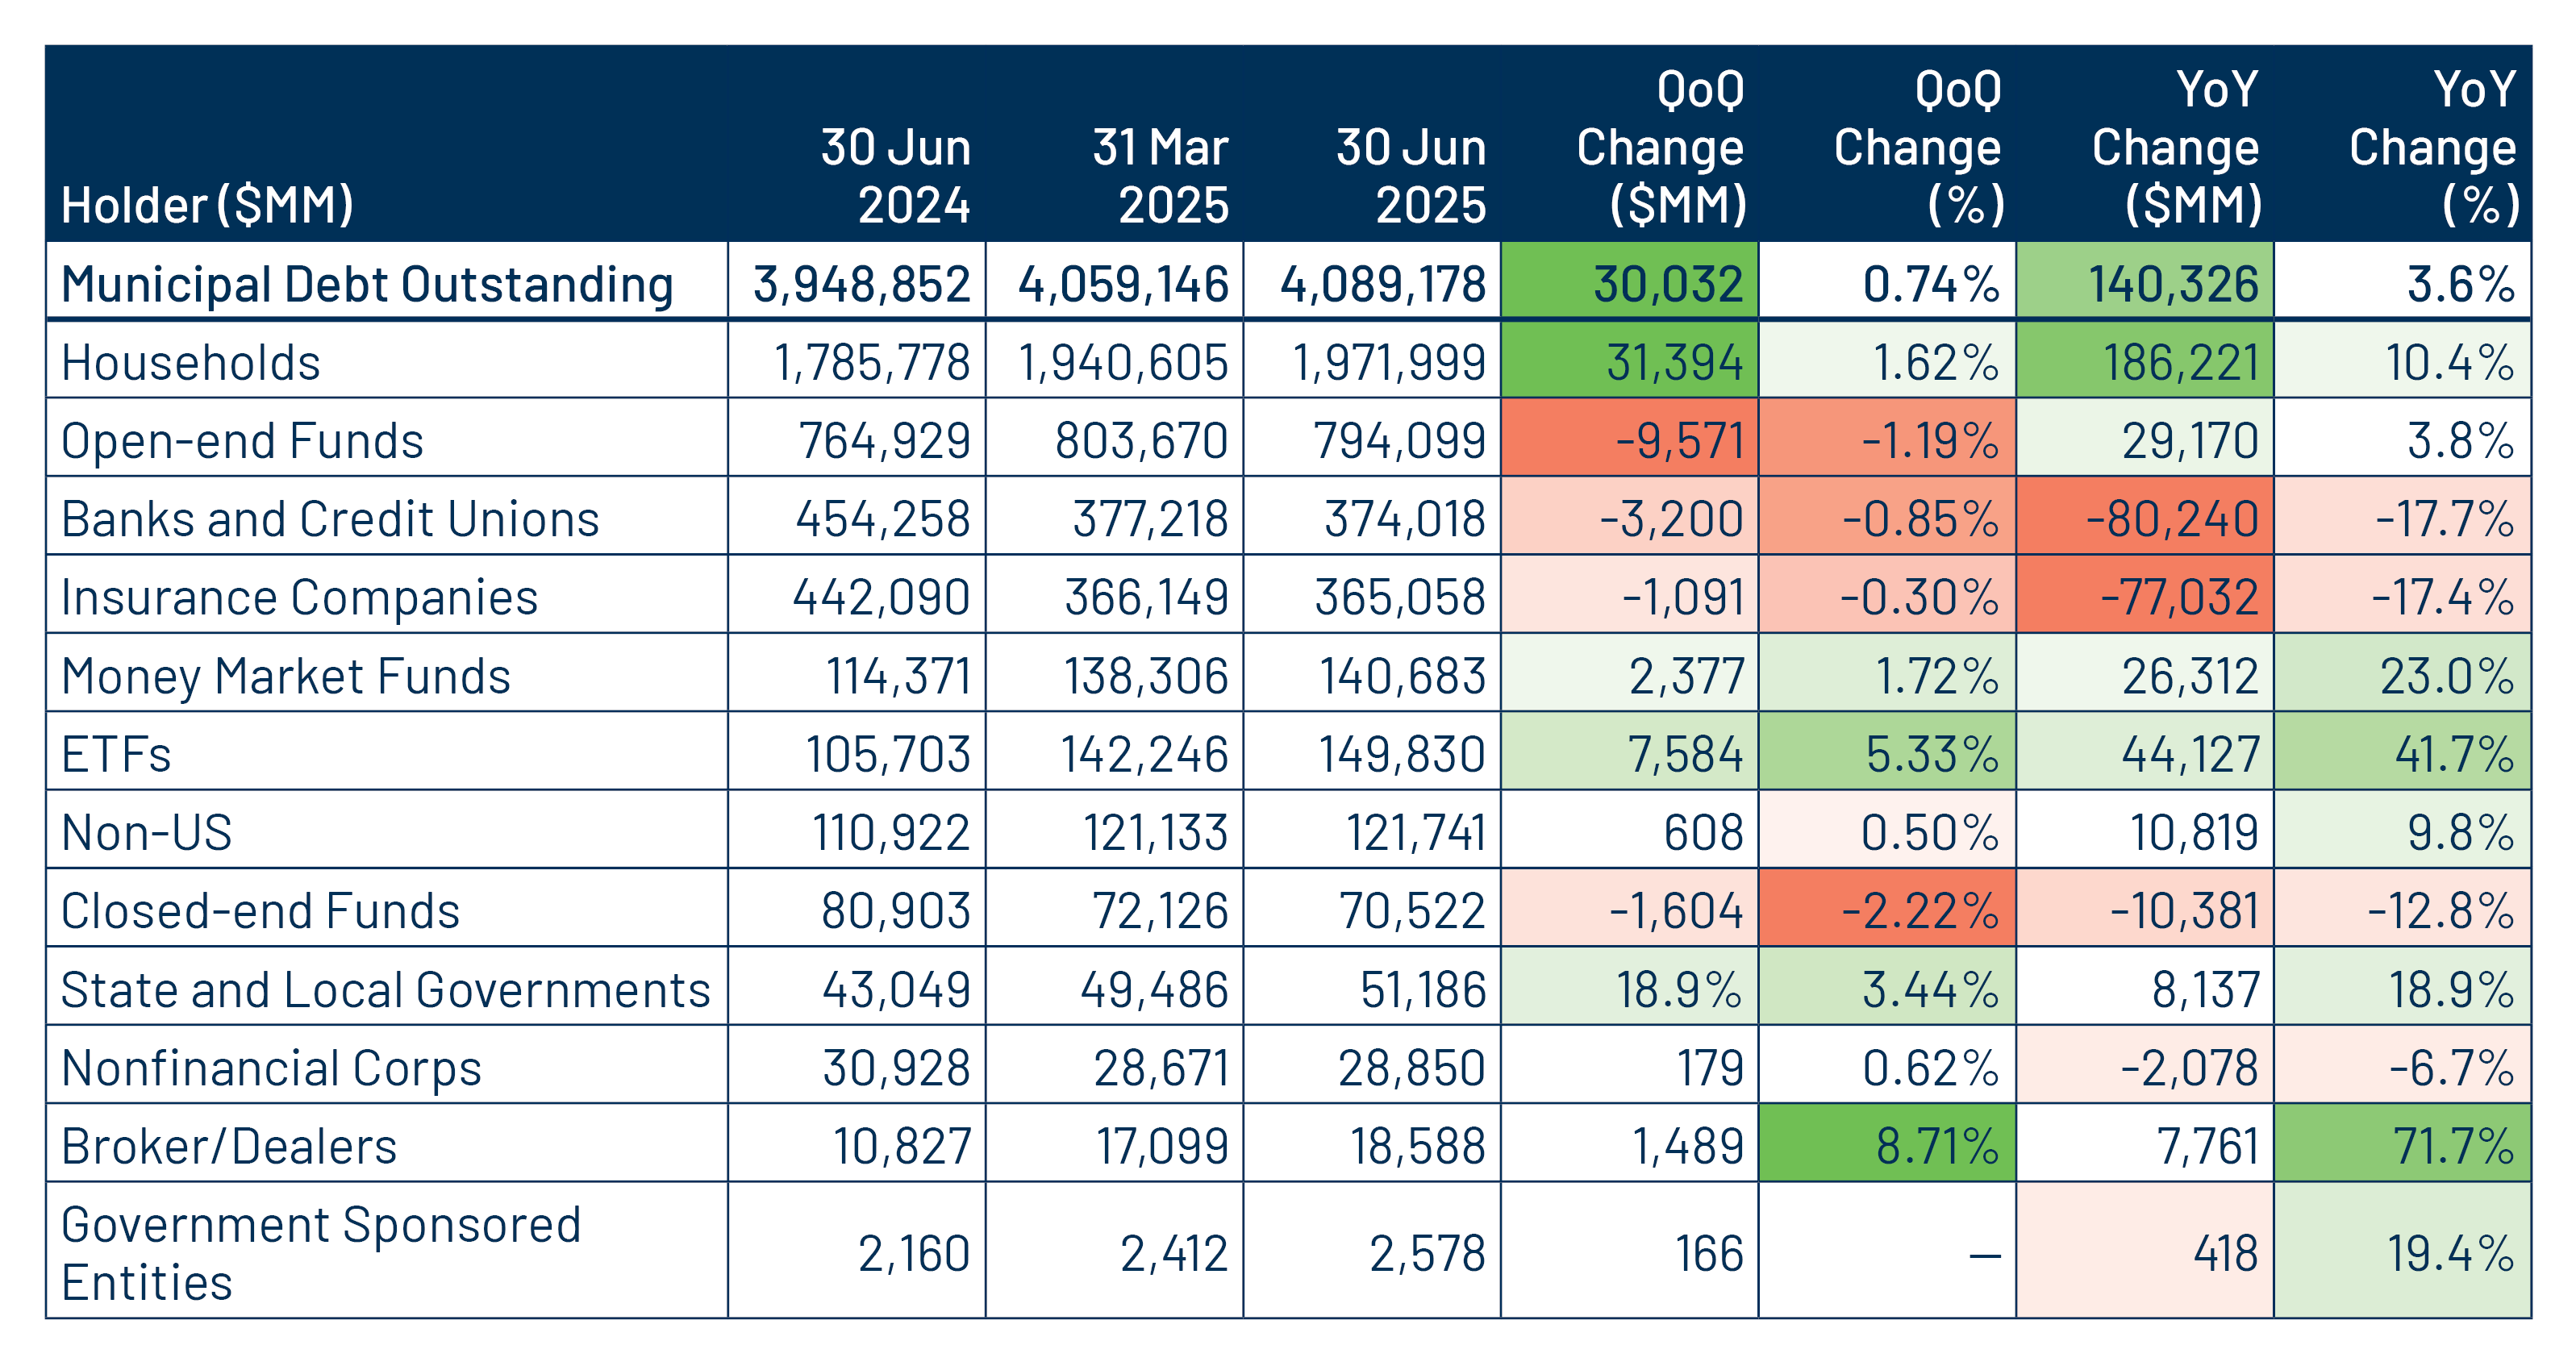
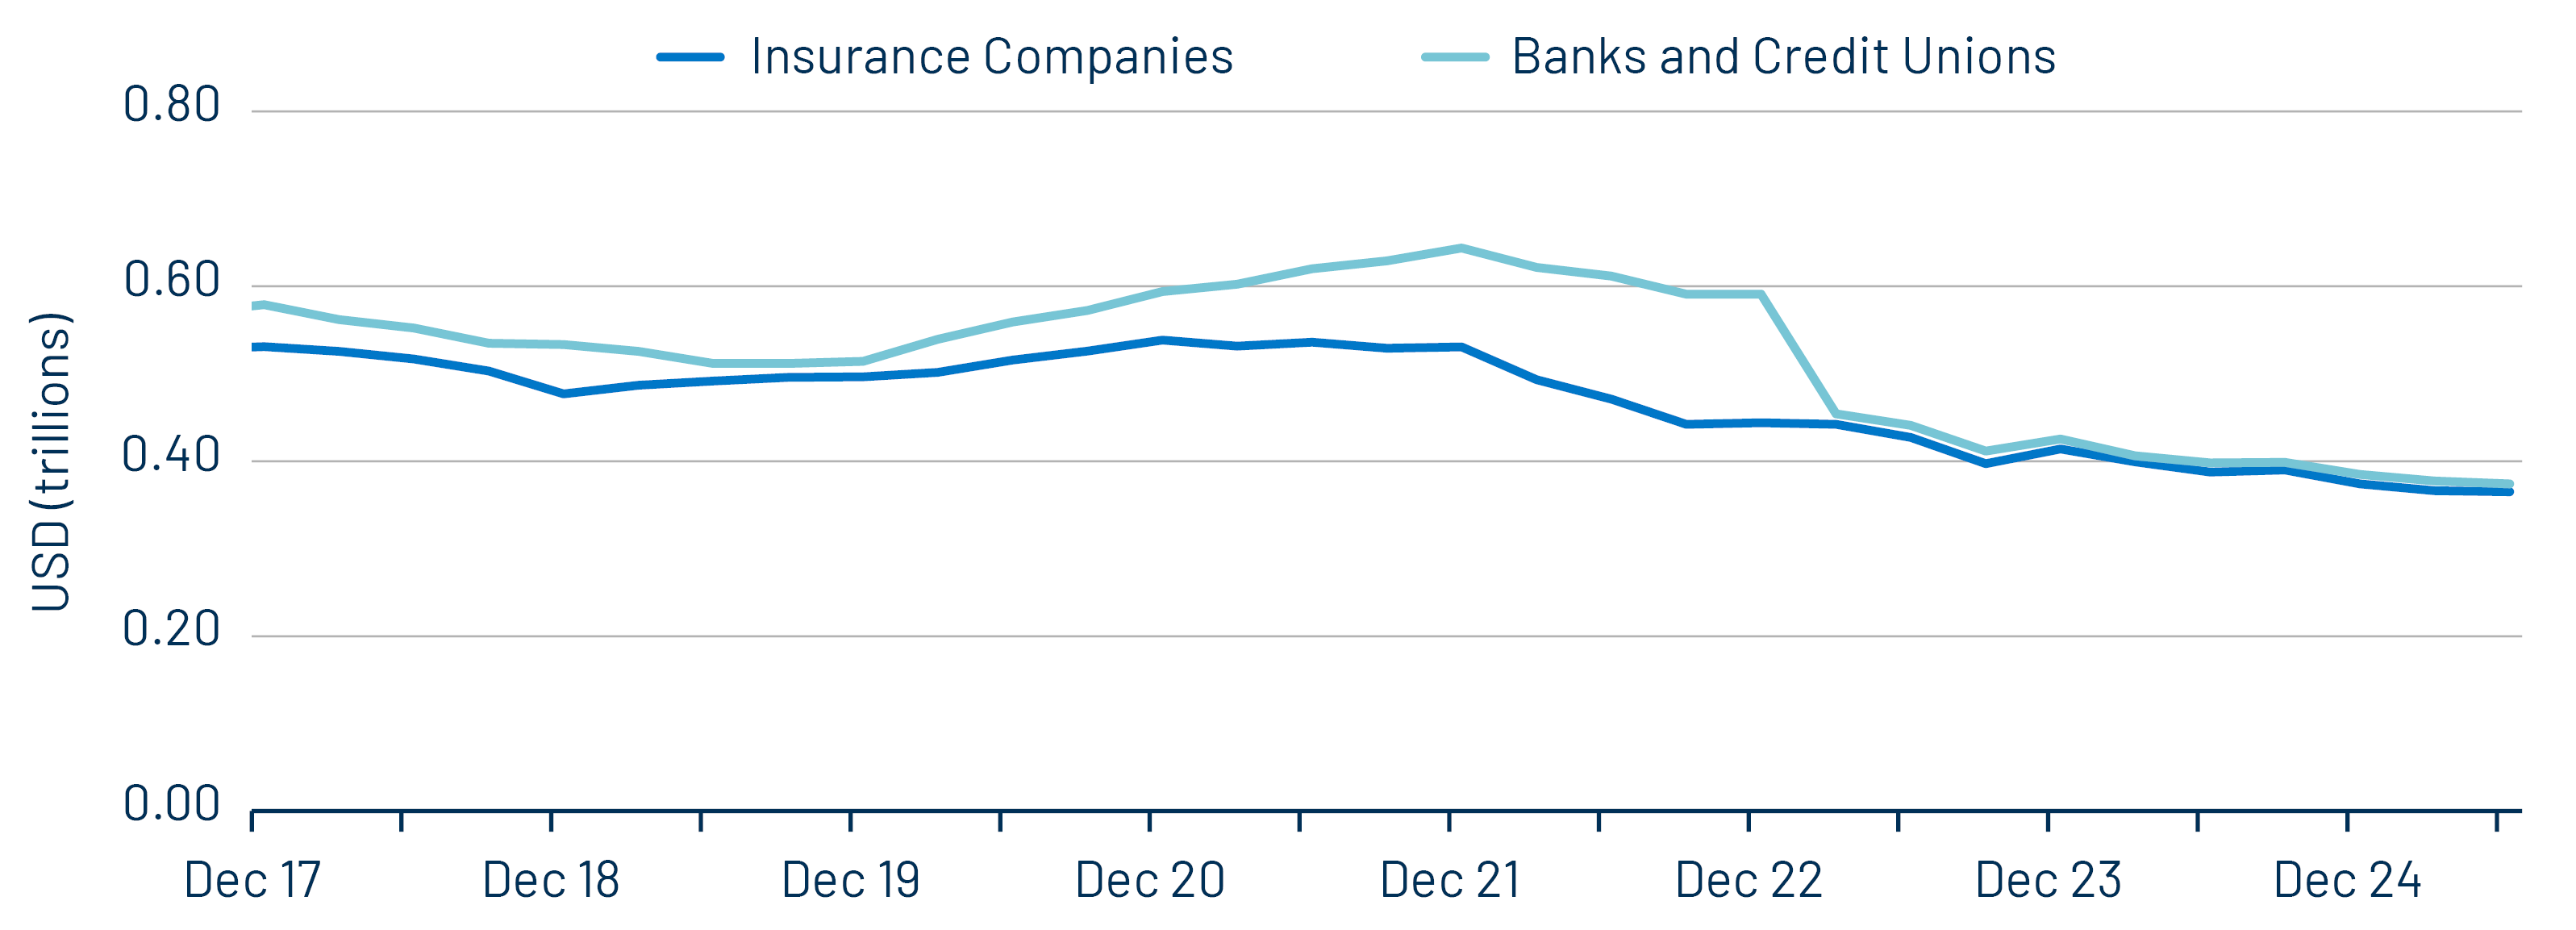
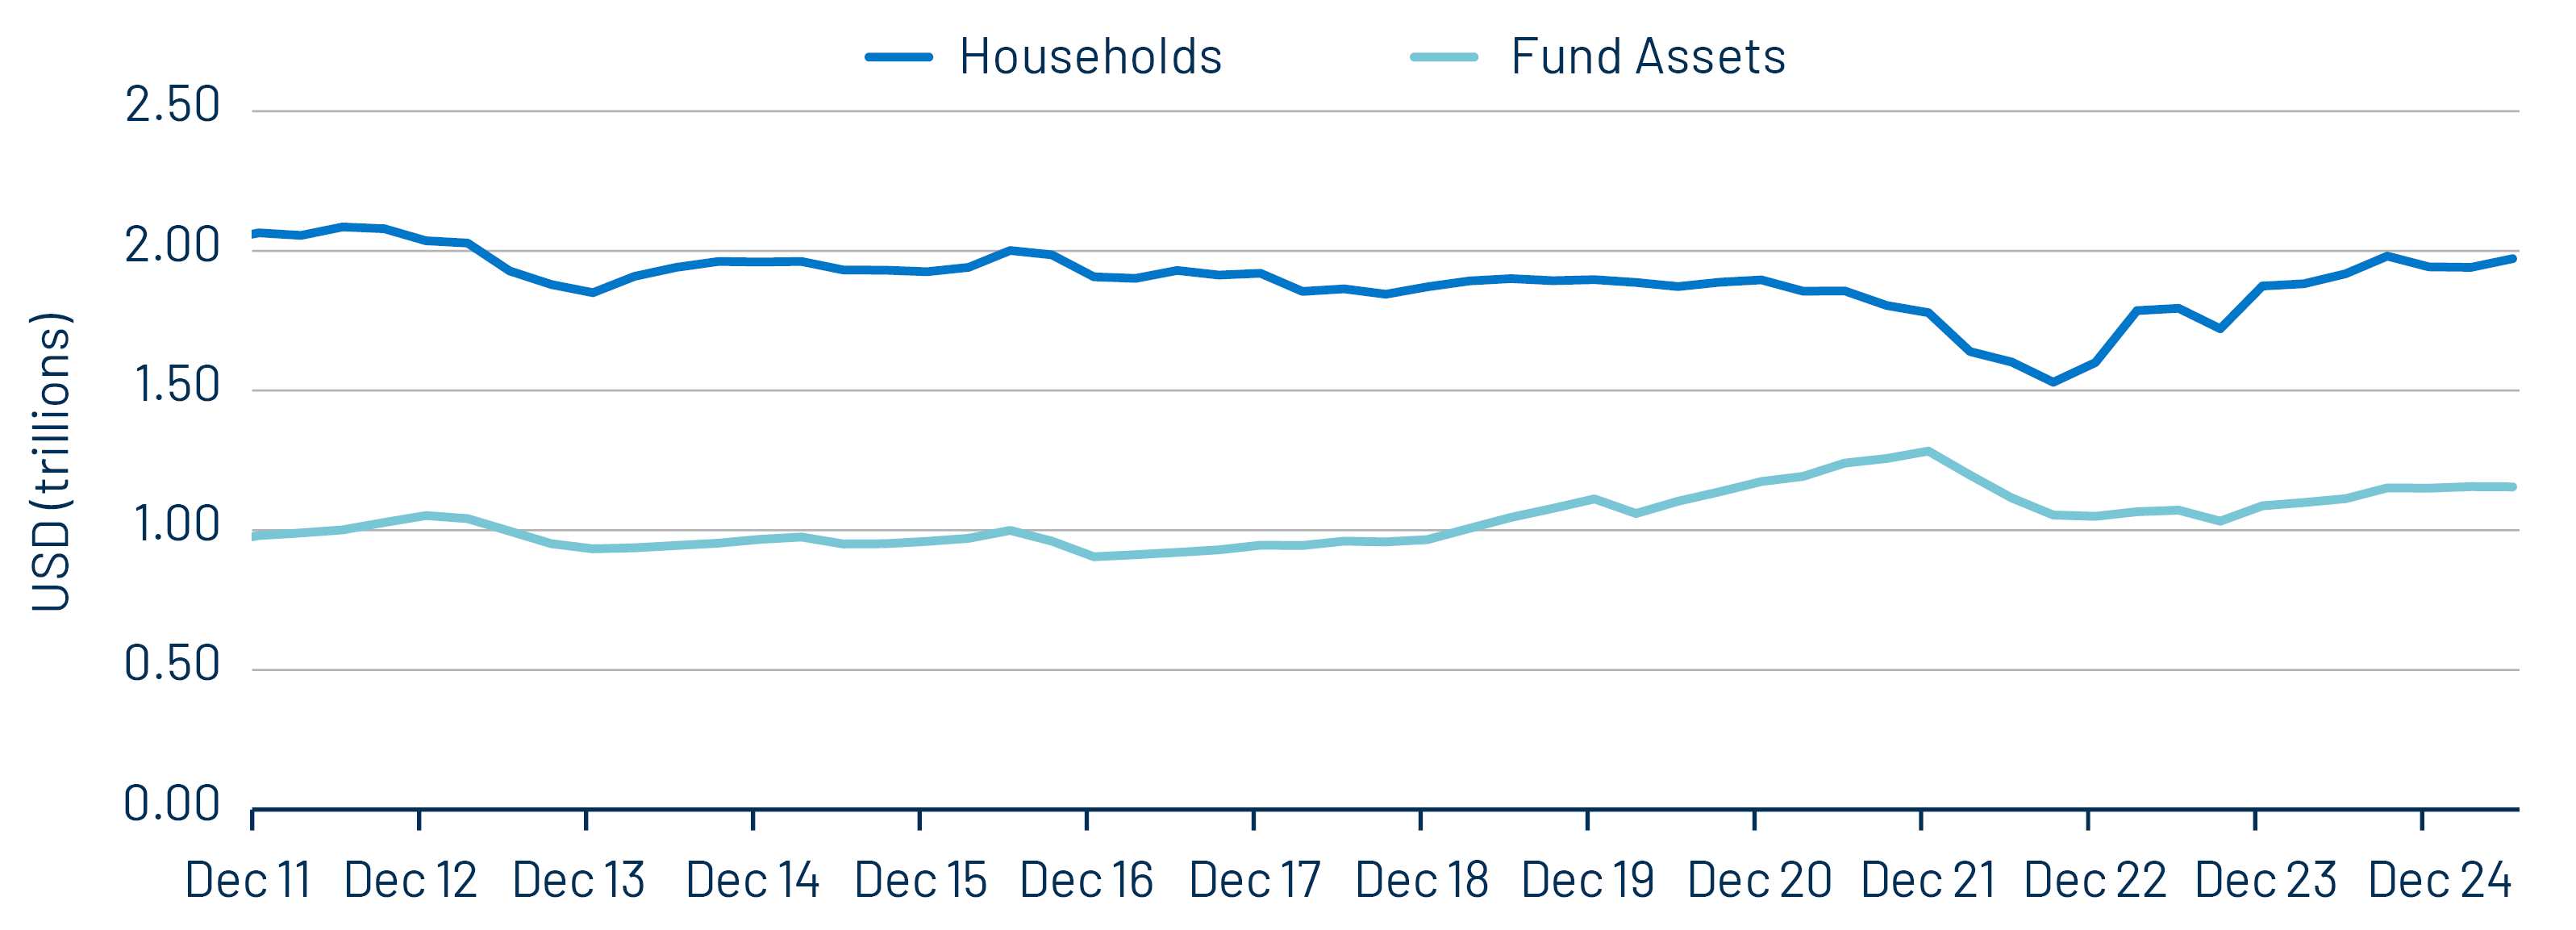
The Fed holdings data indicated a shift from institutional investors to an individual buyer base, a trend that continued from 2018 following the corporate tax rate reduction to 21% under the Tax Cuts and Jobs Act. In the second quarter, bank and insurance company municipal holdings decreased by $4 billion. Conversely, individual holdings, through household accounts and funds, rose by $30 billion. Notably, household SMAs and ETF assets increased by $31 billion (+1.6%) and $8 billion (+5.3%) in the quarter, respectively, while traditional open-end funds dropped by $10 billion (-1.2%), indicating a persisting shift in investor vehicle preferences.
The ongoing expansion of the individual municipal buyer base compared to institutional participation has led to a more concentrated municipal market. Western Asset believes this increased concentration may intensify the structural liquidity challenges inherent in the million-security municipal market and contribute to near-term volatility, creating opportunities for active managers who are able to navigate these dynamic conditions.
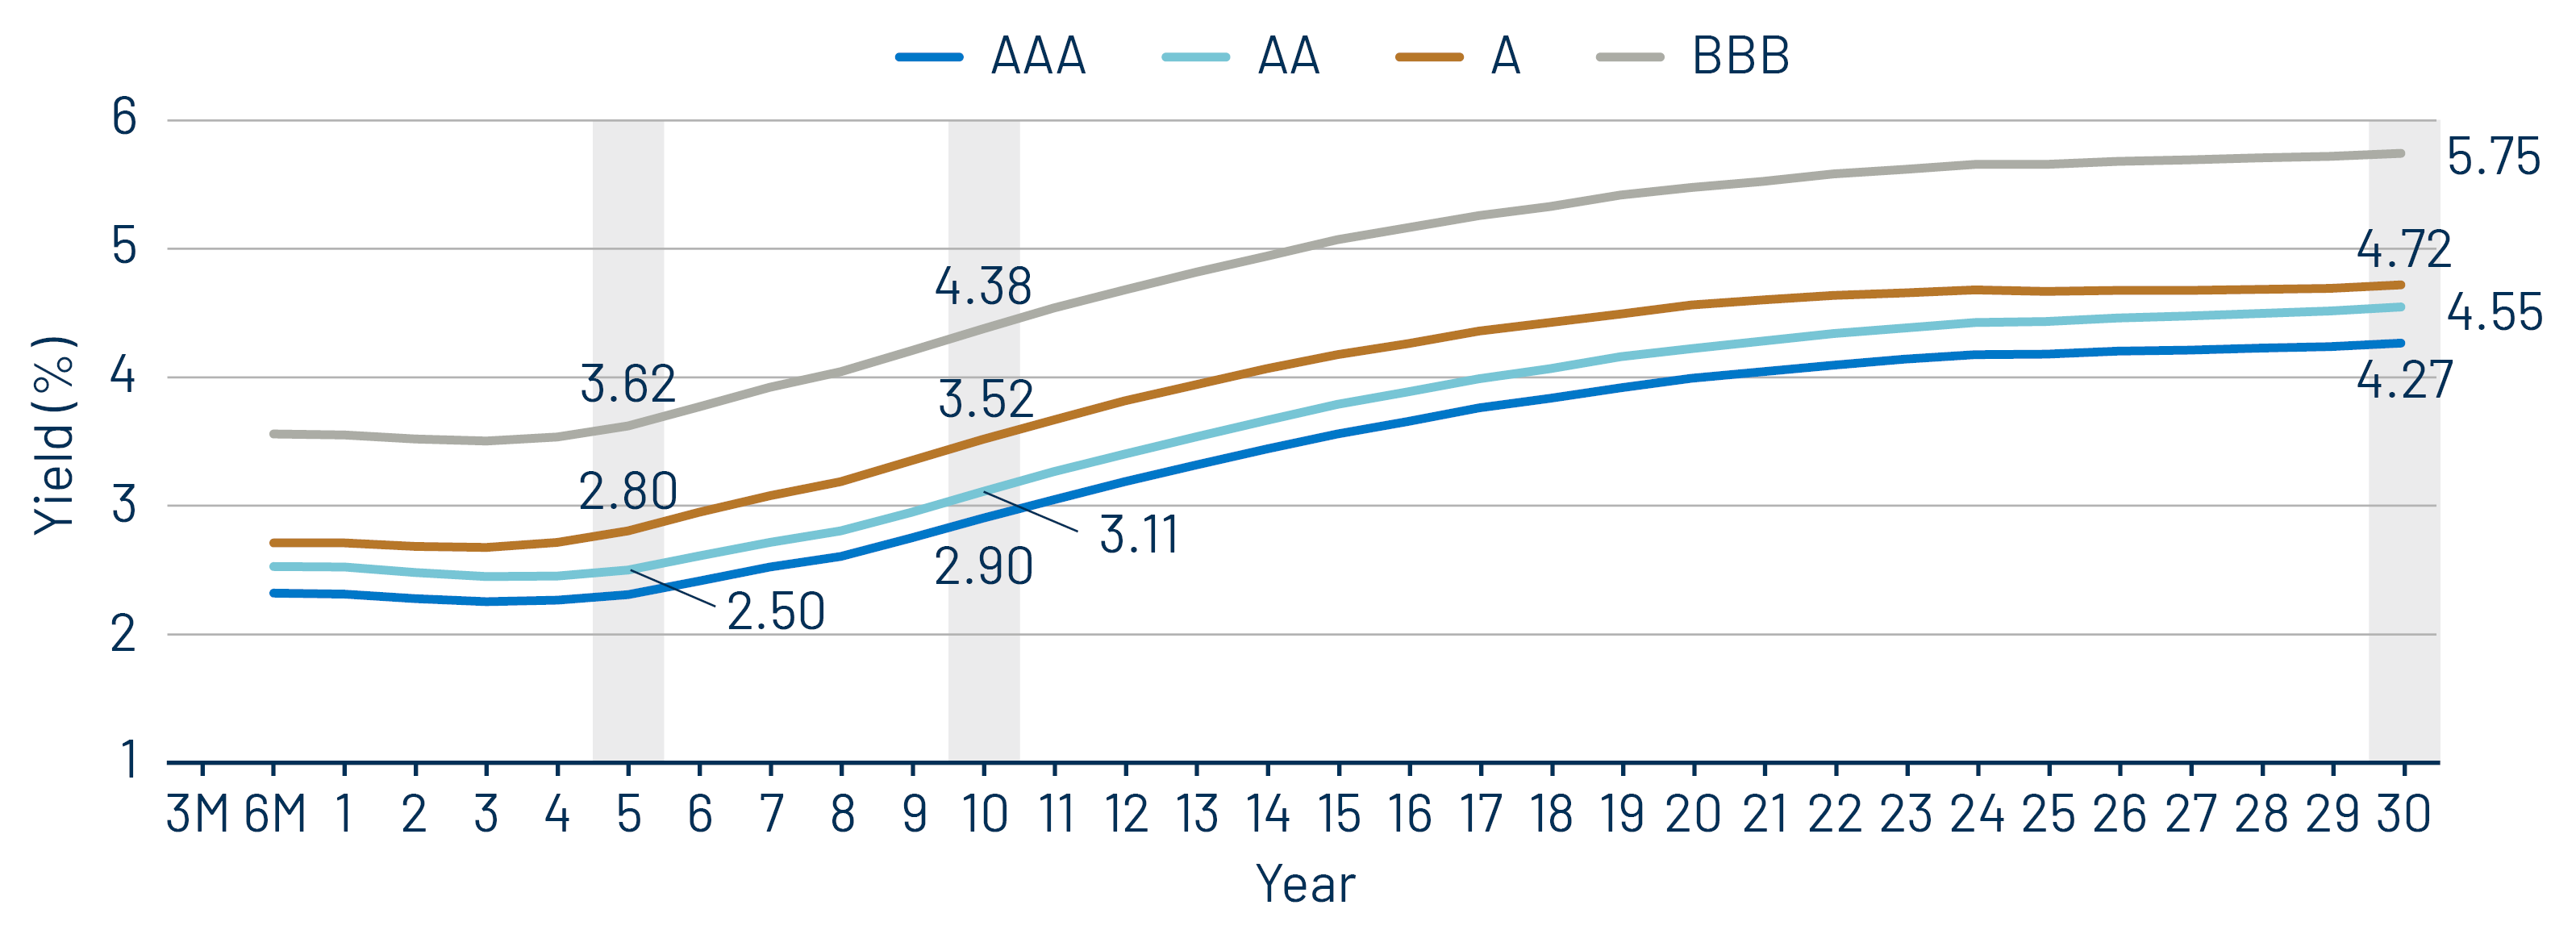
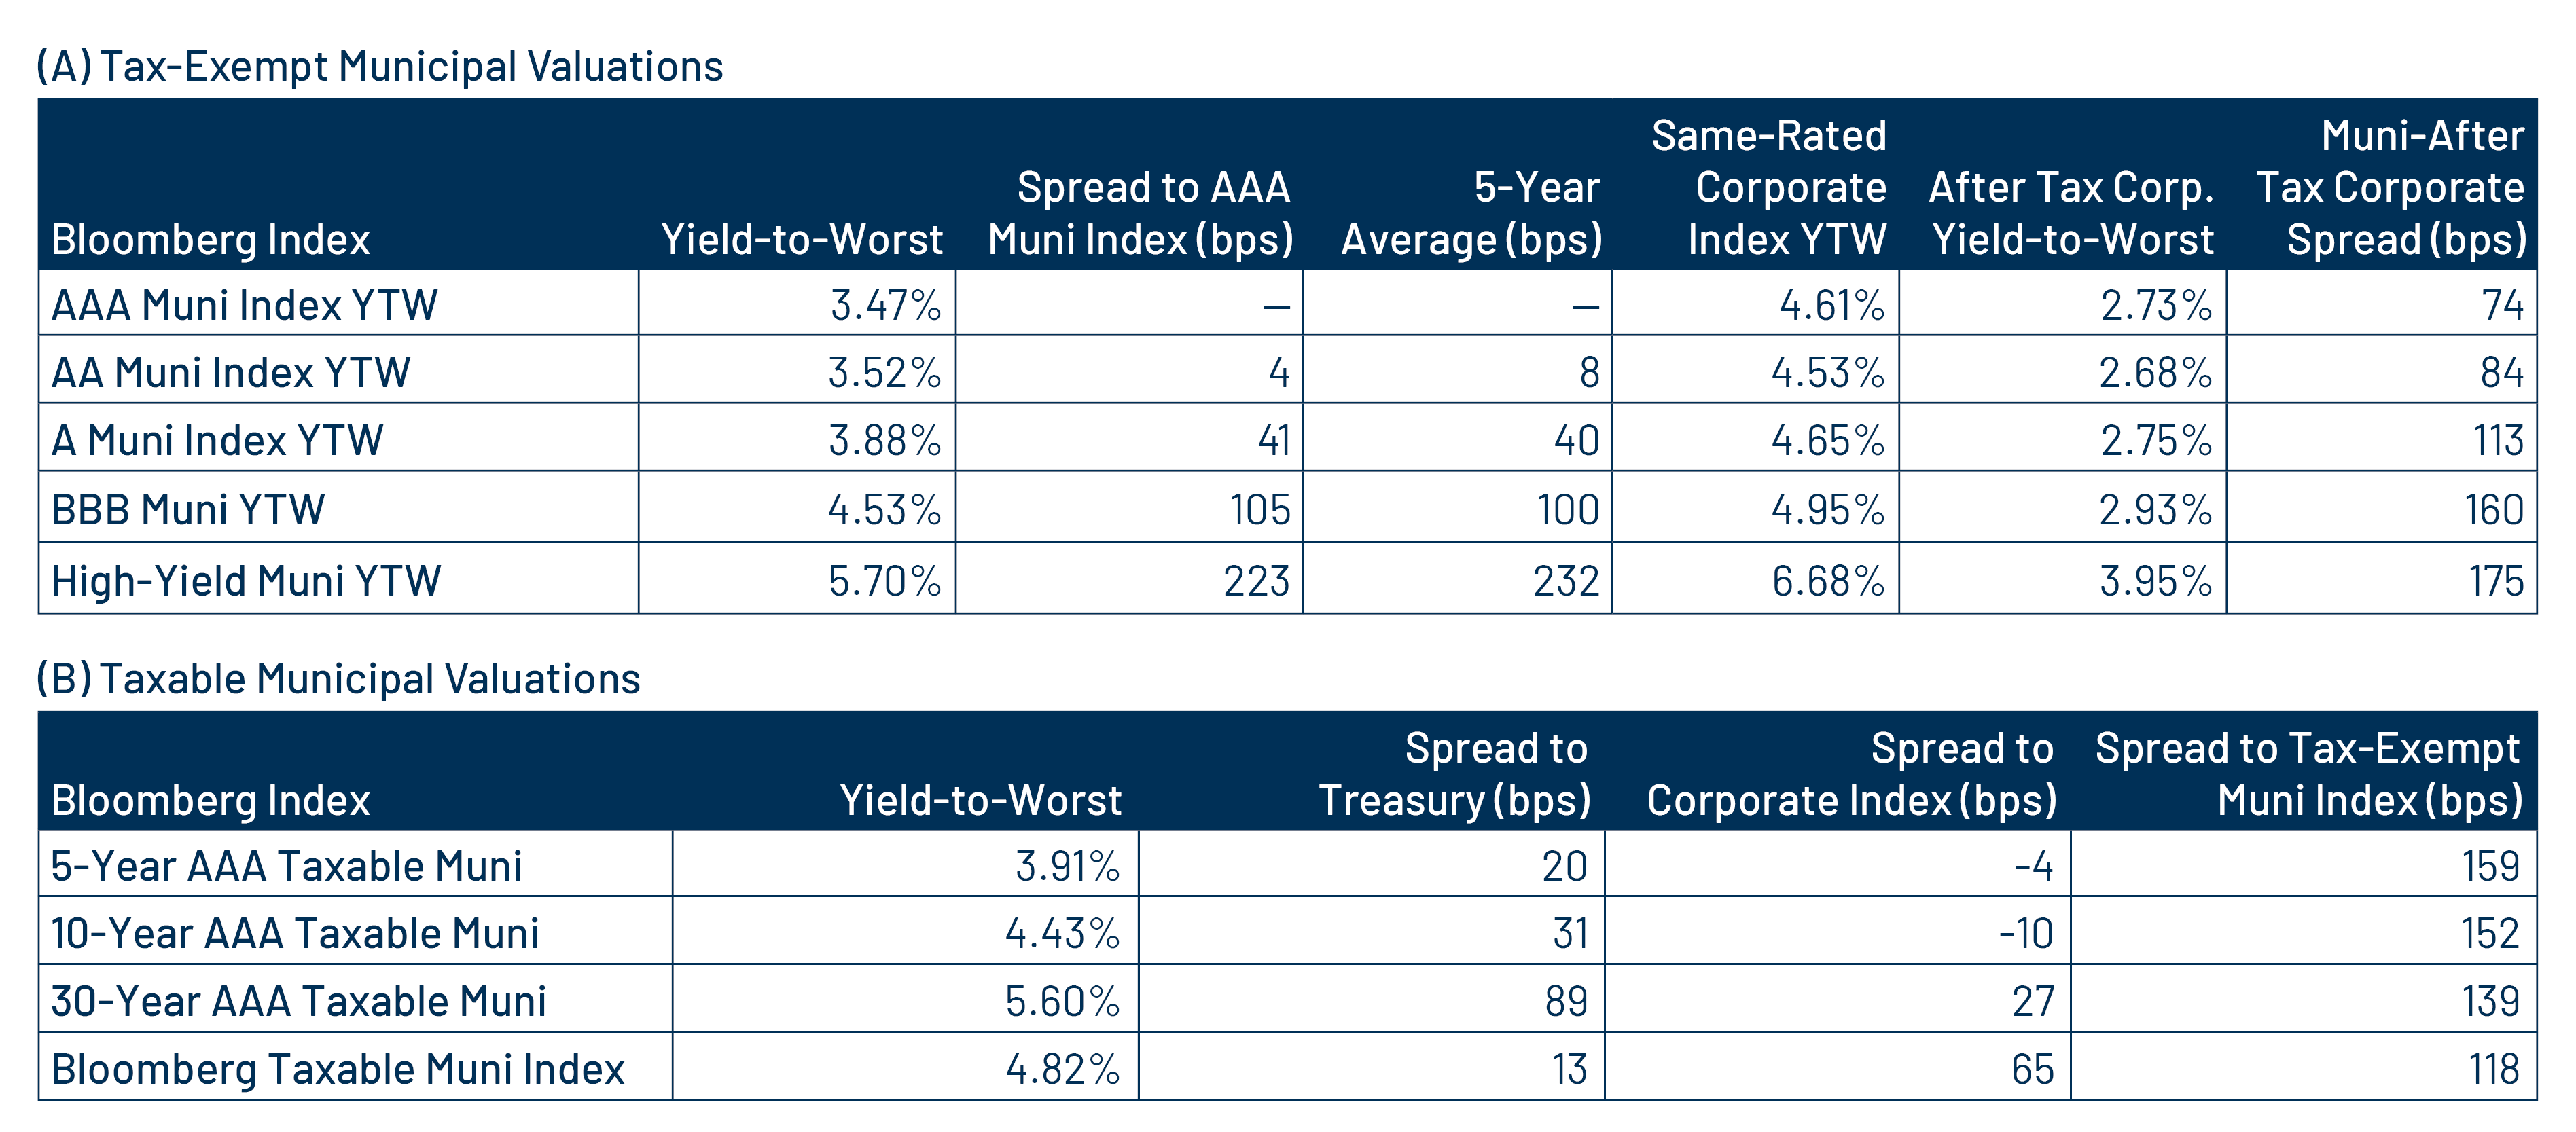
Municipal Credit Curves and Relative Value
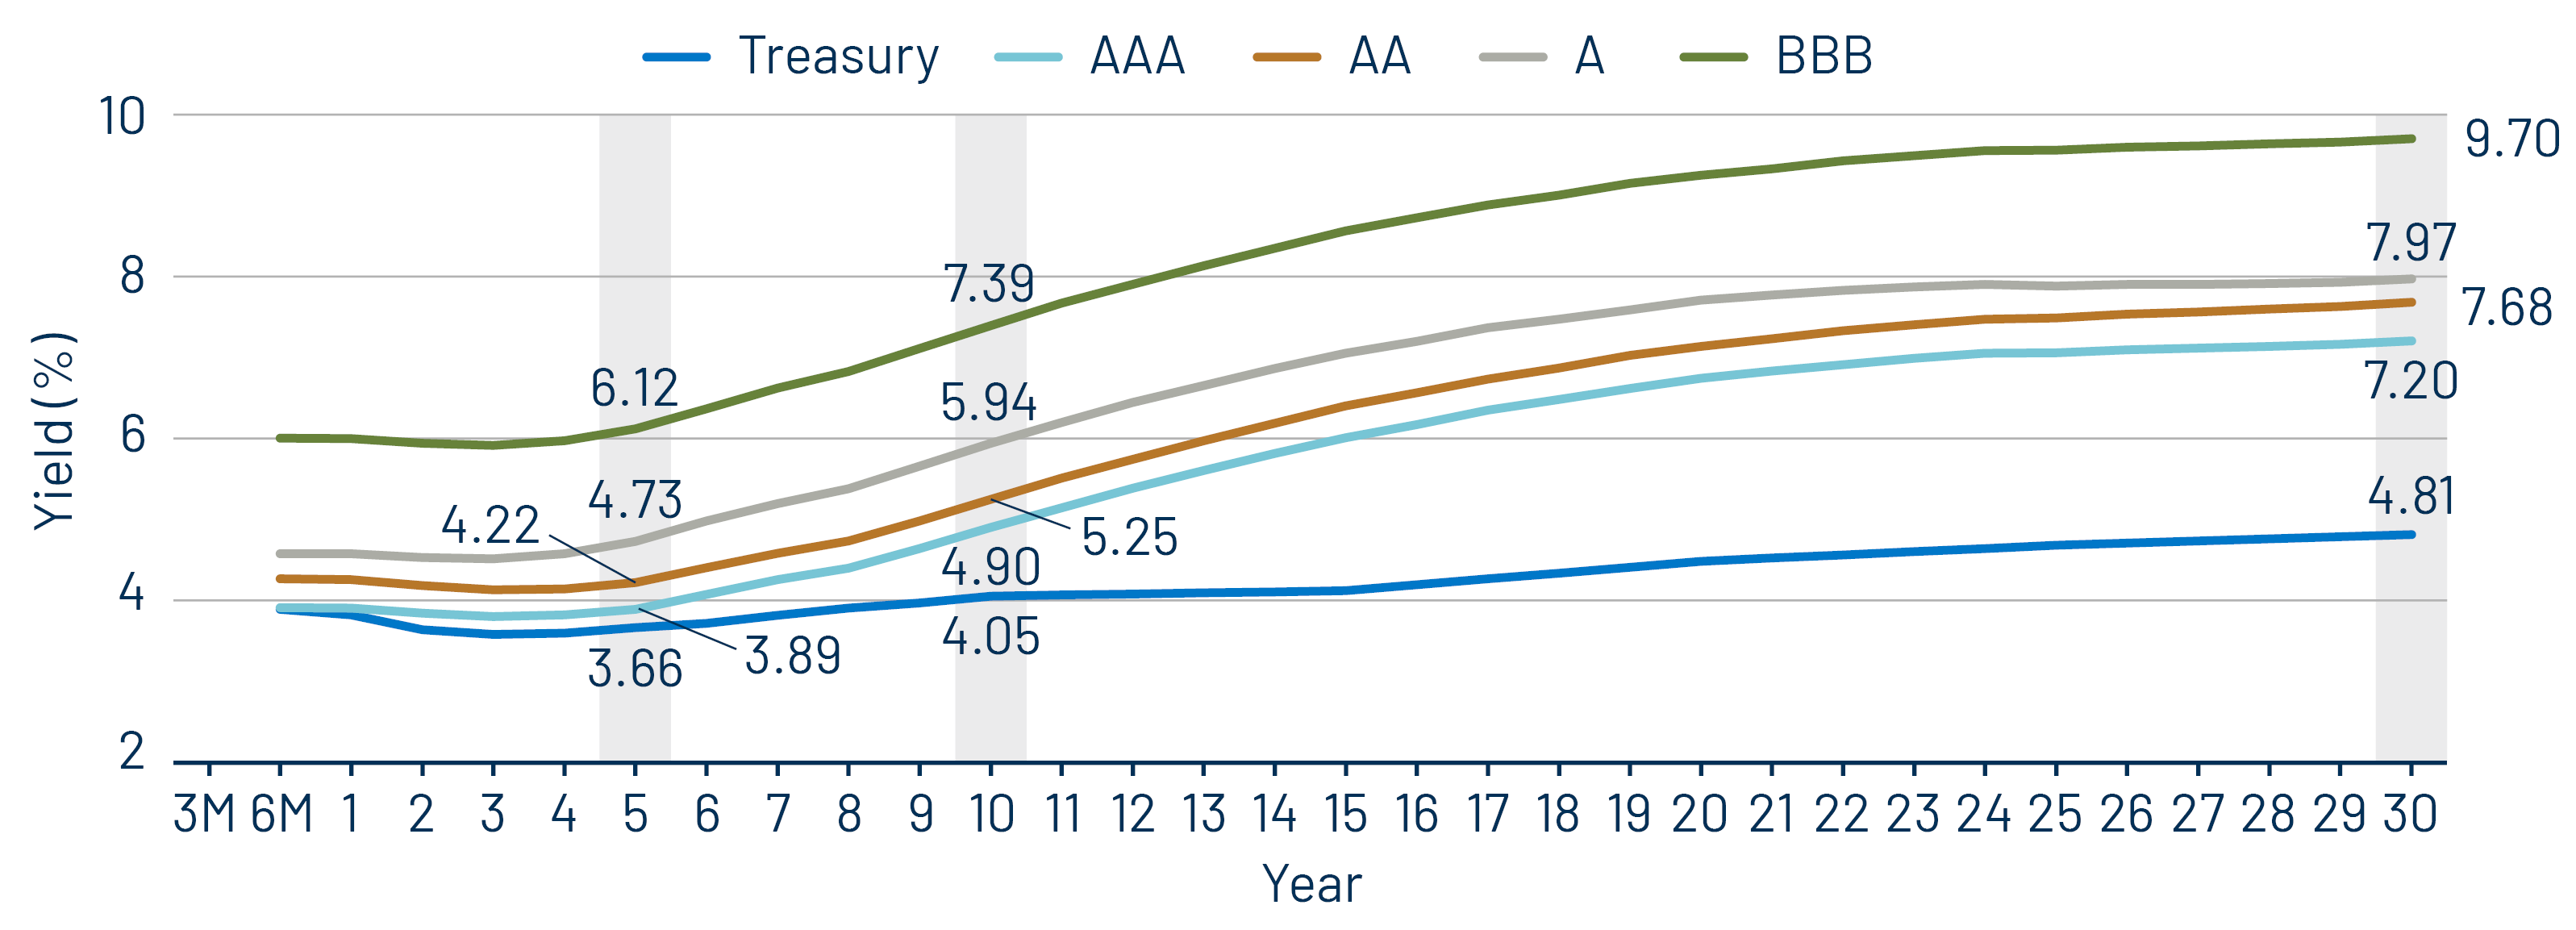
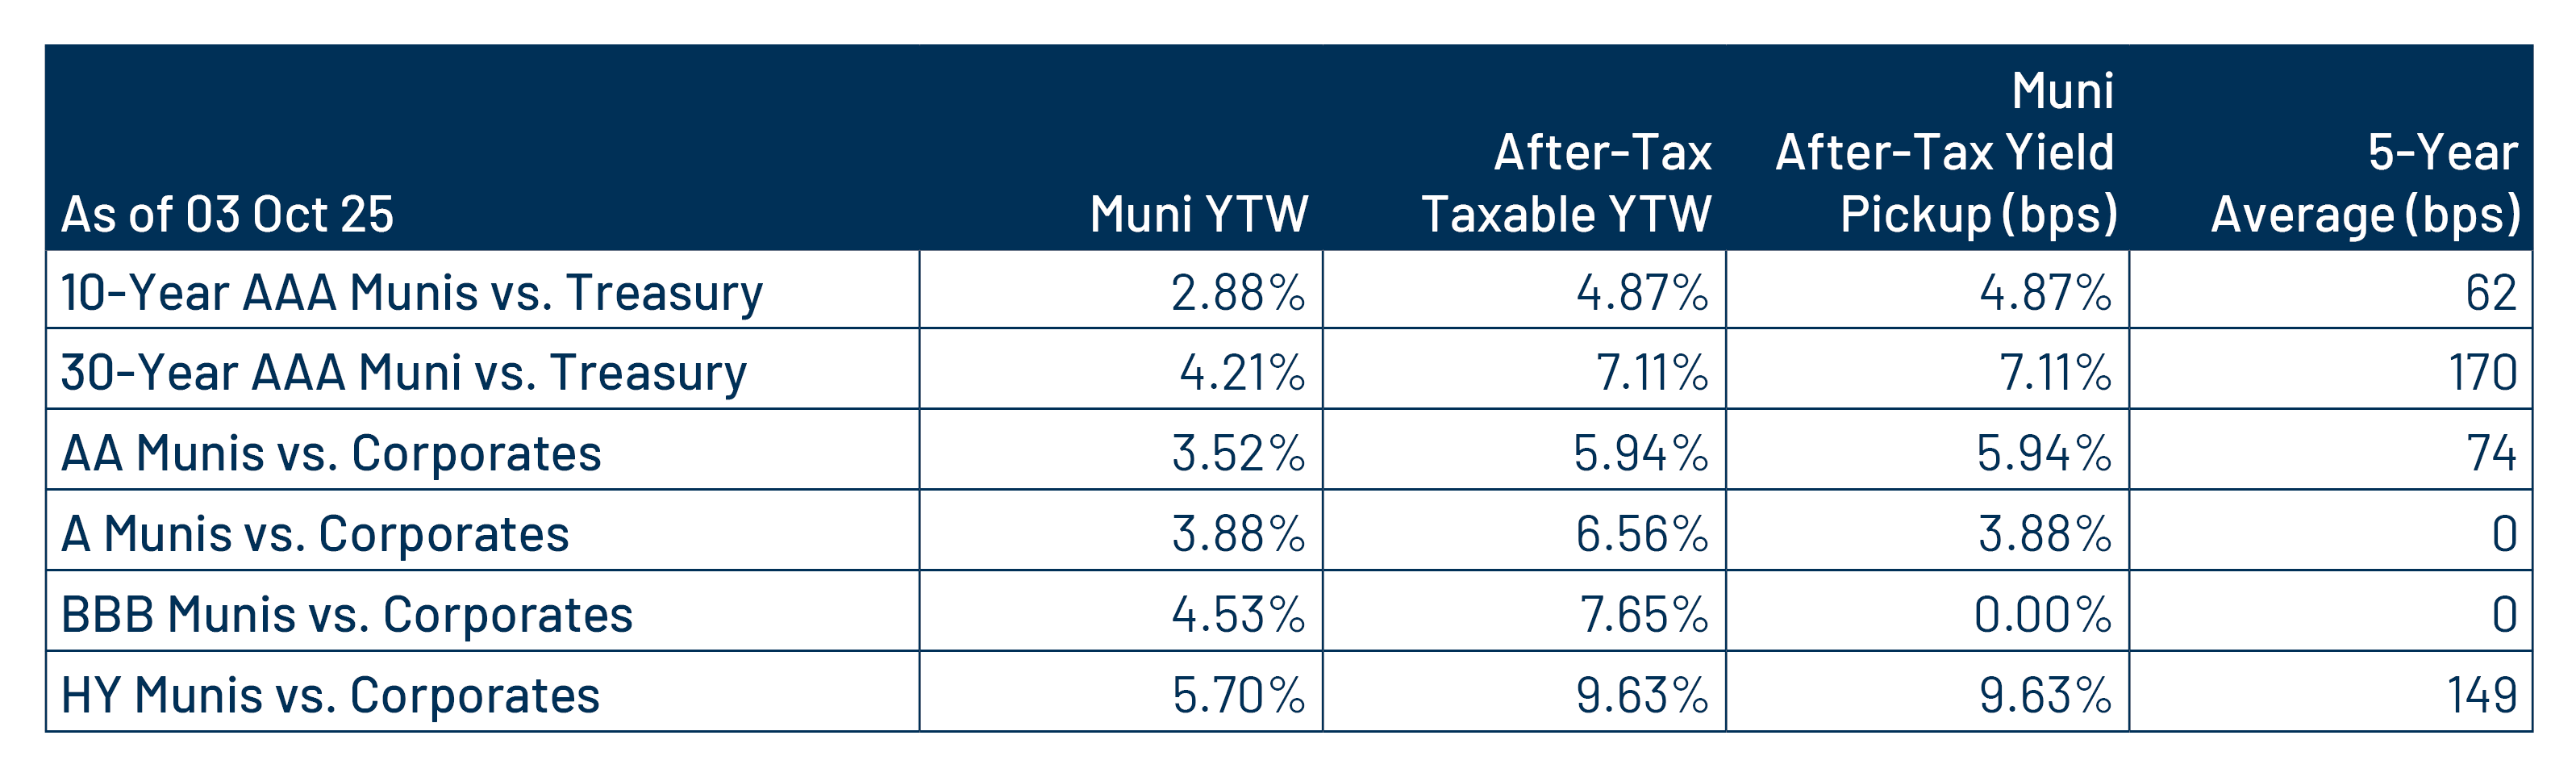
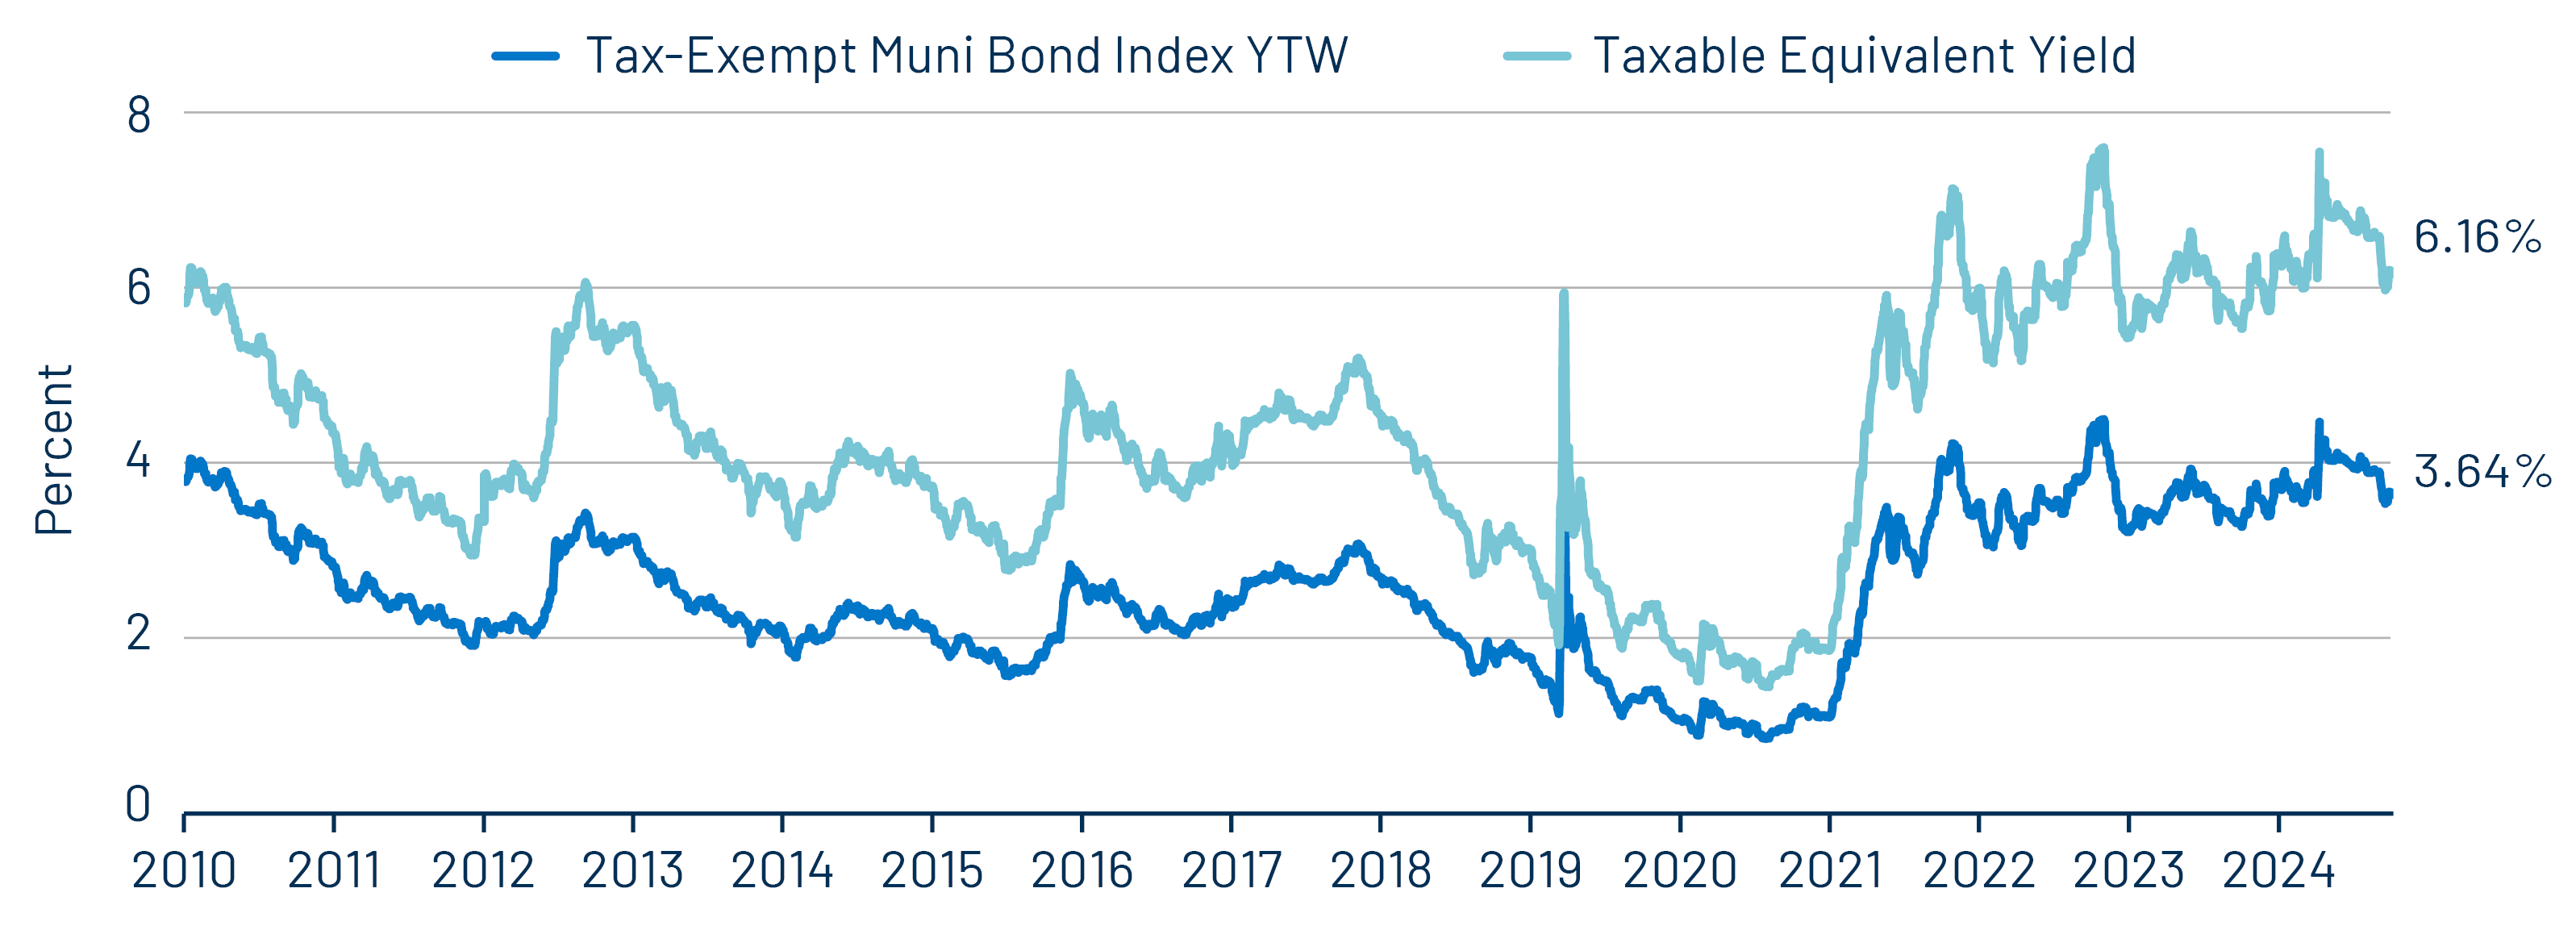
Theme #1: Municipal taxable-equivalent yields and income opportunities remain near decade-high levels.
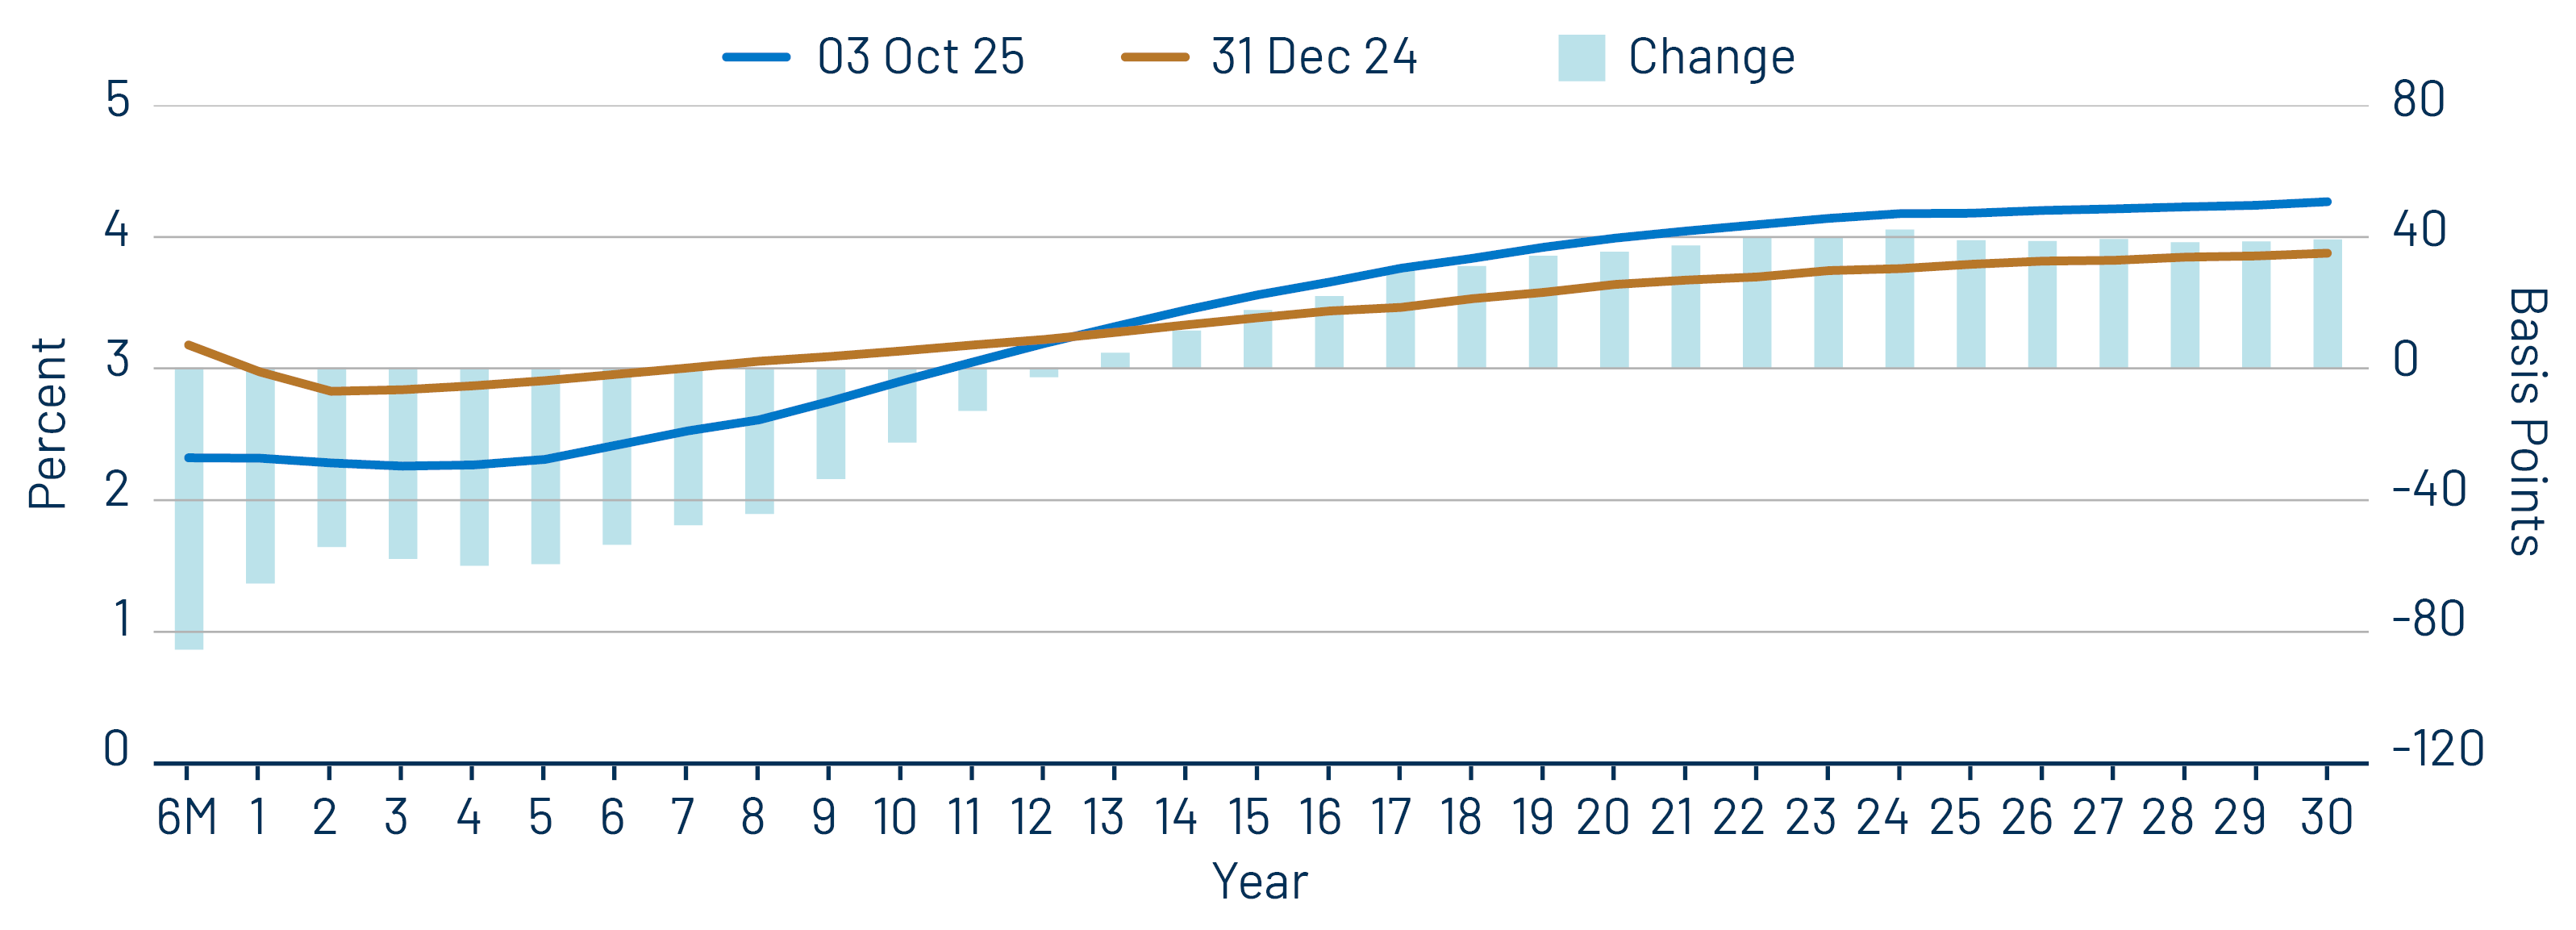
Theme #2: The AAA muni curve has steepened this year, offering better value in intermediate and longer maturities.
Theme #3: Munis offer attractive after-tax yield compared to taxable alternatives.