

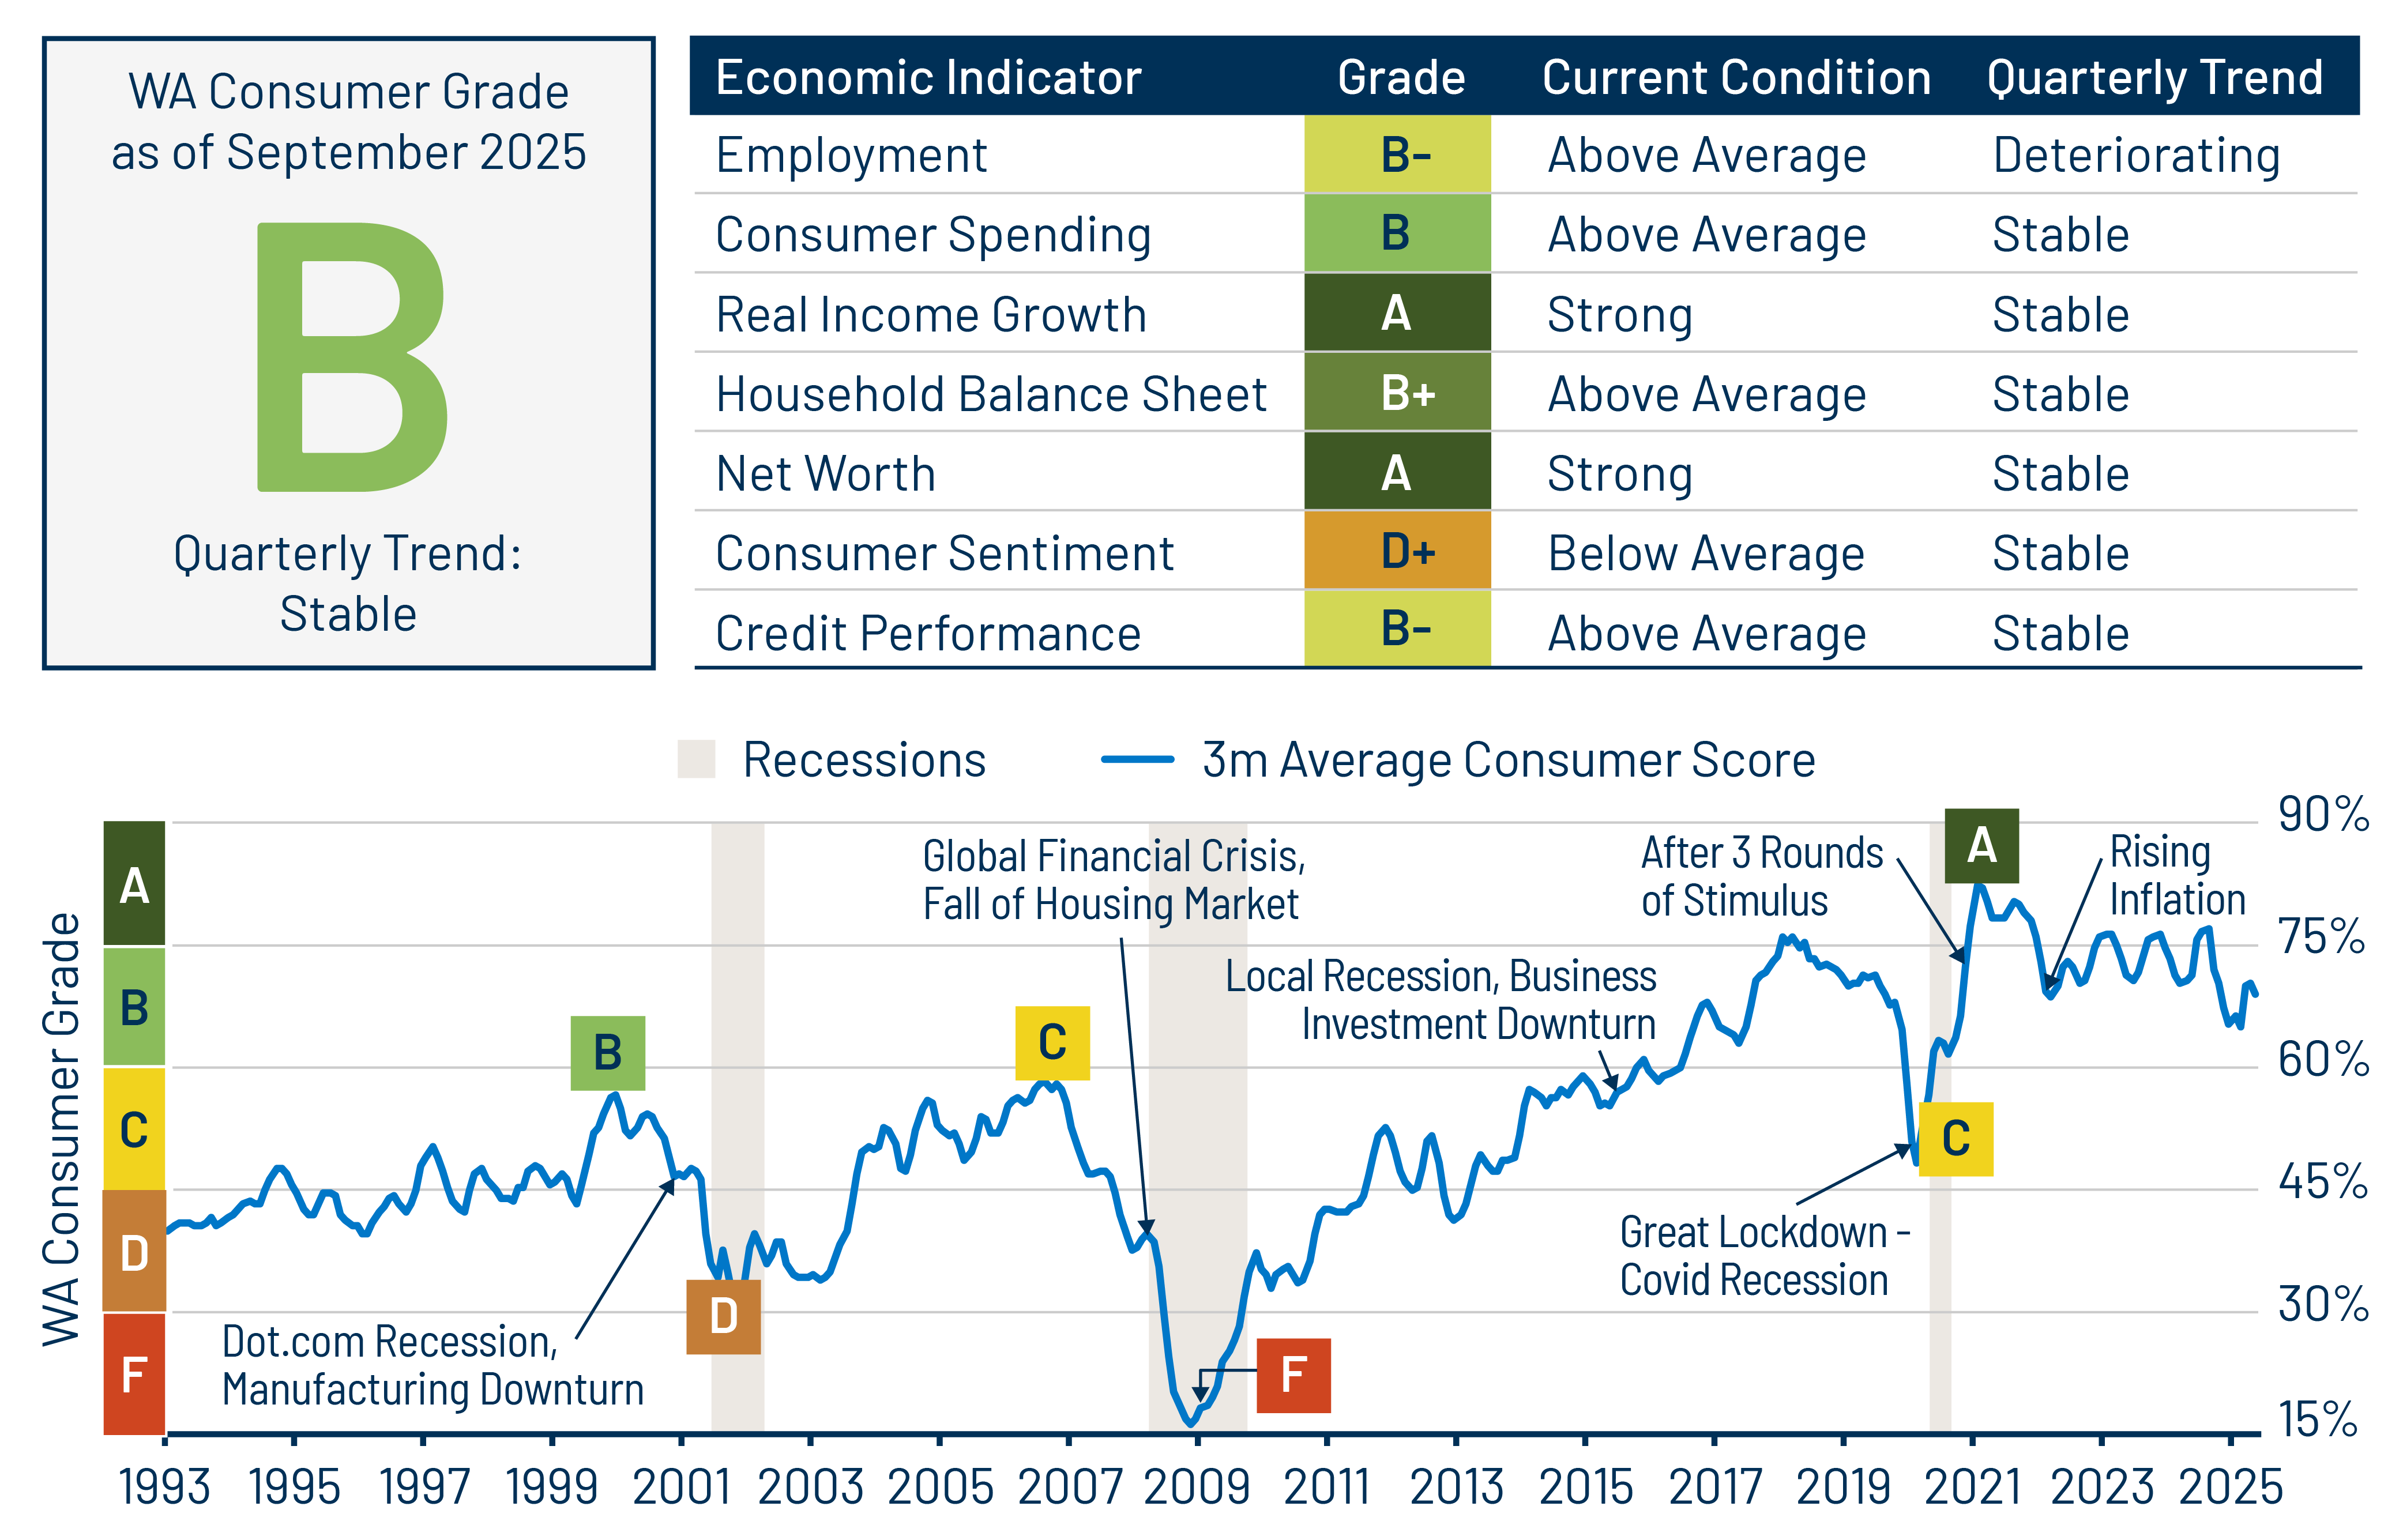
Overall Score: B
Trend: Stable
We assign the US consumer a strong grade of B for the third quarter, with a stable quarterly trend. In Q3, the US consumer showed signs of further cooling in the labor market and softer spending, but stronger net worth, while other metrics remained stable. Consumer sentiment is still hovering near recent lows, reflecting uncertainty about the impact of inflation and tariffs. The ongoing cooling from peak pandemic-era stimulus suggests the economy is gradually returning to its longer-term trend. The current score of B (69%) remains well above the average score of C+ (55%) seen from 2010 to 2019. We expect further deterioration in economic indicators over the next few quarters given the challenging macroeconomic backdrop due to the uncertainty regarding tariffs along with higher inflation putting further pressure on US consumers’ financial health.
Employment: B-
Trend: Deteriorating
The unemployment rate increased to 4.4% in September, rising gradually from 4.1% in June. Looking beyond the headline figure, job growth was soft and nonfarm payroll growth remained weak. Private jobs data releases show muted hiring by private employers as well in September. Looking ahead, US employers announced much higher than expected job cuts in October, up 175% from October 2024. We expect the labor market to remain under pressure due to a slowdown in immigration and government hiring, which will likely affect payroll growth.
Consumer Spending: B
Trend: Stable
Real consumer spending for July and August was resilient. September credit card household data indicates that spending growth rose slightly from August, remaining resilient, at a 2% year-over-year (YoY) pace. Lower-income household spending growth remains muted compared to middle- and higher-income groups due to softer wage gains. Tariff inflation has yet to significantly affect consumer spending, but we expect it to materialize in the upcoming quarters as tariffs weigh on purchasing power and slowing job growth likely leads to lower compensation.
Real Income Growth: A
Trend: Stable
Real disposable income growth remained stable, rising 2% YoY in July and August. Income growth for Q3 held in strong for higher-income households at 4%, while slowing down to 1.4% for low-income households. As labor demand continues to slow and inflation accelerates in the upcoming quarters, we expect to see a sharper decline in real income growth. Looking ahead in 2026, tax refunds are expected to be larger than in past years due to tax policy changes in the Big Beautiful Bill Act, benefiting low- and middle-income consumers, providing a temporary boost to consumer real incomes, and consequently purchasing power.
Household Balance Sheets: B+
Trend: Stable
Consumer credit growth rose in Q3 at an annualized rate of 2.7%. Revolving debt grew 2%, continuing to decelerate, while fixed-rate debt increased 2.9%. Household leverage and debt servicing costs remain low by historical standards, even though bifurcation between higher- and lower-income consumers persists. A subset of consumers who took out debt in the past three years shows signs of increased leverage and weaker performance.
Wealth/Net Worth: A
Trend: Stable
The net-worth to disposable income personal income ratio has increased to near its all-time high following strong equity price gains in the second quarter. Net worth rose 6.1% YoY by the end of Q2, with higher-net-worth and higher-income households posting most of the gains. The savings rate ticked up to 4.6% in August, broadly consistent with observed balance-sheet strength. Liquid deposits remain elevated relative to pre-pandemic levels.
Consumer Sentiment: D+
Trend: Stable
The University of Michigan consumer sentiment index declined further in Q3 and remains weakest among lower-income households. The Conference Board consumer sentiment index also fell. Both surveys hover close to year-to-date lows as employment expectations continue to weaken. Consumer sentiment is expected to remain volatile over the next few months.
Credit Performance: B-
Trend: Stable
in Q3, lower-income borrowers led the YoY deterioration in serious delinquencies across consumer products. While prime auto and credit card performance has stabilized, subprime auto and federal student loans deteriorated further.
Credit card delinquencies of 30+ days continued to level off in Q3, as both new and seriously delinquent balances fell further from June. US bankcard originations increased 8.6% YoY in Q3, led by subprime and super-prime consumer credit. Utilization rates remain steady.
Auto loan originations grew 5.2% in Q3 amid tariff threats, but remain 8.4% below pre-pandemic levels. Affordability continues to be challenged as monthly payments are trending higher. 60+ day delinquencies across the credit spectrum trended higher than expected for subprime auto borrowers, while prime consumers show stability in delinquency levels. Private student loans also show stability in performance, a product that caters to the higher-credit consumer.
Delinquencies on federal student loans remain elevated, reaching 14.4%, exceeding pre-Covid levels, and a small number of borrowers have had their wages garnished. We expect delinquencies to keep rising, led by lower-income borrowers. Personal loans show the greatest increase in origination volume, up 26% YoY. Credit performance shows slight deterioration led by the youngest consumers but remains at pre-pandemic levels.
Larger lenders have tightened lending standards across the credit spectrum, which should limit further deterioration. We continue to favor high-quality consumer credit such as prime auto and private student loans, along with sectors related to housing. In addition, we lean toward positions higher up in the capital structure and remain cautious on subprime consumer assets.
Background on Methodology
Our methodology rationale for creating the US Consumer Report Card first involves ranking economic indicators versus a historical dataset, with tracked periodic changes going back to 1990. We then calculate a weighted average score for each month. Assigned weights range from a high of 23% to a low of 10%. Employment, consumer spending and real income growth make up 60%, while the remaining indicators comprise 40%. The consumer score is mapped against letter grades, normalized for historical experience.