skip navigation
Blog

Stay up to date on timely topics and market events. Subscribe to our Blog now.

MARKETS
16 March 2021

Weekly Municipal Monitor—Munis Get Their Stimulus

By Dave Fare, Sam Weitzman

Stay up to date on timely topics and market events. Subscribe to our Blog now.

Municipal Yields Continued to Grind Lower Despite Rising Treasury Rates

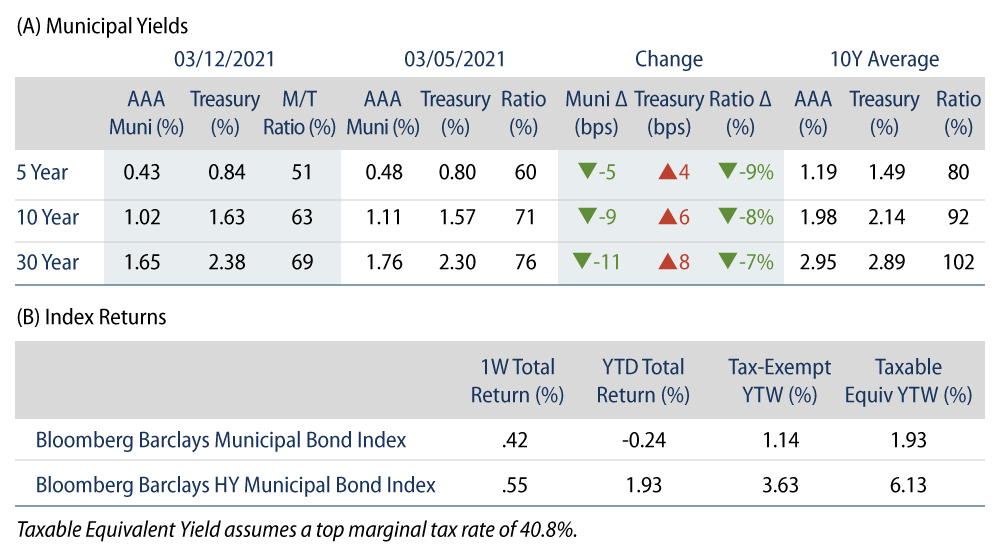
US municipal yields moved lower despite rising Treasuries. AAA municipal yields moved 5-11 bps lower across the curve. Municipals outperformed Treasuries and Municipal/Treasury ratios declined 7%-9%. Muni fund flows turned back into positive territory. The Bloomberg Barclays Municipal Index returned 0.42%, while the HY Muni Index returned 0.55%. This week we provide perspective on Biden’s $1.9 trillion COVID-19 relief package and its impact on munis.

Technicals Strengthen as Fund Flows Turn Positive

Fund Flows: During the week ending March 10, municipal mutual funds recorded $1.1 billion of net inflows following the outflows observed last week. Long-term funds recorded $663 million of inflows, high-yield funds recorded $430 million of inflows and intermediate funds recorded $167 million of inflows. Year-to-date (YTD) net inflows stand at $29.3 billion.

Supply: The muni market recorded $10.1 billion of new-issue volume during the week, up 13% from the prior week. Total issuance YTD of $79.2 billion is in line with last year's levels, but tax-exempt issuance is trending down 4.5% year-over-year while taxable issuance is 11.3% higher. This week's new-issue calendar is expected to reach $11.2 billion, up 11% from the prior week. The largest deals include $2.3 billion Dormitory Authority of the State of New York (state personal income tax revenue bonds) and $1.3 billion state of Illinois transactions.

This Week in Munis: Munis Get Their Stimulus

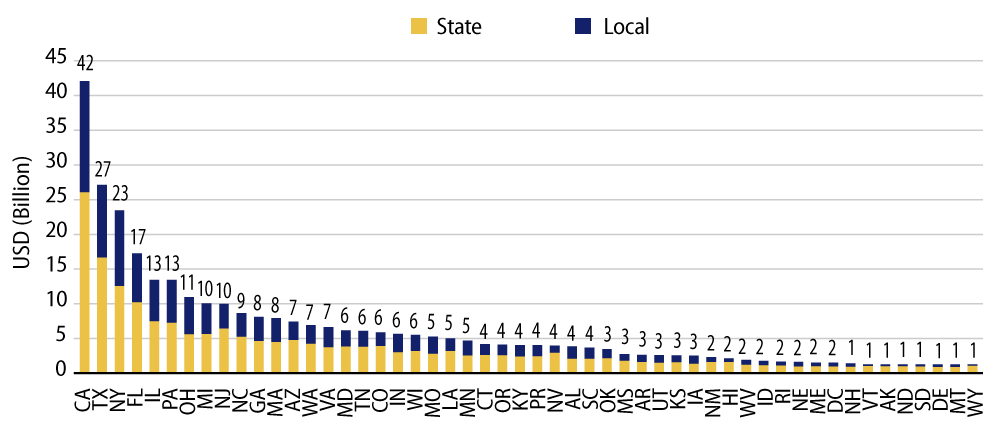
State and local governments finally received their hotly contested direct stimulus funding as Congress passed the $1.9 trillion American Rescue Plan Act relief package, which provides $350 billion of direct aid to states and local municipalities. States will receive $195.3 billion and local governments will receive $130.2 billion. The majority of state funds will be distributed based on the overall share of unemployment. From the local government perspective, counties will receive $65.1 billion, metropolitan cities will receive $45.6 billion, and small cities will receive $19.5 billion. Other municipal revenue sectors will also stand to benefit as the overall stimulus package targets health care, transportation, education and housing sectors.

Exhibit 1: American Rescue Plan Act—$350 Billion State and Local Aid (by State)
Explore American Rescue Plan Act—$350 Billion State and Local Aid (by State).
Source: House Committee on Oversight and Reform. As of 08 Mar 21. Select the image to expand the view.

The need for direct state and local aid was up for debate, as state revenues have fared better than originally anticipated, attributable to the economic impact of the unprecedented stimulus packages passed in 2020 that bolstered tax collections. The state of California, which initially projected a $54 billion two-year deficit due to the pandemic, is now projecting a $15 billion surplus for the current fiscal year.

While revenues proved better than initially feared, not all states are impacted by the pandemic equally and budget stress is still evident in the declining state and local payroll figures. State and local employment is still down 1.4 million from pre-pandemic highs, which should continue to constrain domestic and regional growth.

Rating agencies are also taking note, as the state of Illinois once again staved off a high-yield rating downgrade ahead of this week's deal. Moody's affirmed the state's BBB- rating while removing a negative watch, and Fitch affirmed its BBB-/negative rating citing that the state's revenues have exceeded enacted budget expectations and stimulus measures that “may provide an immediate boost to state's fiscal resilience.” Moody's also upgraded the Chicago Board of Education's rating to Ba3 from B1, citing “softening of revenue sources is offset with a very sizable infusion of federal funds from several rounds of pandemic relief aid.”

Exhibit 2: Municipal Bond Yields and Index Return
Explore Municipal Bond Yields and Index Return.
Sources: (A) Muni yields: Thomson Reuters MMD; Treasury Yields: Bloomberg. As of 12 Mar 21.
(B) Bloomberg. As of 12 Mar 21. Select the image to expand the view.
Exhibit 3: Tax-Exempt and Taxable Municipal Valuation
Explore Tax-Exempt and Taxable Municipal Valuation.
Sources: (A) Bloomberg, Western Asset. AAA, AA, A, BBB Corporate Indices. After-tax yield assumes a top effective tax rate of 40.8%. As of 12 Mar 21.
(B) Bloomberg, Western Asset; Taxable Muni Index Corporate comparable used is the long corporate (ex. BBB) to better align credit quality and duration. Select the image to expand the view.
© Western Asset Management Company, LLC 2024. The information contained in these materials ("the materials") is intended for the exclusive use of the designated recipient ("the recipient"). This information is proprietary and confidential and may contain commercially sensitive information, and may not be copied, reproduced or republished, in whole or in part, without the prior written consent of Western Asset Management Company ("Western Asset").
Past performance does not predict future returns. These materials should not be deemed to be a prediction or projection of future performance. These materials are intended for investment professionals including professional clients, eligible counterparties, and qualified investors only.
These materials have been produced for illustrative and informational purposes only. These materials contain Western Asset's opinions and beliefs as of the date designated on the materials; these views are subject to change and may not reflect real-time market developments and investment views.
Third party data may be used throughout the materials, and this data is believed to be accurate to the best of Western Asset's knowledge at the time of publication, but cannot be guaranteed. These materials may also contain strategy or product awards or rankings from independent third parties or industry publications which are based on unbiased quantitative and/or qualitative information determined independently by each third party or publication. In some cases, Western Asset may subscribe to these third party's standard industry services or publications. These standard subscriptions and services are available to all asset managers and do not influence rankings or awards in any way.
Investment strategies or products discussed herein may involve a high degree of risk, including the loss of some or all capital. Investments in any products or strategies described in these materials may be volatile, and investors should have the financial ability and willingness to accept such risks.
Unless otherwise noted, investment performance contained in these materials is reflective of a strategy composite. All other strategy data and information included in these materials reflects a representative portfolio which is an account in the composite that Western Asset believes most closely reflects the current portfolio management style of the strategy. Performance is not a consideration in the selection of the representative portfolio. The characteristics of the representative portfolio shown may differ from other accounts in the composite. Information regarding the representative portfolio and the other accounts in the composite are available upon request. Statements in these materials should not be considered investment advice. References, either general or specific, to securities and/or issuers in the materials are for illustrative purposes only and are not intended to be, and should not be interpreted as, recommendation to purchase or sell such securities. Employees and/or clients of Western Asset may have a position in the securities or issuers mentioned.
These materials are not intended to provide, and should not be relied on for, accounting, legal, tax, investment or other advice. The recipient should consult its own counsel, accountant, investment, tax, and any other advisers for this advice, including economic risks and merits, related to making an investment with Western Asset. The recipient is responsible for observing the applicable laws and regulations of their country of residence.
Founded in 1971, Western Asset Management Company is a global fixed-income investment manager with offices in Pasadena, New York, London, Singapore, Tokyo, Melbourne, São Paulo, Hong Kong, and Zürich. Western Asset is a wholly owned subsidiary of Franklin Resources, Inc. but operates autonomously. Western Asset is comprised of six legal entities across the globe, each with distinct regional registrations: Western Asset Management Company, LLC, a registered Investment Adviser with the Securities and Exchange Commission; Western Asset Management Company Distribuidora de Títulos e Valores Mobiliários Limitada is authorized and regulated by Comissão de Valores Mobiliários and Brazilian Central Bank; Western Asset Management Company Pty Ltd ABN 41 117 767 923 is the holder of the Australian Financial Services License 303160; Western Asset Management Company Pte. Ltd. Co. Reg. No. 200007692R is a holder of a Capital Markets Services License for fund management and regulated by the Monetary Authority of Singapore; Western Asset Management Company Ltd, a registered Financial Instruments Business Operator and regulated by the Financial Services Agency of Japan; and Western Asset Management Company Limited is authorised and regulated by the Financial Conduct Authority ("FCA") (FRN 145930). This communication is intended for distribution to Professional Clients only if deemed to be a financial promotion in the UK as defined by the FCA. This communication may also be intended for certain EEA countries where Western Asset has been granted permission to do so. For the current list of the approved EEA countries please contact Western Asset at +44 (0)20 7422 3000.