skip navigation
Blog

Stay up to date on timely topics and market events. Subscribe to our Blog now.

MARKETS
03 June 2021

Inflation Update—Temporary or Persistent?

By Richard A. Booth

Stay up to date on timely topics and market events. Subscribe to our Blog now.

Following up on our blog post about the impact of COVID-19 on inflation, this post takes stock of our current inflation views and how market pricing has evolved.

Goods Supply/Demand Mismatch

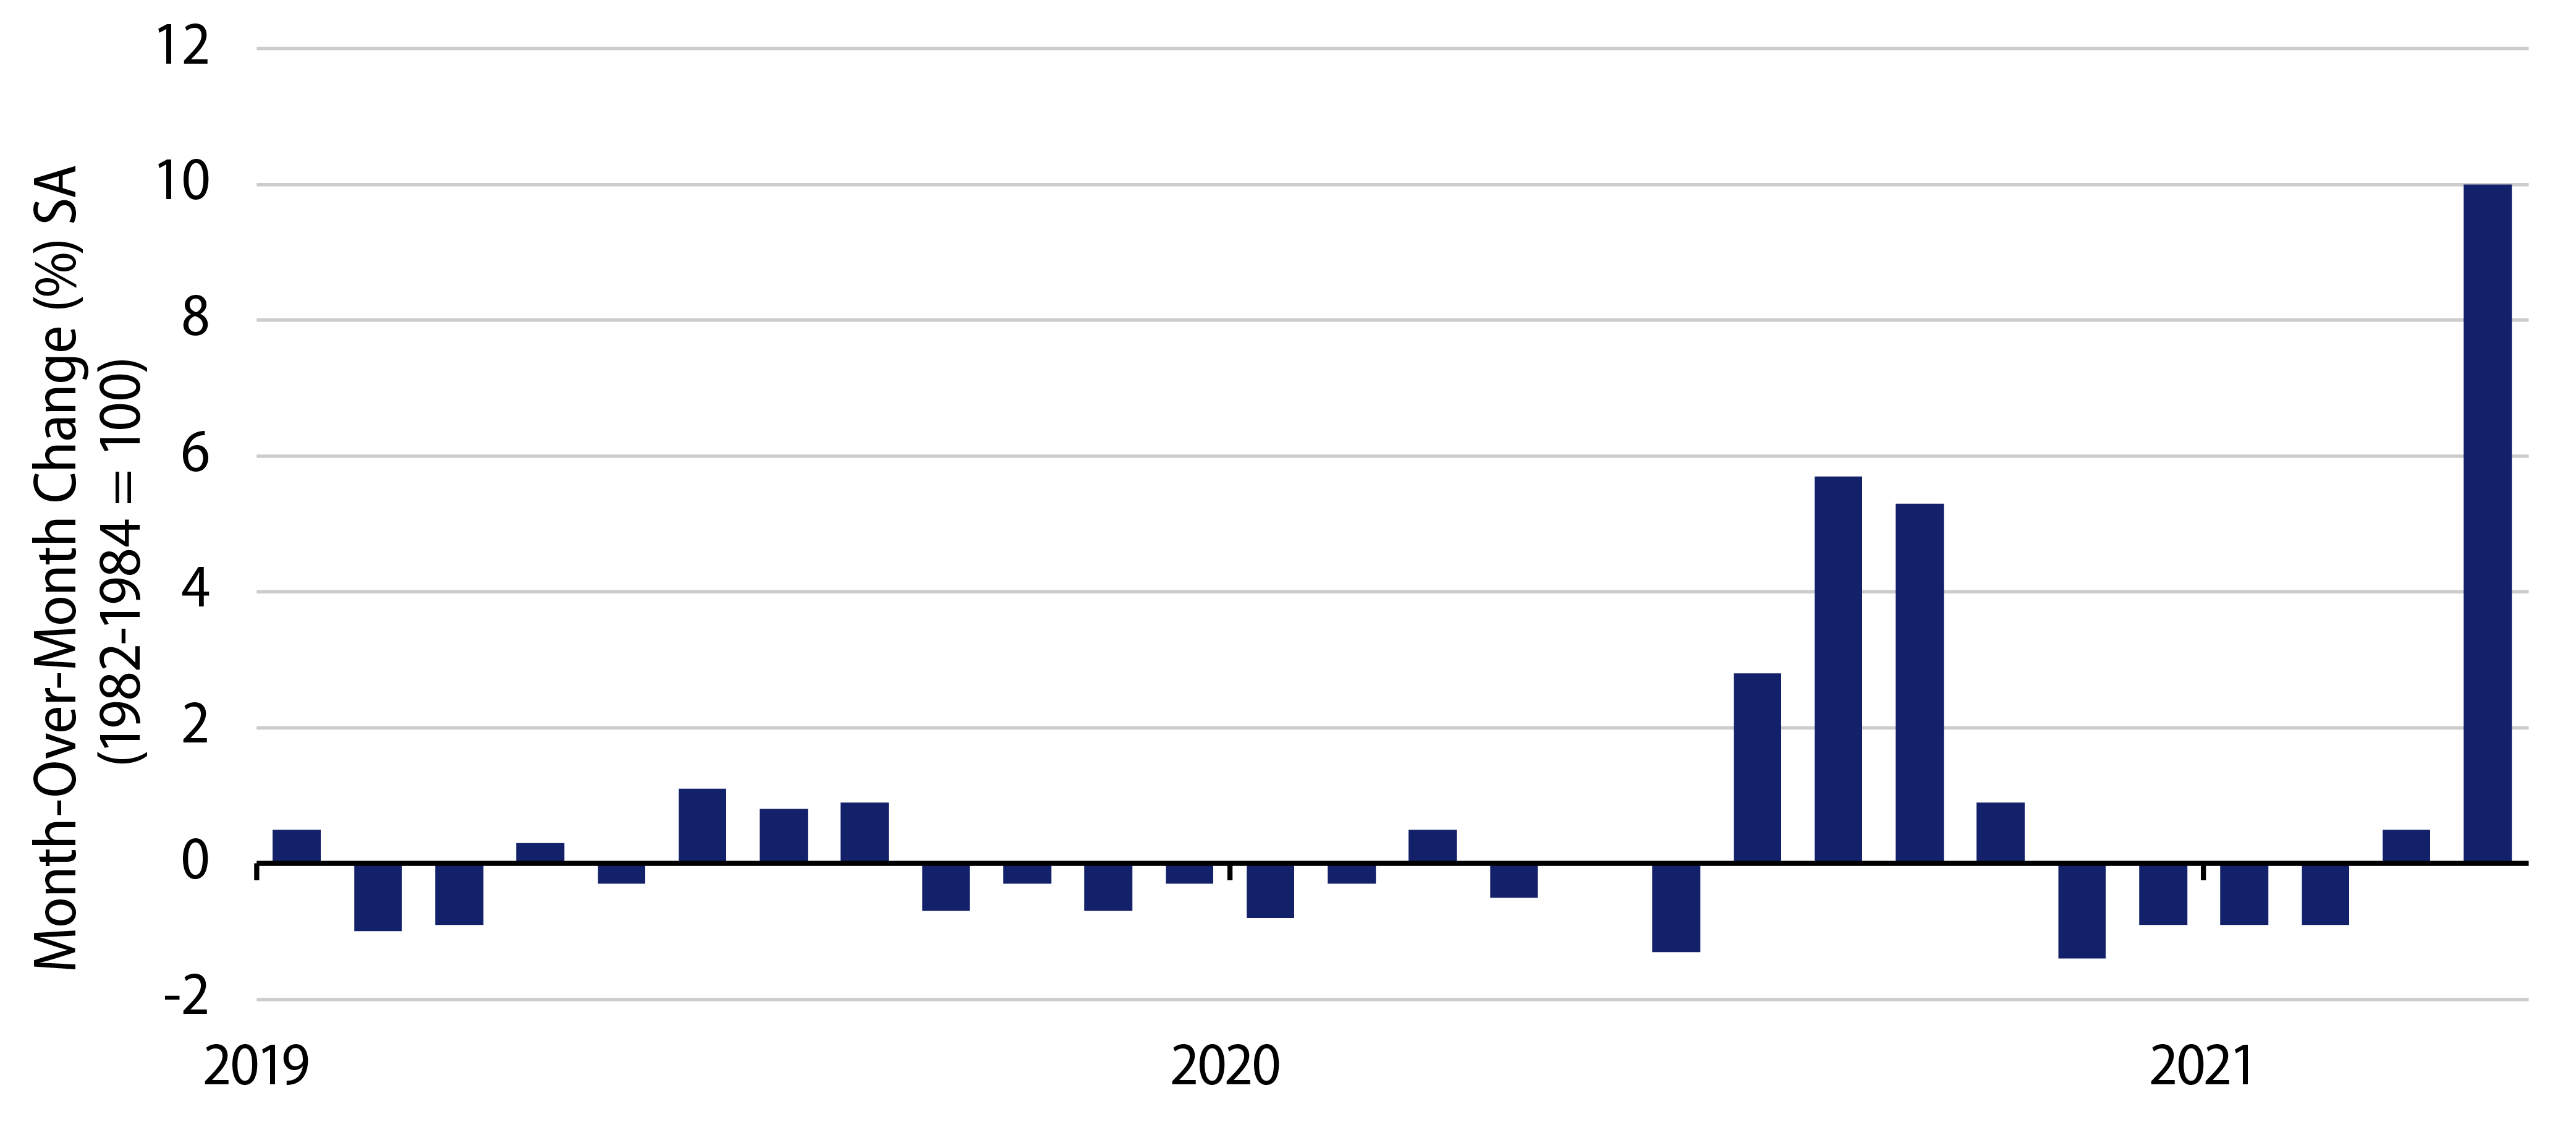
The temporal goods supply/demand mismatch that we highlighted previously is likely at or close to its zenith. This has been at its most extreme in price terms in the US auto sector (Exhibit 1), but it is a much broader global issue. At the start of the crisis, prices for used vehicles fell moderately in part because car rental companies were flooding the market as they slashed their fleets whereas demand fell due to the lockdown restrictions in place. As the first COVID-19 wave passed and economies lightened restrictions last summer, demand returned strongly as many people were unwilling to use public transport, or required cars after having moved from city centres to suburban areas. Mobility—and demand for it—was limited again by the tighter restrictions put in place to combat second and third waves of Covid cases in late 2020. The recent reopening on the back of a rapid vaccination rollout saw demand return swiftly. Car rental companies found it difficult to quickly rebuild inventories from manufacturers due to chip shortages, and instead rebought in the used car market.

Exhibit 1: US Used Cars and Trucks
Explore US Used Cars and Trucks
Source: Bureau of Labor Statistics. As of 30 Apr 21. Select the image to expand the view.

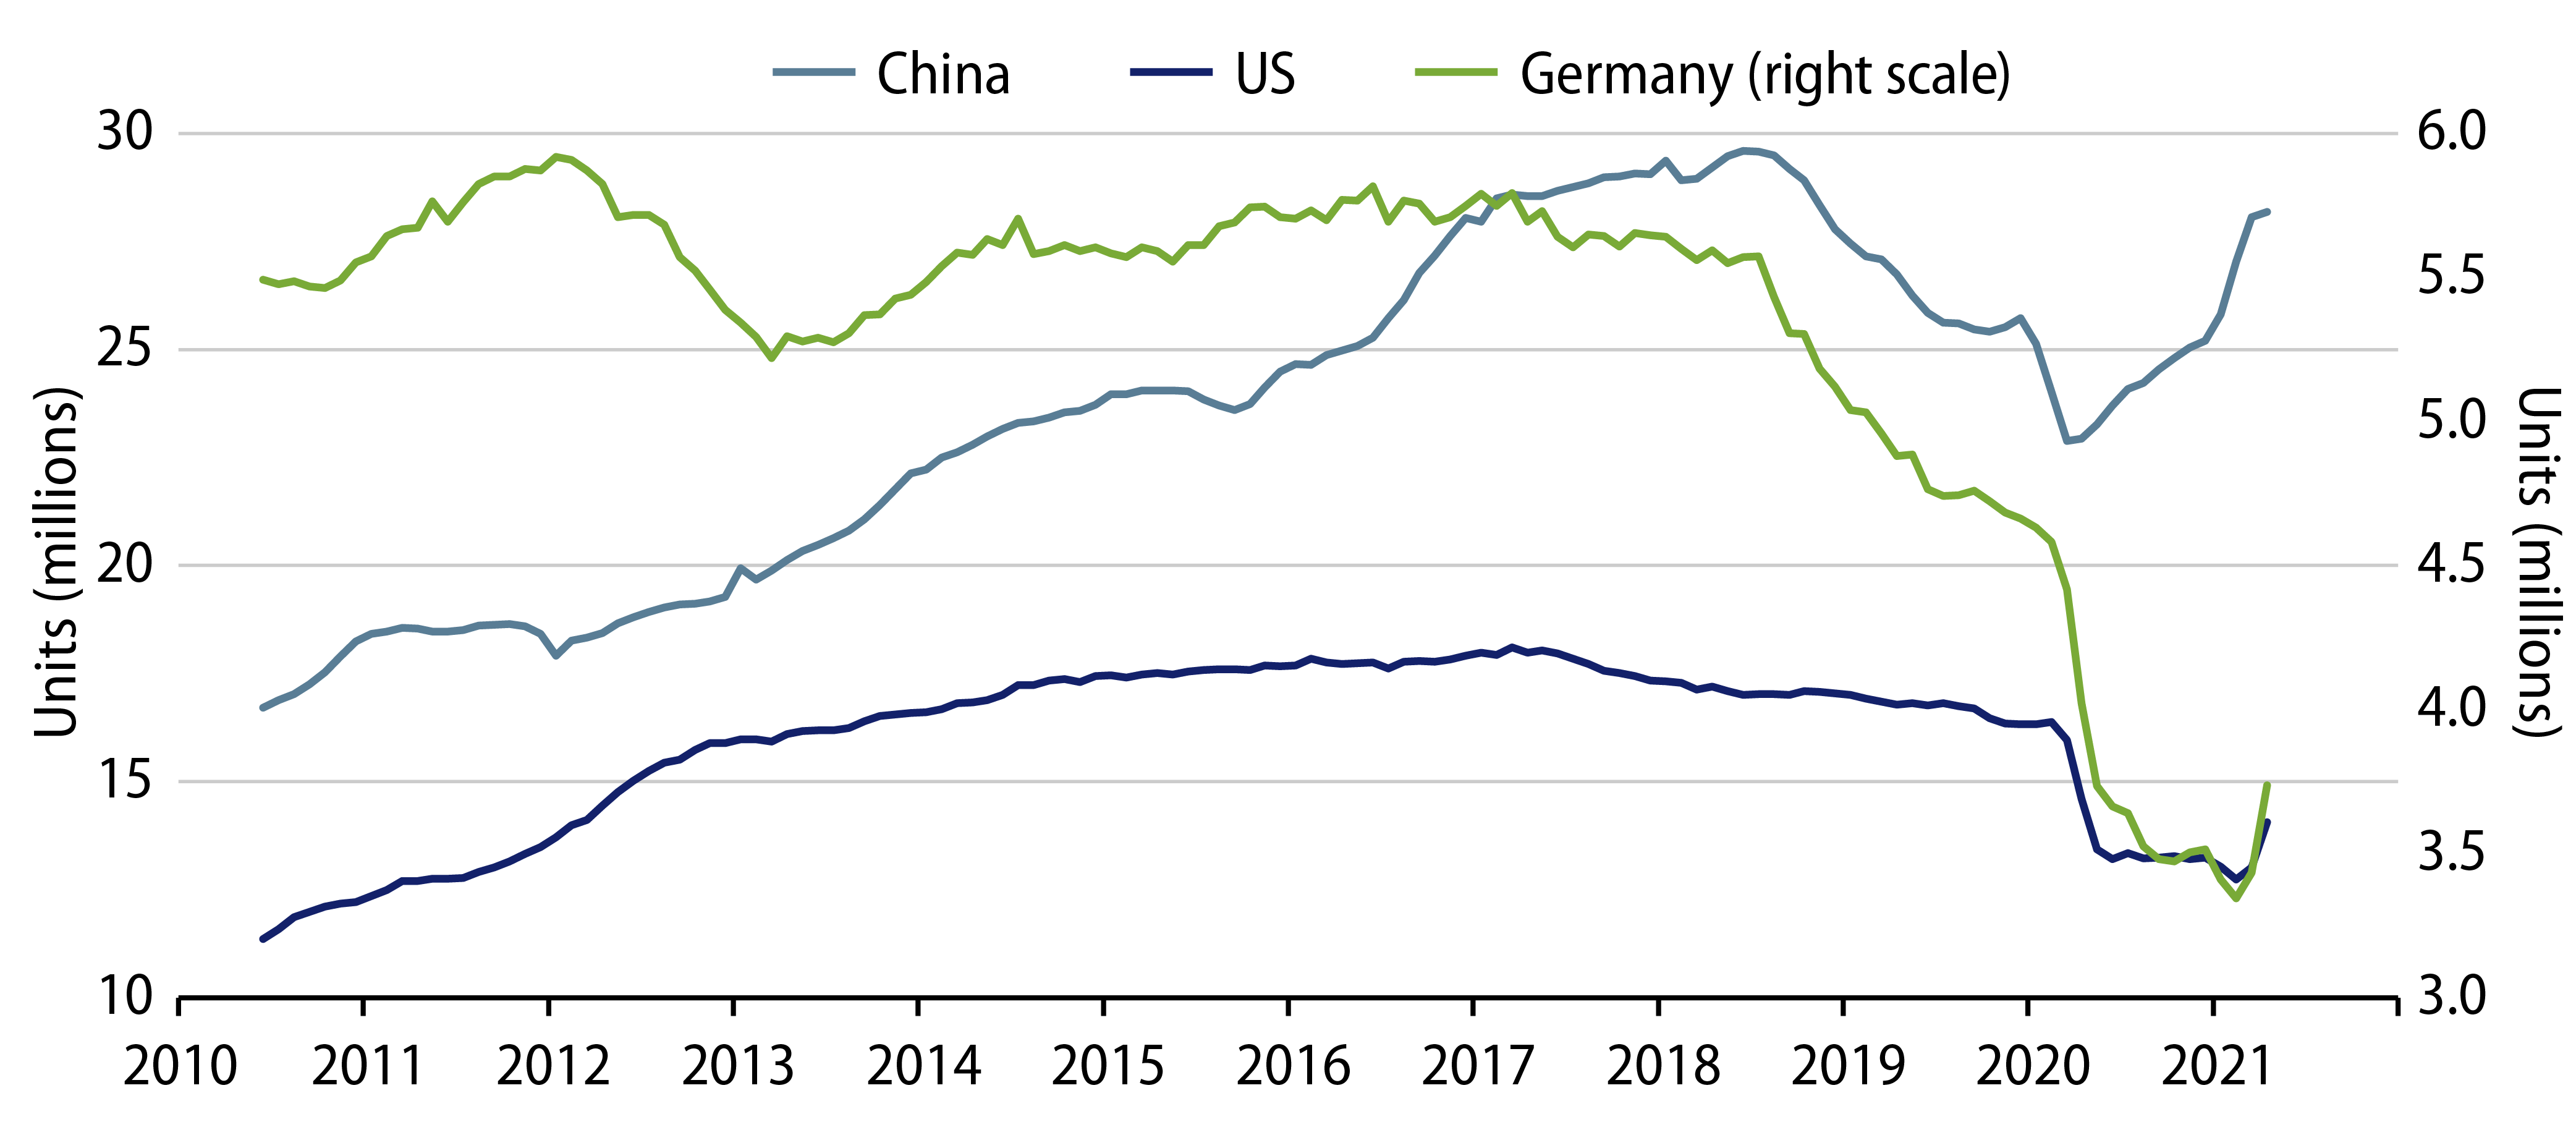
However, Exhibit 2 illustrates the supply side of the equation and here we believe that China’s experience with Covid (first in/first out) gives us confidence that supply will gradually be rebuilt in the US and Europe. Purchasers of new cars have a stronger incentive to sell their older vehicles given the relatively smaller price differential, and this should help calm the frictional inflation wrought by COVID-19.

Exhibit 2: Auto Production (Rolling 12-Month Periods)
Explore Auto Production (Rolling 12-Month Periods)
Source: CAAM, VDA, AUTONEWS, HAVER. As of 30 Apr 21. Select the image to expand the view.

With distinct demand and supply dynamics, it is very hard to see how high the peak in inflation in the used car market will be, but that peak is now very close and supply is catching up. Relative to our expectations when we last wrote, the upside from the supply demand mismatch has been greater and potentially could be slower to reduce. But we do not see this as a persistent new upside to inflation. More broadly as consumption swings back from goods to services, those areas which saw increased work-from-home price pressure should begin to retrace. We've seen this in recent inflation prints in the UK and would expect this in other regions going forward as global reopening trends continue. Come the summer in the US used car prices likely will be detracting from headline inflation.

Commodities, China PPI and Global Goods Pricing

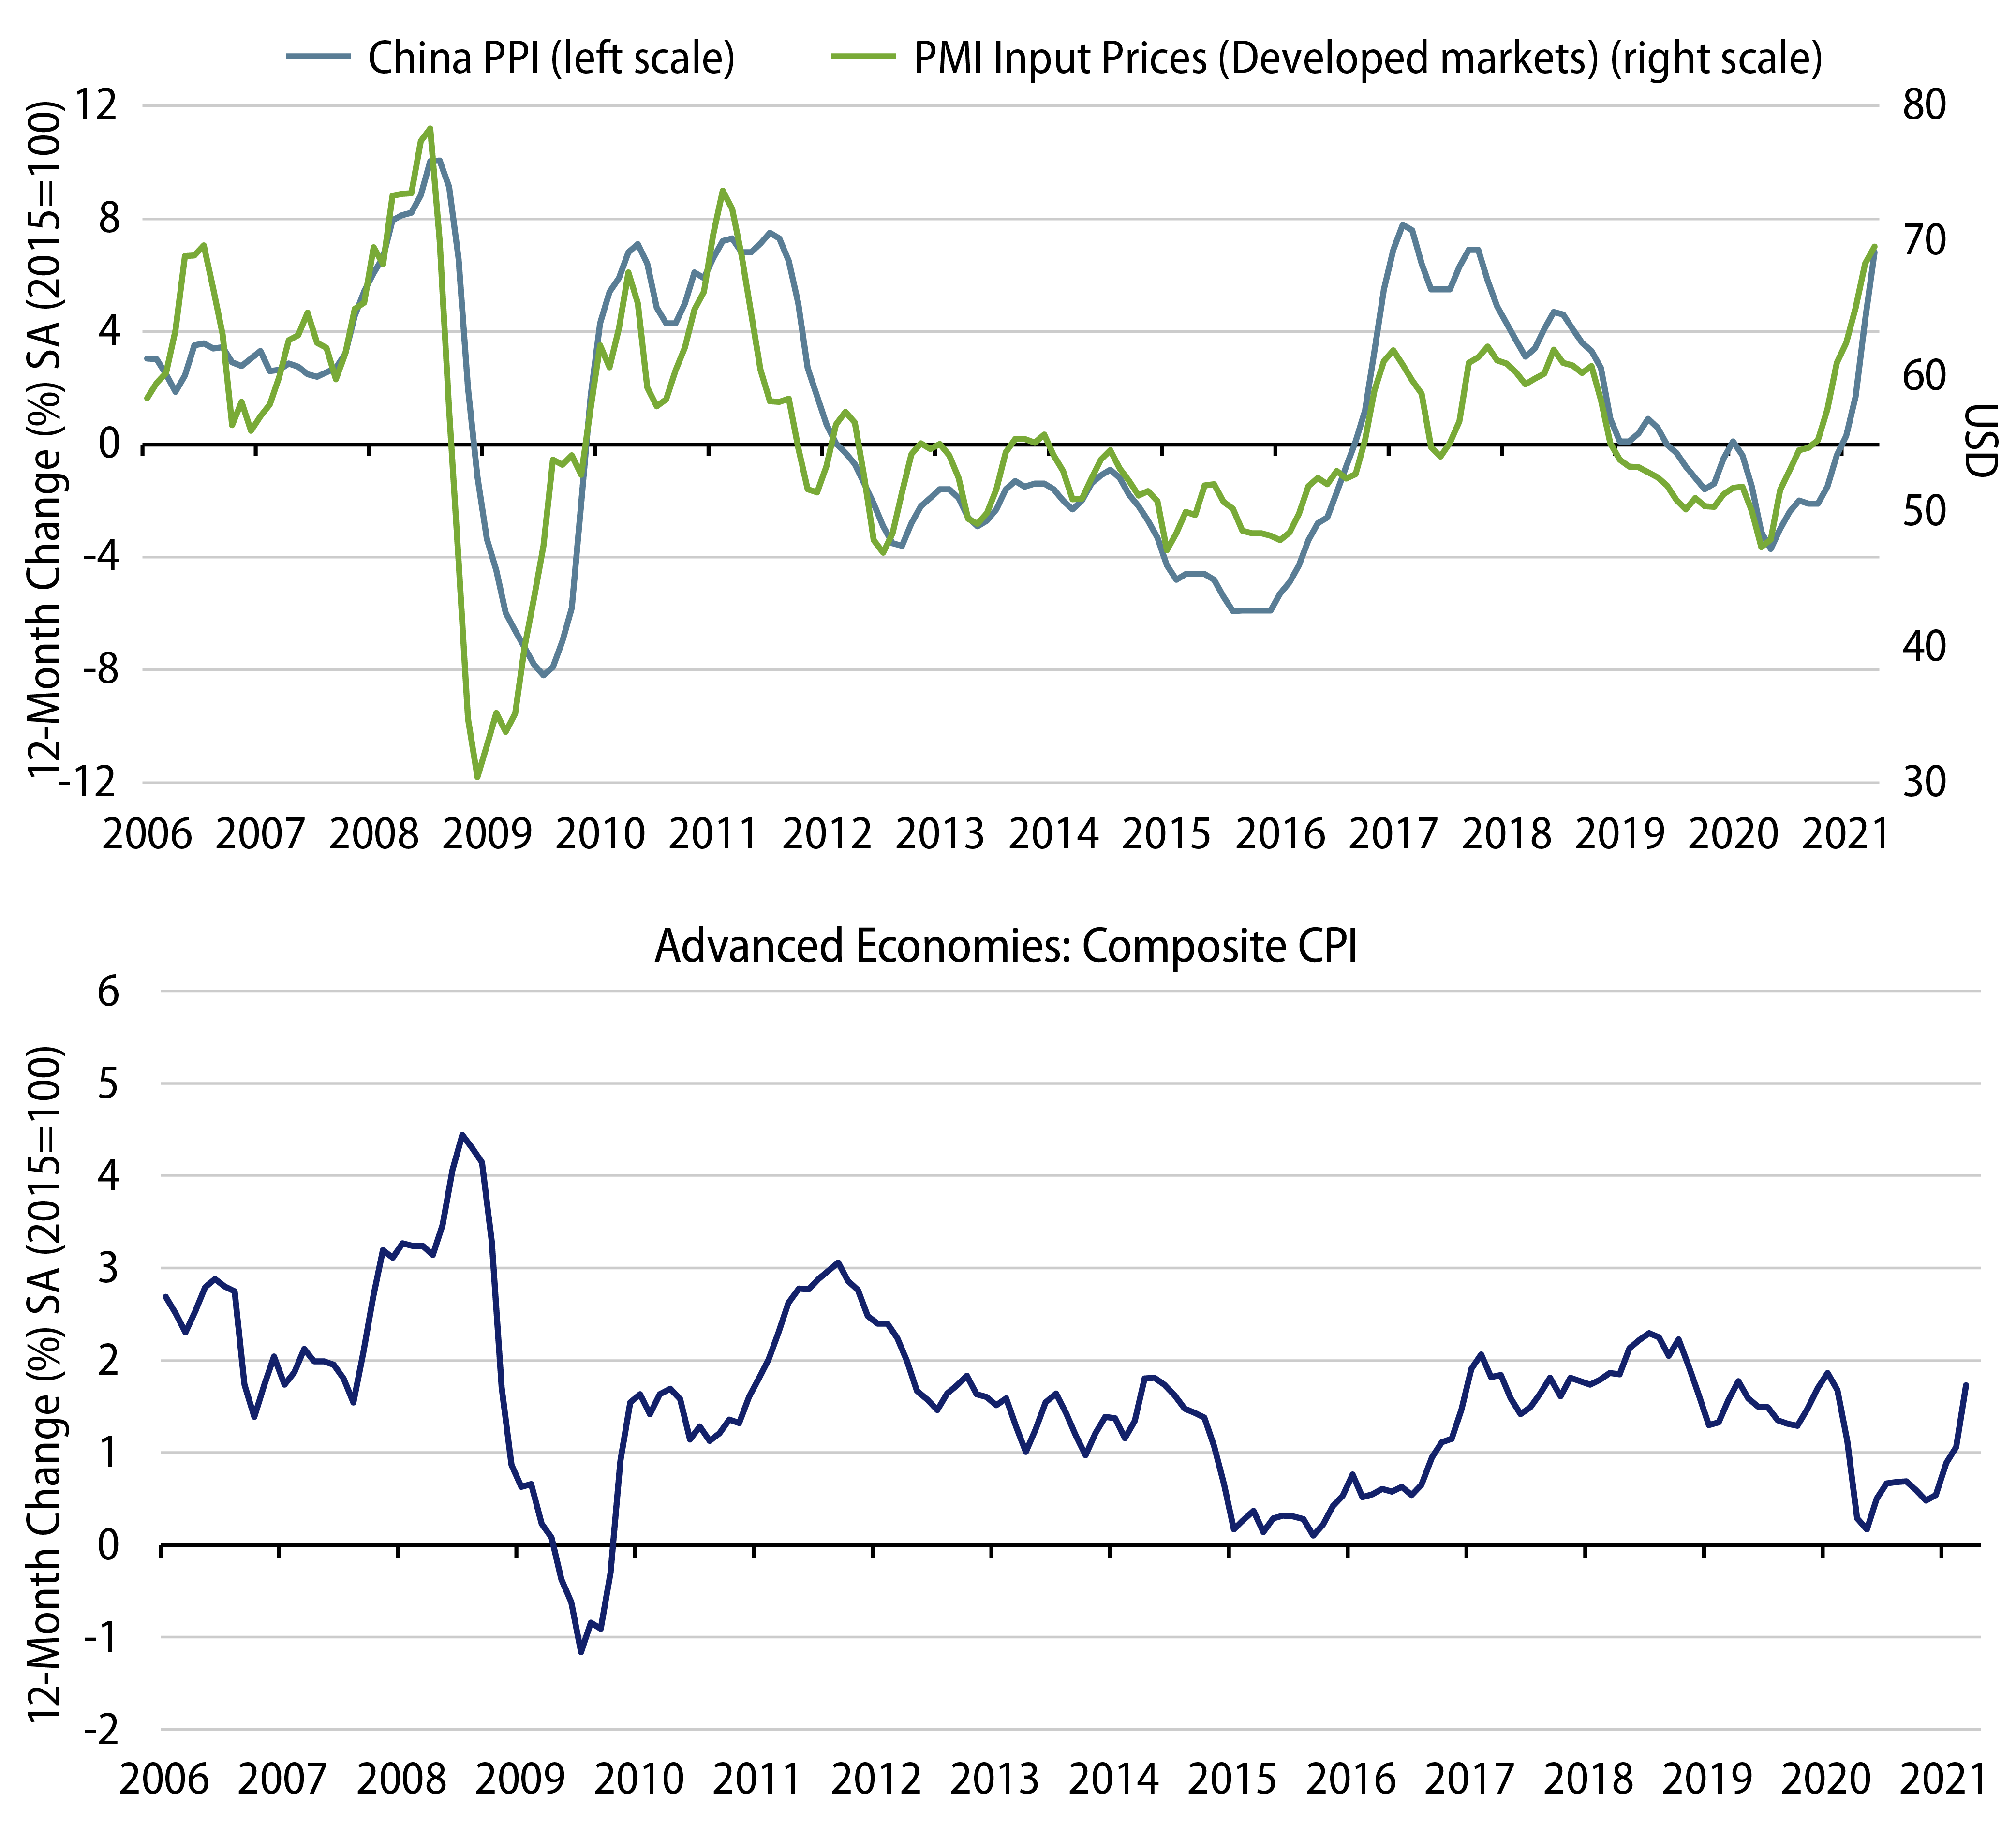
The sharp rise in commodity prices has garnered much attention recently. As Exhibit 3 shows, this has pushed Chinese Producer Price Index (PPI) levels close to the previous cycle highs in 2010 and 2017, and is strongly linked to the rising input prices that we see in many Purchasing Managers’ Index (PMI) surveys globally. Again, we do not know how much further commodity prices have to run, but we suspect again that we are closer to the end of this move and have confidence that stability is more likely than prices doubling again. In 2010 and 2011, as the global economy was recovering from the global financial crisis (GFC), both Chinese PPI and global input prices remained elevated. While this did push up advanced economies’ core inflation levels, the scale was modest and it did not prove persistent. A strong pass-through requires Chinese manufacturers being able to achieve higher foreign import prices and those companies then need the pricing power to push domestic prices higher to offset their rising cost bases. In the past, either one or both of these links have been weak. Little suggests that this has persistently changed.

Exhibit 3: China’s PPI vs. DM PMI Input Prices
Explore China’s PPI vs. DM PMI Input Prices
Source: China National Bureau of Statistics, IHS Markit, Haver Analytics. As 30 Apr 21. Select the image to expand the view.

Services

As vaccinations allow economies to reopen we need to look closely at the trajectory for service prices. Initially the first phase will be a sharp catch-up to pre-Covid price levels. The last US Consumer Price Index (CPI) print saw strong rebounds in hotels and airfares. We expect this to happen globally over the next couple of months. Thereafter, it turns more into a question of potential supply/demand mismatches, akin to the good sectors. This will likely be the case at first as people rush out to get haircuts, visit stores and cinemas, and eat in restaurants. In most instances (think restaurants) supply capacity has been reduced by social distancing restrictions. So we think it is likely that a lower-beta hump similar to what we have seen in goods prices also shows up in services prices in the second half of 2021.

Inflation Markets

Inflation markets have recovered quickly from the lows of March 2020 when US markets priced annual inflation of just 0.20% over the next five years to today’s pricing of around 2.6%. Exhibit 4 shows the rolling 5-year historic US CPI: A similar value was reached in the run-up to the GFC and, before then, in the mid-1990s. We agree that over the next 12 months inflation will be high, and we do not know yet how high. But the market is pricing a consistently high inflation rate over the next five years, not a hump followed by a return to a pre-Covid inflation rate. The modest reaction from inflation markets to the large upside print in US inflation also indicates to us that market pricing is on the rich side currently.

Exhibit 4: US Urban CPI
Explore US Urban CPI
Source: Bureau of Labor Statistics. As of 30 Apr 21. Select the image to expand the view.
© Western Asset Management Company, LLC 2024. The information contained in these materials ("the materials") is intended for the exclusive use of the designated recipient ("the recipient"). This information is proprietary and confidential and may contain commercially sensitive information, and may not be copied, reproduced or republished, in whole or in part, without the prior written consent of Western Asset Management Company ("Western Asset").
Past performance does not predict future returns. These materials should not be deemed to be a prediction or projection of future performance. These materials are intended for investment professionals including professional clients, eligible counterparties, and qualified investors only.
These materials have been produced for illustrative and informational purposes only. These materials contain Western Asset's opinions and beliefs as of the date designated on the materials; these views are subject to change and may not reflect real-time market developments and investment views.
Third party data may be used throughout the materials, and this data is believed to be accurate to the best of Western Asset's knowledge at the time of publication, but cannot be guaranteed. These materials may also contain strategy or product awards or rankings from independent third parties or industry publications which are based on unbiased quantitative and/or qualitative information determined independently by each third party or publication. In some cases, Western Asset may subscribe to these third party's standard industry services or publications. These standard subscriptions and services are available to all asset managers and do not influence rankings or awards in any way.
Investment strategies or products discussed herein may involve a high degree of risk, including the loss of some or all capital. Investments in any products or strategies described in these materials may be volatile, and investors should have the financial ability and willingness to accept such risks.
Unless otherwise noted, investment performance contained in these materials is reflective of a strategy composite. All other strategy data and information included in these materials reflects a representative portfolio which is an account in the composite that Western Asset believes most closely reflects the current portfolio management style of the strategy. Performance is not a consideration in the selection of the representative portfolio. The characteristics of the representative portfolio shown may differ from other accounts in the composite. Information regarding the representative portfolio and the other accounts in the composite are available upon request. Statements in these materials should not be considered investment advice. References, either general or specific, to securities and/or issuers in the materials are for illustrative purposes only and are not intended to be, and should not be interpreted as, recommendation to purchase or sell such securities. Employees and/or clients of Western Asset may have a position in the securities or issuers mentioned.
These materials are not intended to provide, and should not be relied on for, accounting, legal, tax, investment or other advice. The recipient should consult its own counsel, accountant, investment, tax, and any other advisers for this advice, including economic risks and merits, related to making an investment with Western Asset. The recipient is responsible for observing the applicable laws and regulations of their country of residence.
Founded in 1971, Western Asset Management Company is a global fixed-income investment manager with offices in Pasadena, New York, London, Singapore, Tokyo, Melbourne, São Paulo, Hong Kong, and Zürich. Western Asset is a wholly owned subsidiary of Franklin Resources, Inc. but operates autonomously. Western Asset is comprised of six legal entities across the globe, each with distinct regional registrations: Western Asset Management Company, LLC, a registered Investment Adviser with the Securities and Exchange Commission; Western Asset Management Company Distribuidora de Títulos e Valores Mobiliários Limitada is authorized and regulated by Comissão de Valores Mobiliários and Brazilian Central Bank; Western Asset Management Company Pty Ltd ABN 41 117 767 923 is the holder of the Australian Financial Services License 303160; Western Asset Management Company Pte. Ltd. Co. Reg. No. 200007692R is a holder of a Capital Markets Services License for fund management and regulated by the Monetary Authority of Singapore; Western Asset Management Company Ltd, a registered Financial Instruments Business Operator and regulated by the Financial Services Agency of Japan; and Western Asset Management Company Limited is authorised and regulated by the Financial Conduct Authority ("FCA") (FRN 145930). This communication is intended for distribution to Professional Clients only if deemed to be a financial promotion in the UK as defined by the FCA. This communication may also be intended for certain EEA countries where Western Asset has been granted permission to do so. For the current list of the approved EEA countries please contact Western Asset at +44 (0)20 7422 3000.