skip navigation
Blog

Stay up to date on timely topics and market events. Subscribe to our Blog now.

INVESTING
20 April 2023

Four Reasons to Embrace Fixed-Income

By Robert O. Abad

Stay up to date on timely topics and market events. Subscribe to our Blog now.

Fixed-Income Offers Compelling Return Potential

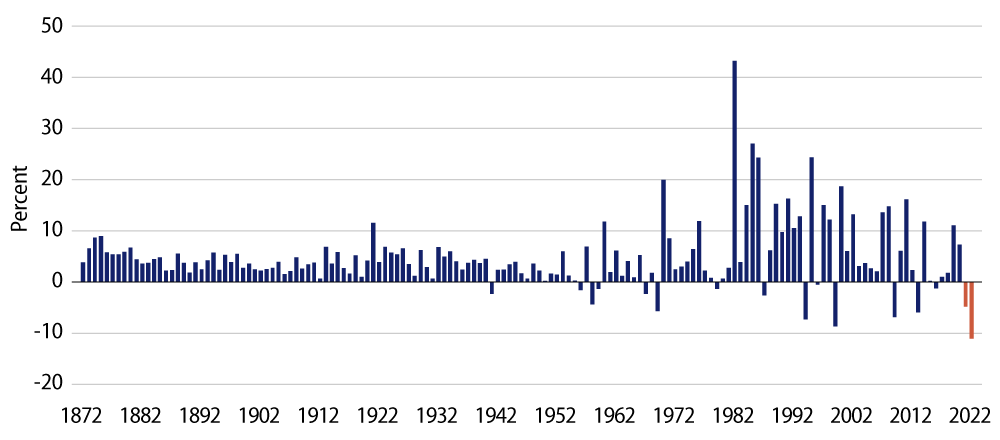
Shiller data going all the way back to 1870 confirms that 2022 was the worst calendar year for US Treasury (UST) total returns and only the second time that USTs posted back-to-back negative annual total returns. Will this trend extend into 2023?

No. We believe a third consecutive year of negative UST returns is highly unlikely. Our rationale is that in 2022 an unforeseen worldwide inflation shock combined with an aggressive and rapid response by central banks globally to make 2022 the worst year on record for the bond market. We don’t envision a repeat of this scenario given the magnitude of rate hikes already executed and increasing evidence of moderating global growth and inflation. This backdrop should support lower yields and healthier bond returns.

Exhibit 1: Nominal Annual Return on US Bonds
Explore Nominal Annual Return on US Bonds
Source: Robert Shiller, Bloomberg. As of 31 Dec 22. Select the image to expand the view.

Fixed-Income Offers Diversification Benefits

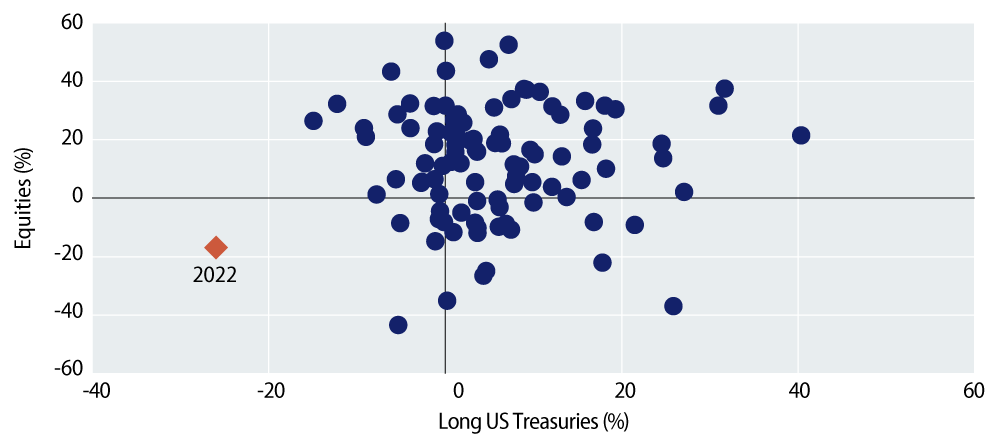
The classic 60/40 (stocks/bonds) portfolio completely failed to provide its historical diversification benefits as correlations all moved positively together in 2022. Do we expect this anomaly to persist?

No. Fixed-income’s diversifying properties are already reasserting themselves as fundamentals take center stage. The sharp decline in bond yields (notably at the front end of the yield curve) seen in March due to heightened concerns over US and European banking system stability is one indication that stock and bond market correlations are normalizing.

Exhibit 2: Long US Treasuries and Equities—Yearly Total Returns Since 1926
Explore Long US Treasuries and Equities—Yearly Total Returns Since 1926
Source: Ibbotson, Bloomberg. Equities represented by the S&P 500. Long US Treasuries represented by Bloomberg Long US Treasury Bonds. As of 31 Dec 22. Select the image to expand the view.

Fixed-Income Now Offers Less Volatility

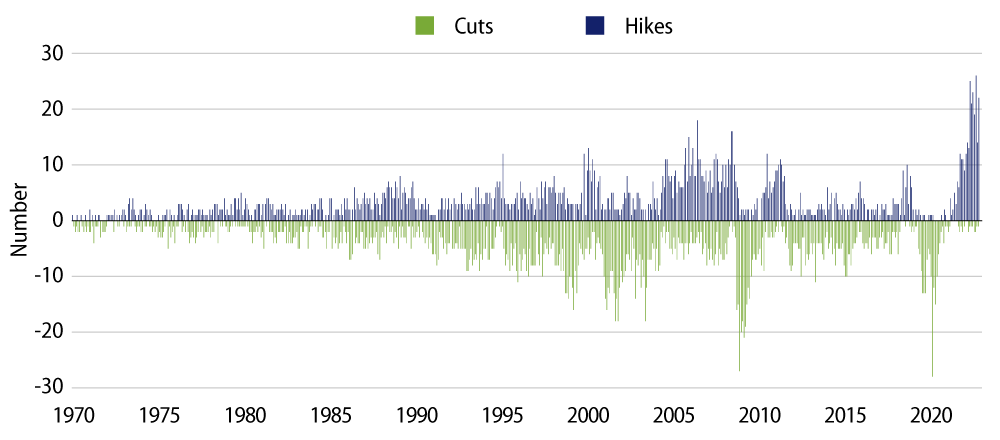
In 2022, we witnessed a historic period of monetary tightening over a very short span of time which resulted in record-breaking episodes of bond price volatility. The Federal Reserve (Fed) alone hiked short-term rates by more than 400 bps in 2022, which is unprecedented in its speed. Do we expect central banks to continue on this path?

No. The market is now looking forward to global central banks pausing (or even cutting) given the backdrop of softening global growth and inflation. This should temper fixed-income volatility going forward.

Exhibit 3: Global Central Bank Actions
Explore Global Central Bank Actions
Source: Haver Analytics, Bank of International Settlements. As of 31 Dec 22. Select the image to expand the view.

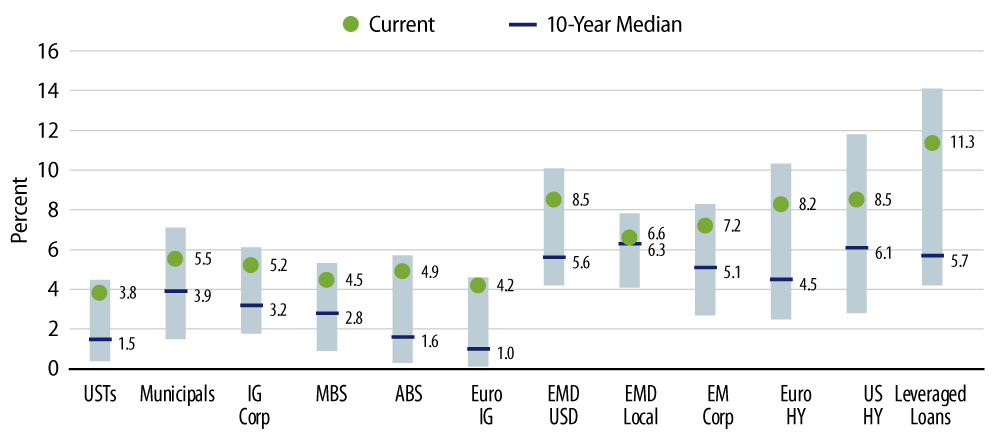
Fixed-Income Now Offers Investors More Choice

With the combination of higher rates and wider spreads having restored the forward-looking prospects for fixed-income yields, what’s a fixed-income investor to do?

Get involved. We haven’t seen this level of all-in yields going back a decade, reinforcing the idea that the starting point for fixed-income—with an emphasis on credit—in 2023 appears very attractive.

Exhibit 4: Yield-to-Worst Across Fixed-Income Sectors (Past 10 Years)
Explore Yield-to-Worst Across Fixed-Income Sectors (Past 10 Years)
Source: Bloomberg, FactSet, J.P. Morgan Credit Research, J.P. Morgan Asset Management. Indices used are Bloomberg except for emerging market debt and leveraged loans: EMD (USD): J.P. Morgan EMIGLOBAL Diversified Index; EMD (LCL): J.P. Morgan GBI-EM Global Diversified Index; EM Corp.: J.P. Morgan CEMBI Broad Diversified; Leveraged loans: JPM Leveraged Loan Index; Euro IG: Bloomberg Euro Aggregate Corporate Index; Euro HY: Bloomberg Pan-European High Yield Index. Yield-to-worst is the lowest possible yield that can be received on a bond apart from the company defaulting. All sectors shown are yield-to-worst except for Municipals, which is based on the tax-equivalent yield-to-worst assuming a top-income tax bracket rate of 37% plus a Medicare tax rate of 3.8%. Guide to the Markets—US Data are as of 31 Mar 23. Select the image to expand the view.
© Western Asset Management Company, LLC 2024. The information contained in these materials ("the materials") is intended for the exclusive use of the designated recipient ("the recipient"). This information is proprietary and confidential and may contain commercially sensitive information, and may not be copied, reproduced or republished, in whole or in part, without the prior written consent of Western Asset Management Company ("Western Asset").
Past performance does not predict future returns. These materials should not be deemed to be a prediction or projection of future performance. These materials are intended for investment professionals including professional clients, eligible counterparties, and qualified investors only.
These materials have been produced for illustrative and informational purposes only. These materials contain Western Asset's opinions and beliefs as of the date designated on the materials; these views are subject to change and may not reflect real-time market developments and investment views.
Third party data may be used throughout the materials, and this data is believed to be accurate to the best of Western Asset's knowledge at the time of publication, but cannot be guaranteed. These materials may also contain strategy or product awards or rankings from independent third parties or industry publications which are based on unbiased quantitative and/or qualitative information determined independently by each third party or publication. In some cases, Western Asset may subscribe to these third party's standard industry services or publications. These standard subscriptions and services are available to all asset managers and do not influence rankings or awards in any way.
Investment strategies or products discussed herein may involve a high degree of risk, including the loss of some or all capital. Investments in any products or strategies described in these materials may be volatile, and investors should have the financial ability and willingness to accept such risks.
Unless otherwise noted, investment performance contained in these materials is reflective of a strategy composite. All other strategy data and information included in these materials reflects a representative portfolio which is an account in the composite that Western Asset believes most closely reflects the current portfolio management style of the strategy. Performance is not a consideration in the selection of the representative portfolio. The characteristics of the representative portfolio shown may differ from other accounts in the composite. Information regarding the representative portfolio and the other accounts in the composite are available upon request. Statements in these materials should not be considered investment advice. References, either general or specific, to securities and/or issuers in the materials are for illustrative purposes only and are not intended to be, and should not be interpreted as, recommendation to purchase or sell such securities. Employees and/or clients of Western Asset may have a position in the securities or issuers mentioned.
These materials are not intended to provide, and should not be relied on for, accounting, legal, tax, investment or other advice. The recipient should consult its own counsel, accountant, investment, tax, and any other advisers for this advice, including economic risks and merits, related to making an investment with Western Asset. The recipient is responsible for observing the applicable laws and regulations of their country of residence.
Founded in 1971, Western Asset Management Company is a global fixed-income investment manager with offices in Pasadena, New York, London, Singapore, Tokyo, Melbourne, São Paulo, Hong Kong, and Zürich. Western Asset is a wholly owned subsidiary of Franklin Resources, Inc. but operates autonomously. Western Asset is comprised of six legal entities across the globe, each with distinct regional registrations: Western Asset Management Company, LLC, a registered Investment Adviser with the Securities and Exchange Commission; Western Asset Management Company Distribuidora de Títulos e Valores Mobiliários Limitada is authorized and regulated by Comissão de Valores Mobiliários and Brazilian Central Bank; Western Asset Management Company Pty Ltd ABN 41 117 767 923 is the holder of the Australian Financial Services License 303160; Western Asset Management Company Pte. Ltd. Co. Reg. No. 200007692R is a holder of a Capital Markets Services License for fund management and regulated by the Monetary Authority of Singapore; Western Asset Management Company Ltd, a registered Financial Instruments Business Operator and regulated by the Financial Services Agency of Japan; and Western Asset Management Company Limited is authorised and regulated by the Financial Conduct Authority ("FCA") (FRN 145930). This communication is intended for distribution to Professional Clients only if deemed to be a financial promotion in the UK as defined by the FCA. This communication may also be intended for certain EEA countries where Western Asset has been granted permission to do so. For the current list of the approved EEA countries please contact Western Asset at +44 (0)20 7422 3000.