

Financial markets have wobbled in recent months alongside the chances for another anti-Covid stimulus package from the federal government. While the negotiations in Washington make for good political theater, our analysis indicates that further stimulus is not needed by American households.
Rather, we argue the stimulus already provided since March is more than sufficient to fully offset the income losses households have either suffered already or are likely to suffer through the first quarter of 2021. The government’s own official data indicate this to be the case. This conclusion holds even upon allowing for some slowing of the pace of economic recovery from that witnessed in recent months.
There is no argument that households have lost income due to partial or total shutdowns of various sectors of the economy. However, there is no doubt that government aid overall to households has been substantial, both through the stimulus checks that were sent and through expanded unemployment benefits. The questions that remain are: 1) is government aid paid out to date sufficient (or more than sufficient) to fully offset the income losses from the Covid shutdowns and 2) if government benefits paid to date exceed the losses so far, how much longer will the remaining cushion be sufficient to offset ongoing losses?
Parsing the BEA Data
Detailed data on the sources of personal income published by the US Department of Commerce Bureau of Economic Activity (BEA) provide direct input regarding these questions. In Exhibit 1, the blue and purple lines show actual income data published by the BEA.
The purple line shows so-called earned income of persons, that is, income not counting benefits paid by various levels of government. The associated red line in the chart shows our estimate of the trend of earned income prior to the Covid shutdowns, with this trend then extrapolated from February 2020 through March 2021, and with February 2020 marking the beginning of the Covid crisis. As you can see in the chart, actual earned income dropped sharply in March 2020 and after, reflecting the income losses from the pandemic.
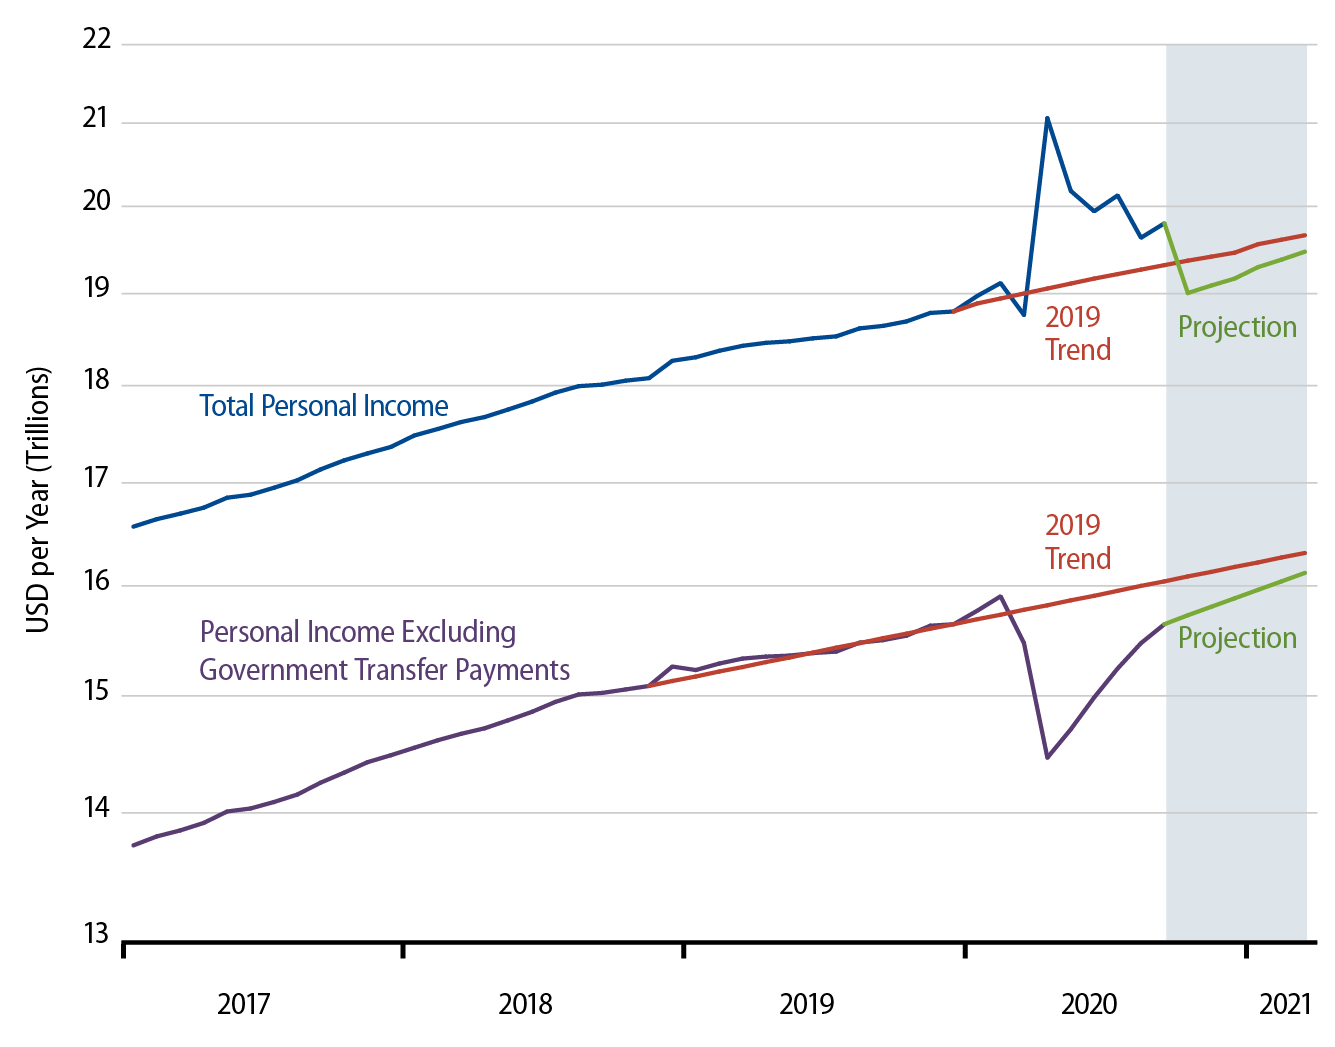
The difference between that red trend line and the purple line reflects the income losses due to the pandemic. Notice that if we had drawn the red line flat from early-2020 on, the estimated income losses would be smaller than what we actually find. So, by measuring actual income relative to a (growing) trend path, we serve to increase estimates of income losses.
As can also be seen in the chart, earned income has recovered relatively quickly from its April low, but, as of September, was still somewhat below the trend levels that would have occurred in the absence of the pandemic. Going forward, the associated green line shows our projection for earned income over the next six months, October 2020 through March 2021. This line reflects average growth of 0.5% per month, much slower than the 1.6% per month actual average growth over May-September. By comparing actual income levels to a growing trend line and by projecting a substantial slowing in income growth, we are likely overstating future income losses from Covid, if anything.
Now, consider the blue line in the chart. This is actual, total personal income as reported by the BEA—earned income plus aid from the government. The associated red line there reflects the trend path of total personal income that was in place prior to the onset of the pandemic.
Notice that total personal income rose dramatically in April 2020 and remained at elevated levels through September 2020, the last month for which we have official data. This rise in total income reflects not merely the amount of government benefits paid out, but the amount by which those benefits exceed the losses to earned income. That is, the blue line is the sum of actual earned income and actual benefits paid. So, it is the net of the losses to earned income and the offsetting benefits by the government.
So, the blue line all by itself answers the first aforementioned question: The fact that reported actual total income exceeds its 2019 trend path everywhere over the April-September period directly indicates that government aid through September has more than offset the losses to date to earned personal income caused by the pandemic. So, government aid has been sufficient to provide households with a net surplus during the pandemic. But if this aid suddenly disappears, how long will the surplus hold? This is the second question.
We can answer it by measuring the difference between the blue and red lines in the chart, then estimating the continued losses that are likely to occur in coming months. We have already estimated earned income over the next six months. If we assume government benefit payments drop back to their trend line in October and after, total personal income would then behave as per the green line associated with the blue line on the top part of Exhibit 1. Under these assumptions, there will be ongoing income losses over the next six months, as earned income remains below its pre-Covid trend. However, those income losses are likely to decline steadily each month, as the economy continues its recovery.
A Closer Look at Individual Incomes and Government Aid
Exhibit 2 shows the monthly gains and losses depicted by Exhibit 1. In March 2020, the BEA reported a level of earned income that was $0.31 trillion per year below our projected pre-Covid trend line. (The BEA reports income in seasonally adjusted annualized terms, and our chart and statistics are also reported in those terms.) However, unemployment benefits rose above previous trend levels by about $0.07 trillion per year, cutting the net income losses to $0.24 trillion per year.
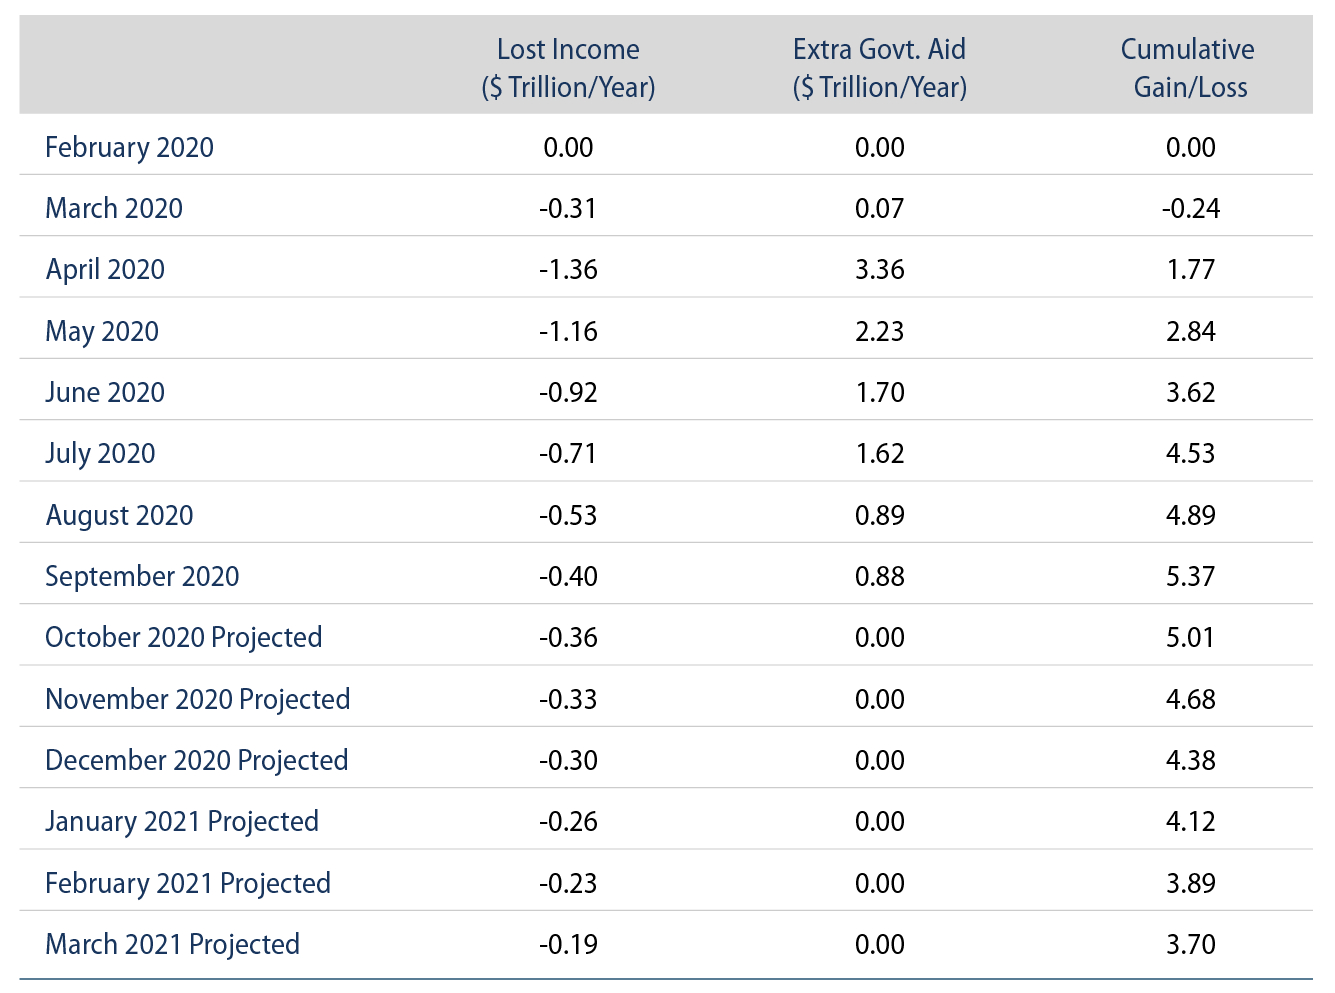
In April 2020, earned income was an additional $1.36 trillion per year below trend. However, by then, government aid via the CARES Act had begun to kick in dramatically, enough to boost income by $3.36 trillion per year and producing, on net, a cumulative net increase in total personal income of $1.77 trillion per year.
With extended unemployment benefits continuing at least through September 2020, the cumulative net boost to personal income has come to $5.37 trillion per year, or about $448 billion non-annualized. To repeat, extraordinary government benefits paid since the onset of the pandemic have exceeded income losses caused by the pandemic by almost half a trillion dollars.
This estimate comes directly from government data. For the figures through September, the only “input” we have added is to extrapolate trend lines for both total and earned income based on 2019 growth paths. And projecting ongoing trend growth for income serves to overstate the losses from the pandemic (as already explained) and to understate the boosts to income from government aid (since those actual aid payments are reckoned against a growing trend path for benefits).
Exhibit 2 then tallies future net income losses from the pandemic. Over October 2021 and after, again, we assume earned income growth will slow to a rate of 0.5% per year. Meanwhile, though extraordinary government benefits continued at a substantial pace through September (as can be seen from the fact that the blue line continued above trend through September even though the purple line remained below trend), we project such extraordinary aid to cease in October and after.
Even under these assumptions, the expectation is that through March 2021, aid from the government will still have exceeded total lost income by a total of $308 billion non-annualized ($3.07 trillion per year). Note also that at the projected growth rate, earned income will be essentially back on trend by March. In other words, there is a good chance that the income losses from the pandemic will have ceased by March, barring a reinstatement of the shutdowns, of course.
The Bottom Line
In our analysis here, we have focused on the losses and benefits extended to workers and to households. Aid to businesses from the CARES Act has been separate, and the Federal Reserve has helped with commercial financing as well. Still, it should be noted that our arguments do not touch on the areas of aid to businesses or to state and local governments.
Nevertheless, the analysis here indicates very clearly that Congress has already provided enough aid to American households to tide them over through the winter. Of course, some families have unfortunately failed to receive their share of this aid. But that is to be expected with a “macro” aid program. More to the point, there is no reason we know of to expect that families untouched by the first round of stimulus efforts will somehow get assistance from a second round.
In short, don’t fret too much if Congress fails to act in the next few months. For the most part, households, at least, have already received sufficient aid to tide them over. Should Covid-induced income losses continue or intensify during the winter, Congress could always act next year to address those problems. For now, though, provided the current economic recovery is allowed to continue, there is little case for arguing that American households require further assistance.