


KEY TAKEAWAYS
- International accords such as the Paris Agreement have galvanized countries to set ambitious targets for reducing their respective carbon footprints.
- Many countries are investing in renewable energy sources to facilitate the transition away from fossil fuels and to meet the emissions reduction targets.
- Passive decarbonization strategies based on country targets are insufficient. Active rebalancing and reallocation in sovereign bond portfolios are necessary for their alignment with a net-zero pathway.
- There might be trade-offs between risk and climate goals when rebalancing sovereign bond portfolios towards a net-zero pathway.
Global efforts to contain temperature rises are increasingly focused on the decarbonization of economies—a pro- cess that includes but is not limited to transitioning away from fossil fuels and toward renewable energy sources. This shift is seen by many as critical in mitigating the impacts of climate change, as the burning of coal, oil, and gas for energy is the largest single source of greenhouse gas (GHG) emissions worldwide. International accords such as the Paris Agreement have galvanized countries to set ambitious targets for reducing their respective carbon footprints, with the goal of keeping the global temperature increase by the end of this century well below 2°C and pursuing efforts to limiting warming to 1.5°C above pre-industrial levels. To achieve such a goal, as called for in the Paris Agreement, emissions must be reduced by 45% from their 2023 levels by 2030, and reach net zero by 2050.1
To bring about such a reduction, many nations are implementing a variety of strategies, including investing in solar, wind and hydroelectric power generation; enhancing energy efficiency in buildings, transportation and industry; and creating attempts to promote carbon pricing mechanisms to incentivize the reduction of emissions broadly. Countries pledging to a net-zero target are also encouraged to pursue mitigation on other fronts, including air quality, water management, waste management and energy management.2
Since the Paris Agreement and the release of the United Nations' Intergovernmental Panel on Climate Change (IPCC)3 special report on Global Warming of 1.5°C, the number of countries coalescing and pledging net-zero emissions has increased. As of September 2022, more than 70 countries, including the US, have pledged to reach net-zero emissions by 2050, either by setting such a target in law or in a policy document. Many other countries have proposed similar regulations or are considering following suit.
In their policymaking, some countries may establish emissions reductions in absolute terms, whereas others might link their targets to GDP growth. Furthermore, net-zero targets set by governments may specifically aim to achieve these goals within their borders, which could include or exclude international shipping and aviation, or they may not encompass all sectors and gases. The definition of targets, as well as baselines, may vary among nations, and some targets are characterized by greater transparency and robustness than others.
In this paper, we assess the impact of countries' emissions reduction commitments on emissions reductions on sovereign bond portfolios. We use a sovereign bond index as an example, but our approach can be also used for any actively managed portfolio. We also assess the feasibility of obtaining a net-zero compatible portfolio based on those commitments, that is, through passive decarbonization. Using information on targets for net-zero emissions pledged by countries, collected by Net Zero Tracker4, and assuming for simplicity's sake linear pathways toward achieving those targets, we analyze the future characteristics of a sovereign fixed-income index, specifically with a net-zero objective in mind. We also compare these pathways with reference pathways assessed or modelled by Climate Action Tracker (CAT)5, an independent scientific project.
The Different Types of Emissions Targets
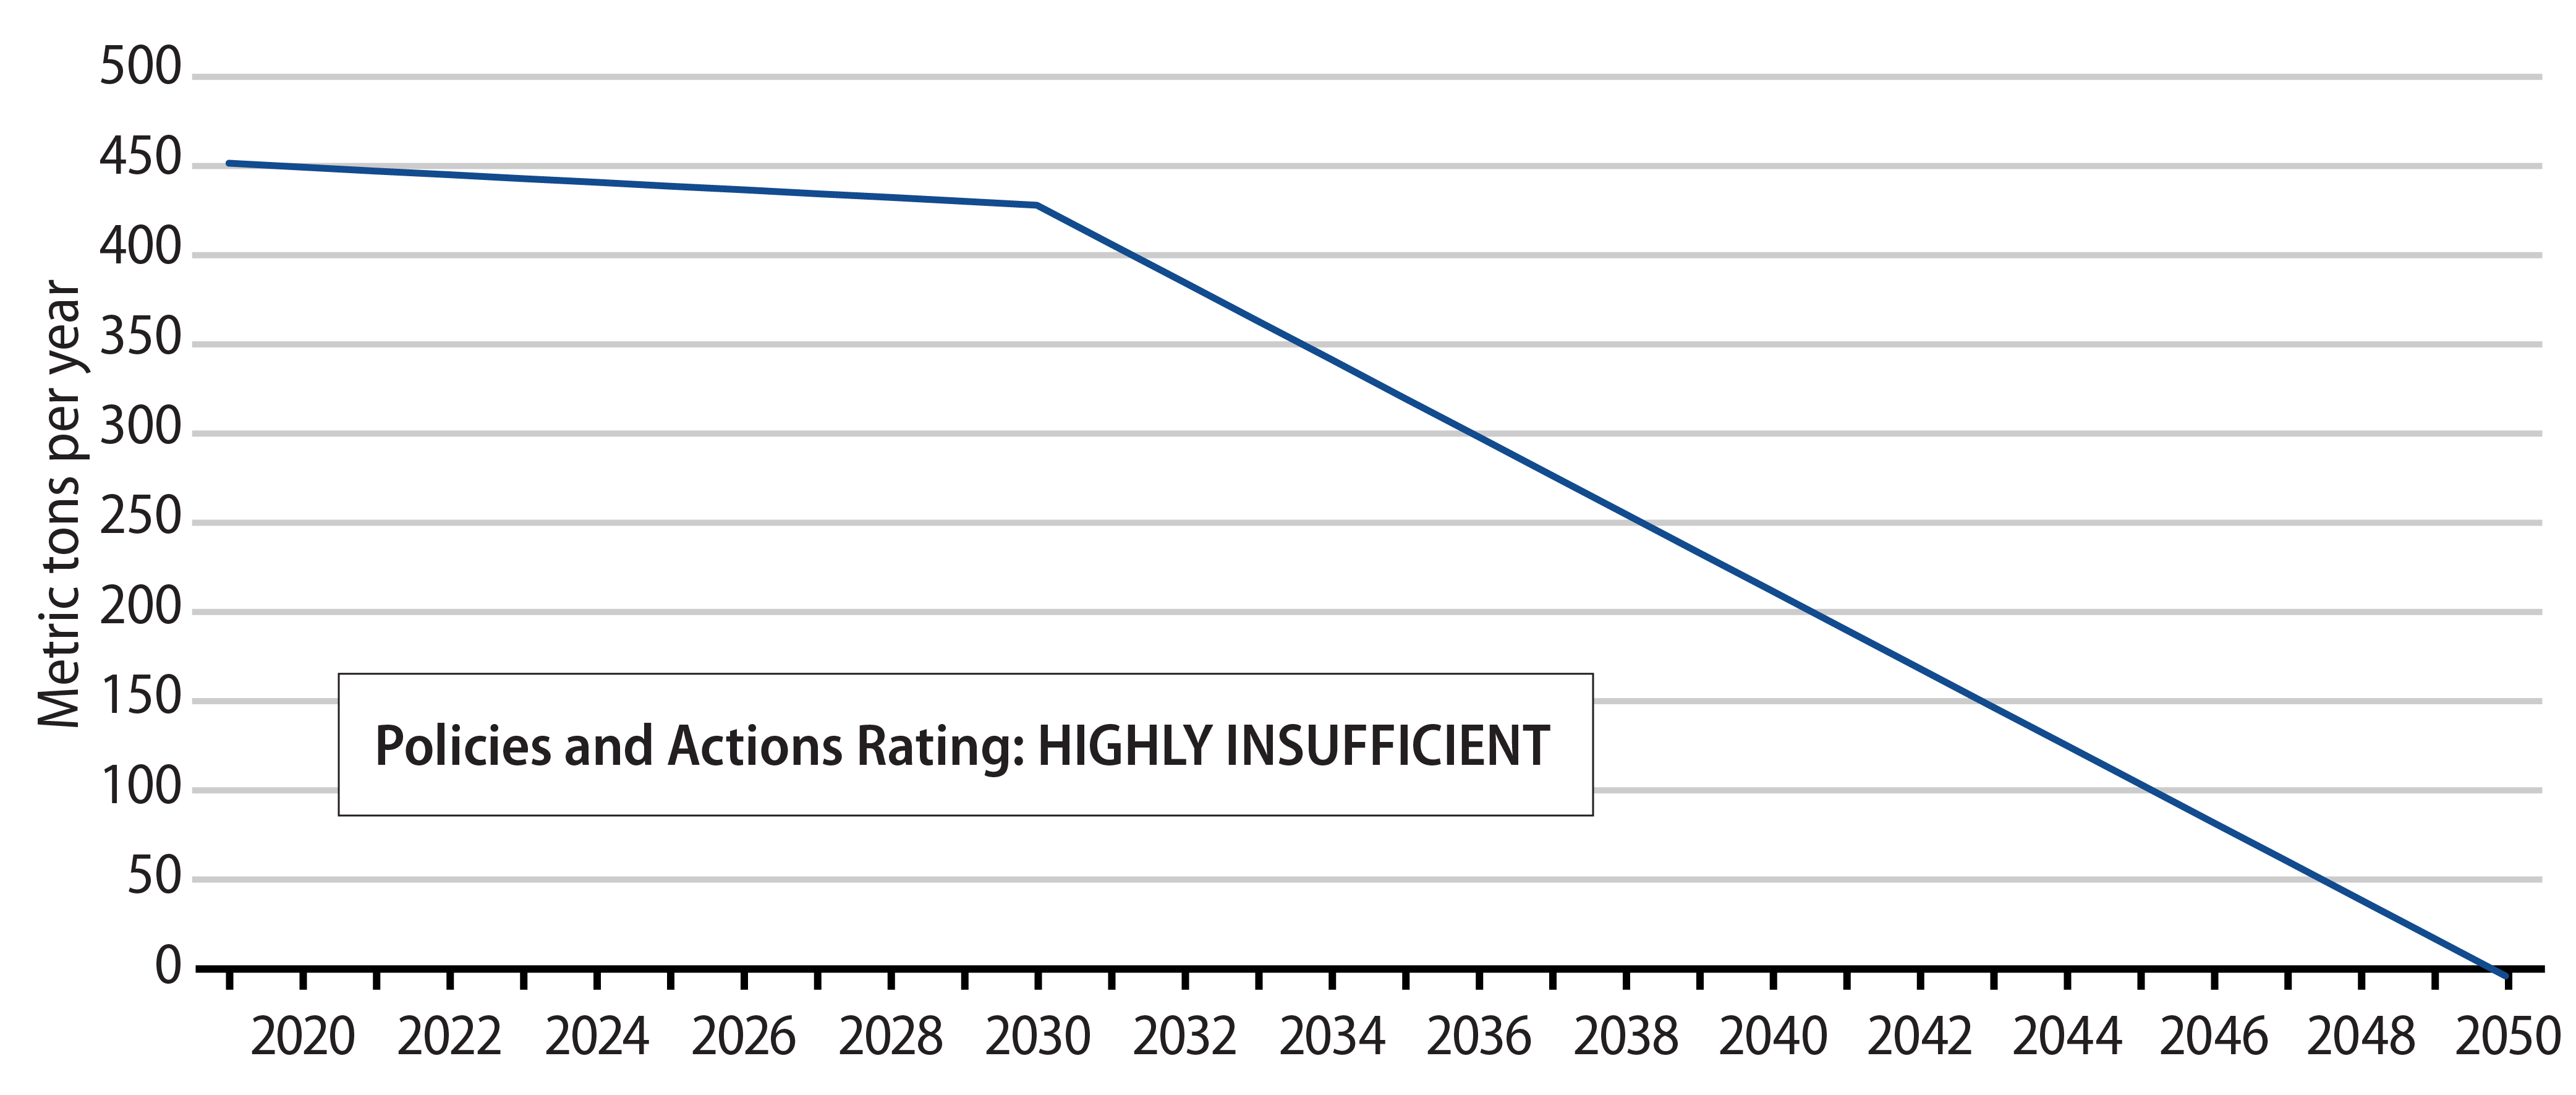
Typically, carbon emissions targets proposed by countries consist of an intermediate target for 2030, and a future target date for net-zero emissions. The intermediate targets may create kinks in our assumed linear decarboniza- tion pathways for countries. As an example, Exhibit 1 shows the estimated decarbonization pathway for Mexico. Mexico has a less aggressive emissions reduction target until 2030, then a more rapid decarbonization pathway from that year until 2050, its net-zero target date.
From both Net Zero Tracker and CAT, we observe that countries tend to commit to emissions reductions in different ways. The following are examples of different types of country targets and their descriptions:
- Emissions reduction targets: The objective is to reduce annual GHG emissions by a specified target year in comparison to a historical baseline year. For instance, ''Denmark aims to cut its GHG emissions to 70% below the 1990 levels by the year 2030.'' Some countries may have a more aggressive interim target, e.g., Denmark, whereas some may take a less aggressive approach, e.g., the Czech Republic pledges 30% emissions reduction below 2005 levels by 2030.
- Reduction against business as usual: The objective is to delineate a reduction in emissions relative to a projected emissions level without mitigation or policy interventions as a baseline, known as business as usual (BAU), by a specified date. For example, ''Colombia pledges to cut emissions by 51% below the BAU scenario by the year 2030.'' Colombia projects a BAU GHG emissions of approximately 350 million tons of carbon dioxide equivalent (MtCO2eq) in 2030, and the pledge is a 51% reduction from that level, translating into GHG emissions of 169.44 MtCO2eq in 2030.6
- Absolute emissions targets: This type of target establishes a specific emissions threshold to be achieved by a designated year or time frame, irrespective of current emissions levels. For example, ''The United Arab Emirates (UAE) commits to limiting annual emissions to a maximum of 182 MtCO2eq by the year 2030.'' Countries can change the type of their targets, for instance, the UAE previously had a reduction against a BAU target. It has revised its methodology and now has an absolute emissions target of 182 MtCO2eq, translating into an approximately 19% emissions reduction below the 2019 levels, by 2030.7
- Emissions intensity targets: These are emissions targets relative to a non-emissions metric, such as per unit of output or per unit of GDP. For instance, ''China commits to lowering its CO2 emissions per unit of GDP by 65% below 2005 levels by 2030.'' As the rate of intensity reduction is lower than the expected rate of China's GDP growth, this translates into an absolute CO2 emissions increase until 2030.
Some countries may have two types of targets, one being conditional. For example, Chile has an unconditional absolute GHG emissions target of 95 MtCO2eq by 2030, which translates into an approximate 23% emissions reduction below 2019 levels. In addition, and subject to the grant of the IMF, the country is committed to reduce its CO2 emissions per GDP unit by 2030 until it reaches a reduction of 35% to 45%, with respect to its 2007 levels, considering, in turn, a future economic growth which allows the country to implement adequate measures to achieve this commitment. In such cases, we have used the unconditional target in our calculations, as we attempt to examine the question of how reliable is passive decarbonization based on a country's targets as a means to achieve net zero of sovereign portfolios or indices.
Still other countries may set targets based on GHG or CO2 emissions, depending on their demographics and how relevant each type of emissions is to the country. For instance, Chile uses GHG emissions for its unconditional target and CO2 emissions for its conditional target.
It is important to note that emissions targets and published information may or may not include land use, land use change and forestry; special care must be taken in decarbonization analysis not to confuse different metrics. For the purpose of this study, we have assumed that pledged percent emissions reductions apply to all categories of emissions mentioned earlier. We have applied such percent reduction to CO2 emissions and calculated absolute CO2 emissions levels.
CAT evaluates emissions reductions targets set by sovereign entities in relation to their completion status and level of commitment. Here are the main examples:
- Achieved (externally validated): Net-zero status has been externally verified by an independent third party, e.g., by the Science Based Targets Initiative8. To date, no country has been externally verified as having achieved a net-zero target.
- Achieved (self-declared): Net-zero status has been declared unilaterally by the sovereign entity, but not verified externally, e.g., Suriname, Bhutan, Gabon.
- In Law: The target has legal force. For example, it is enshrined in legislation or in an administrative order, e.g., United Kingdom (UK), Japan, Sweden.
- In Policy: The target is included in a policy or planning document. For countries, this could include policy strategy documents published by ministries, as well as Nationally Determined Contributions (NDCs)9 and/ or Long-Term Strategies (LTSs) that have been submitted to the United Nations Framework Convention on Climate Change10, e.g., Belgium, China, Italy, Russia.
- Declaration / Pledge: The sovereign entity has announced a target, but the target is not yet institutionalized in any way (e.g., merely referenced in a press release, verbal announcement by Head of Government, etc.), e.g., Denmark, South Africa, Kuwait.
- Proposed/In Discussion: The country's leadership is considering a target, or has joined an international initiative (e.g., the Climate Neutrality Coalition11 or Climate Ambition Alliance12) pledging to set a net-zero target, but leadership has not yet taken steps to operationalize the pledge, e.g., Indonesia, Mexico, Bulgaria.
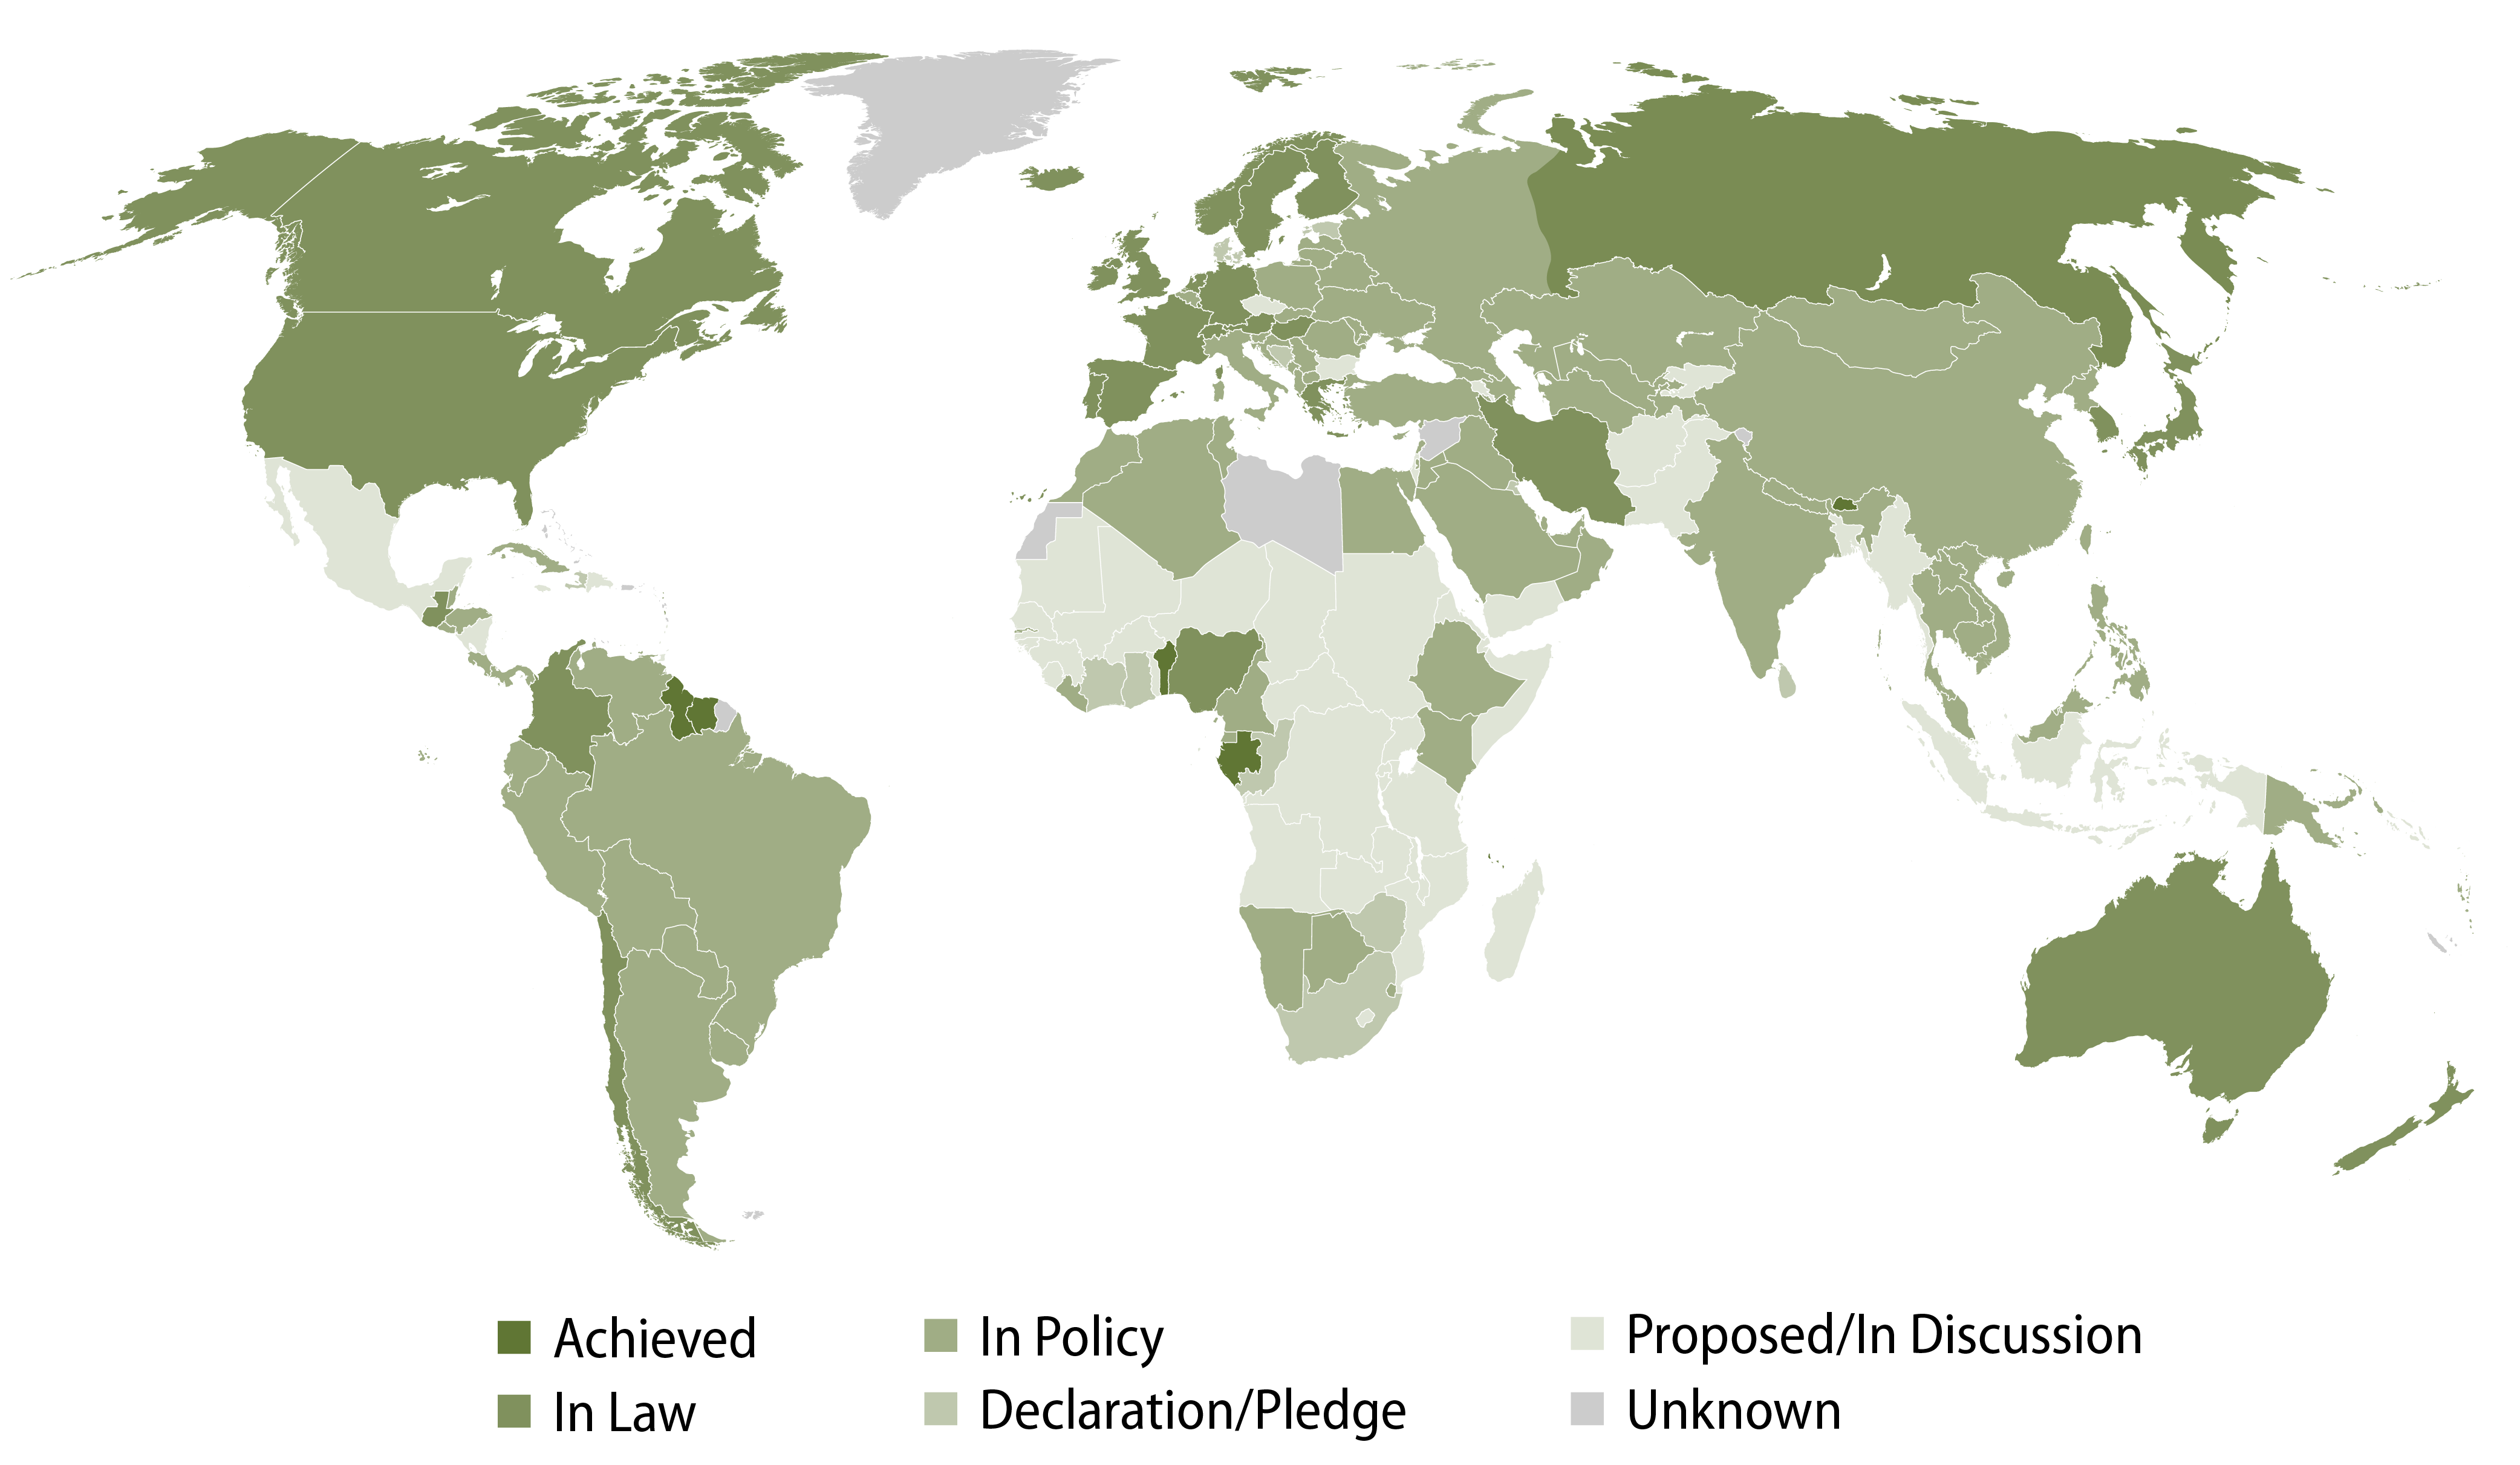
Exhibit 2 summarizes the current status of a group of relevant countries, according to Net Zero Tracker:
Country Targets and the Paris Agreement
Current commitments made by governments may prove inadequate even to mitigate the detrimental effects of climate change as hoped. Indeed, the collective national climate plans of the 193 Parties to the Paris Agreement are projected to result in a rise in global GHG emissions of around 9% by 2030 when compared to the levels in 2010.13
Governments, particularly the largest emitters, would need to enhance their NDCs and reevaluate their 2030 targets in order to achieve net-zero emissions. It is a positive development that there were numerous instances of countries presenting revised climate action plans with improved targets. For instance, in July 2021, Canada submitted its updated NDC, where it strengthened its emissions reduction target —from a 30% reduction below 2005 levels by 2030, to at least 40%-45%. Also, there were 24 new or updated submissions in 2022, which also points to the very dynamic nature of the target-setting process.
CAT also examines immediate actions and verifies the alignment of country policy proposals with their respective targets. It estimates what level of emissions reduction is achievable based on current policies and actions of each country. Based on such assessments, each country receives a rating for their policies and actions as well as their NDC targets. CAT measures government climate actions against the Paris Agreement aim of ''holding warming well below 2°C'' and pursuing efforts to limit warming to 1.5°C. It uses five categories for its overall ratings, as summarized in Exhibit 3.
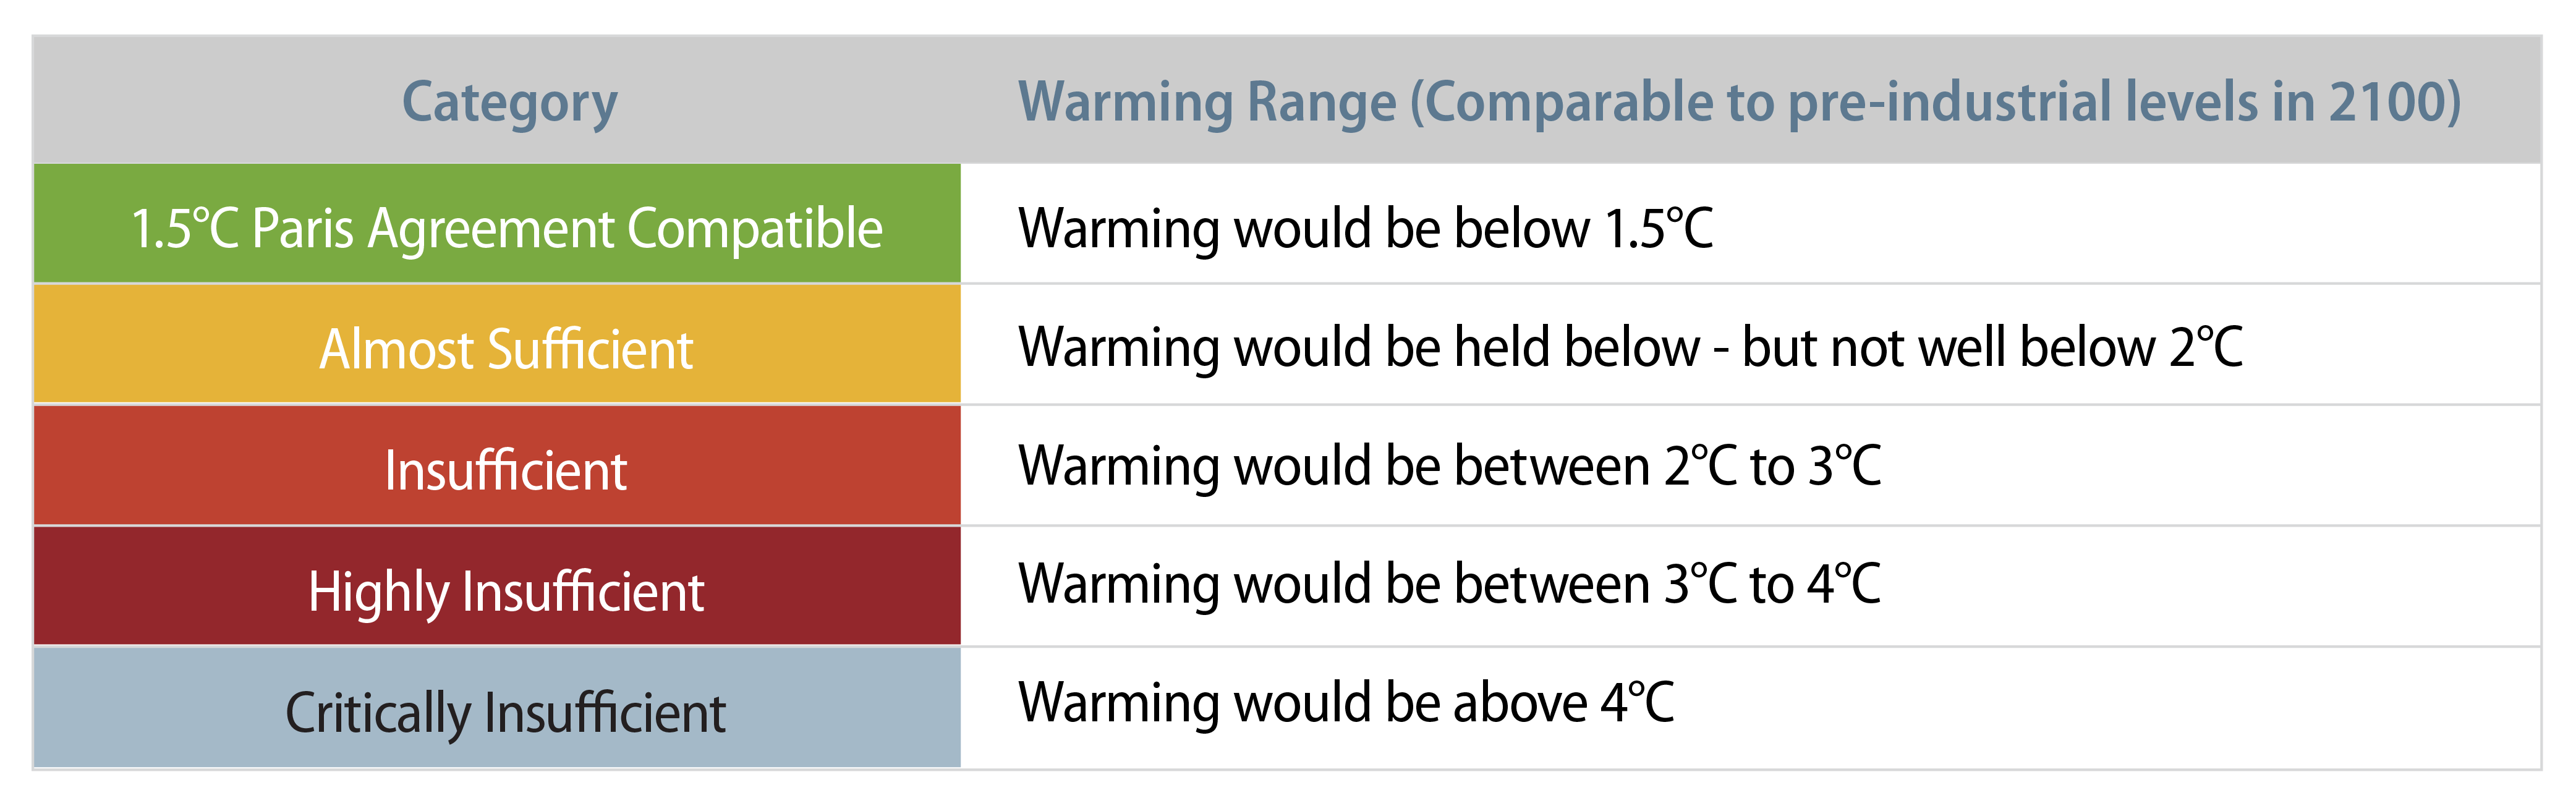
- The ''1.5°C Paris Agreement Compatible'' rating indicates that a country's climate policies and commitments are consistent with the Paris Agreement's 1.5°C temperature limit. Currently no country is rated 1.5°C Paris Agreement compatible.
- The ''Almost Sufficient'' rating indicates that a country's climate policies and commitments are not yet consistent with the Paris Agreement's 1.5°C temperature limit but could be with moderate improvements, e.g., Bhutan, Costa Rica, Norway.
- The ''Insufficient'' rating indicates that a country's climate policies and commitments need substantial improvements to be consistent with the Paris Agreement's 1.5°C temperature limit, e.g., Australia, Brazil, Japan, UK, US.
- The ''Highly Insufficient'' rating indicates that a country's climate policies and commitments are not consistent with the Paris Agreement's 1.5°C temperature limit by a certain margin. For many countries in this category, policies and commitments lead to rising, rather than falling, emissions, e.g., Canada, China, India, South Korea.
- The ''Critically Insufficient'' rating indicates that a country's climate policies and commitments reflect minimal to no action and are not at all consistent with the Paris Agreement, e.g., Indonesia, Mexico, Singapore, UAE.
In this section we take a closer look at China and Chile as examples. Similar charts for the UK and US, which are examples of countries with insufficient Policies and Actions, are provided in the Appendix.
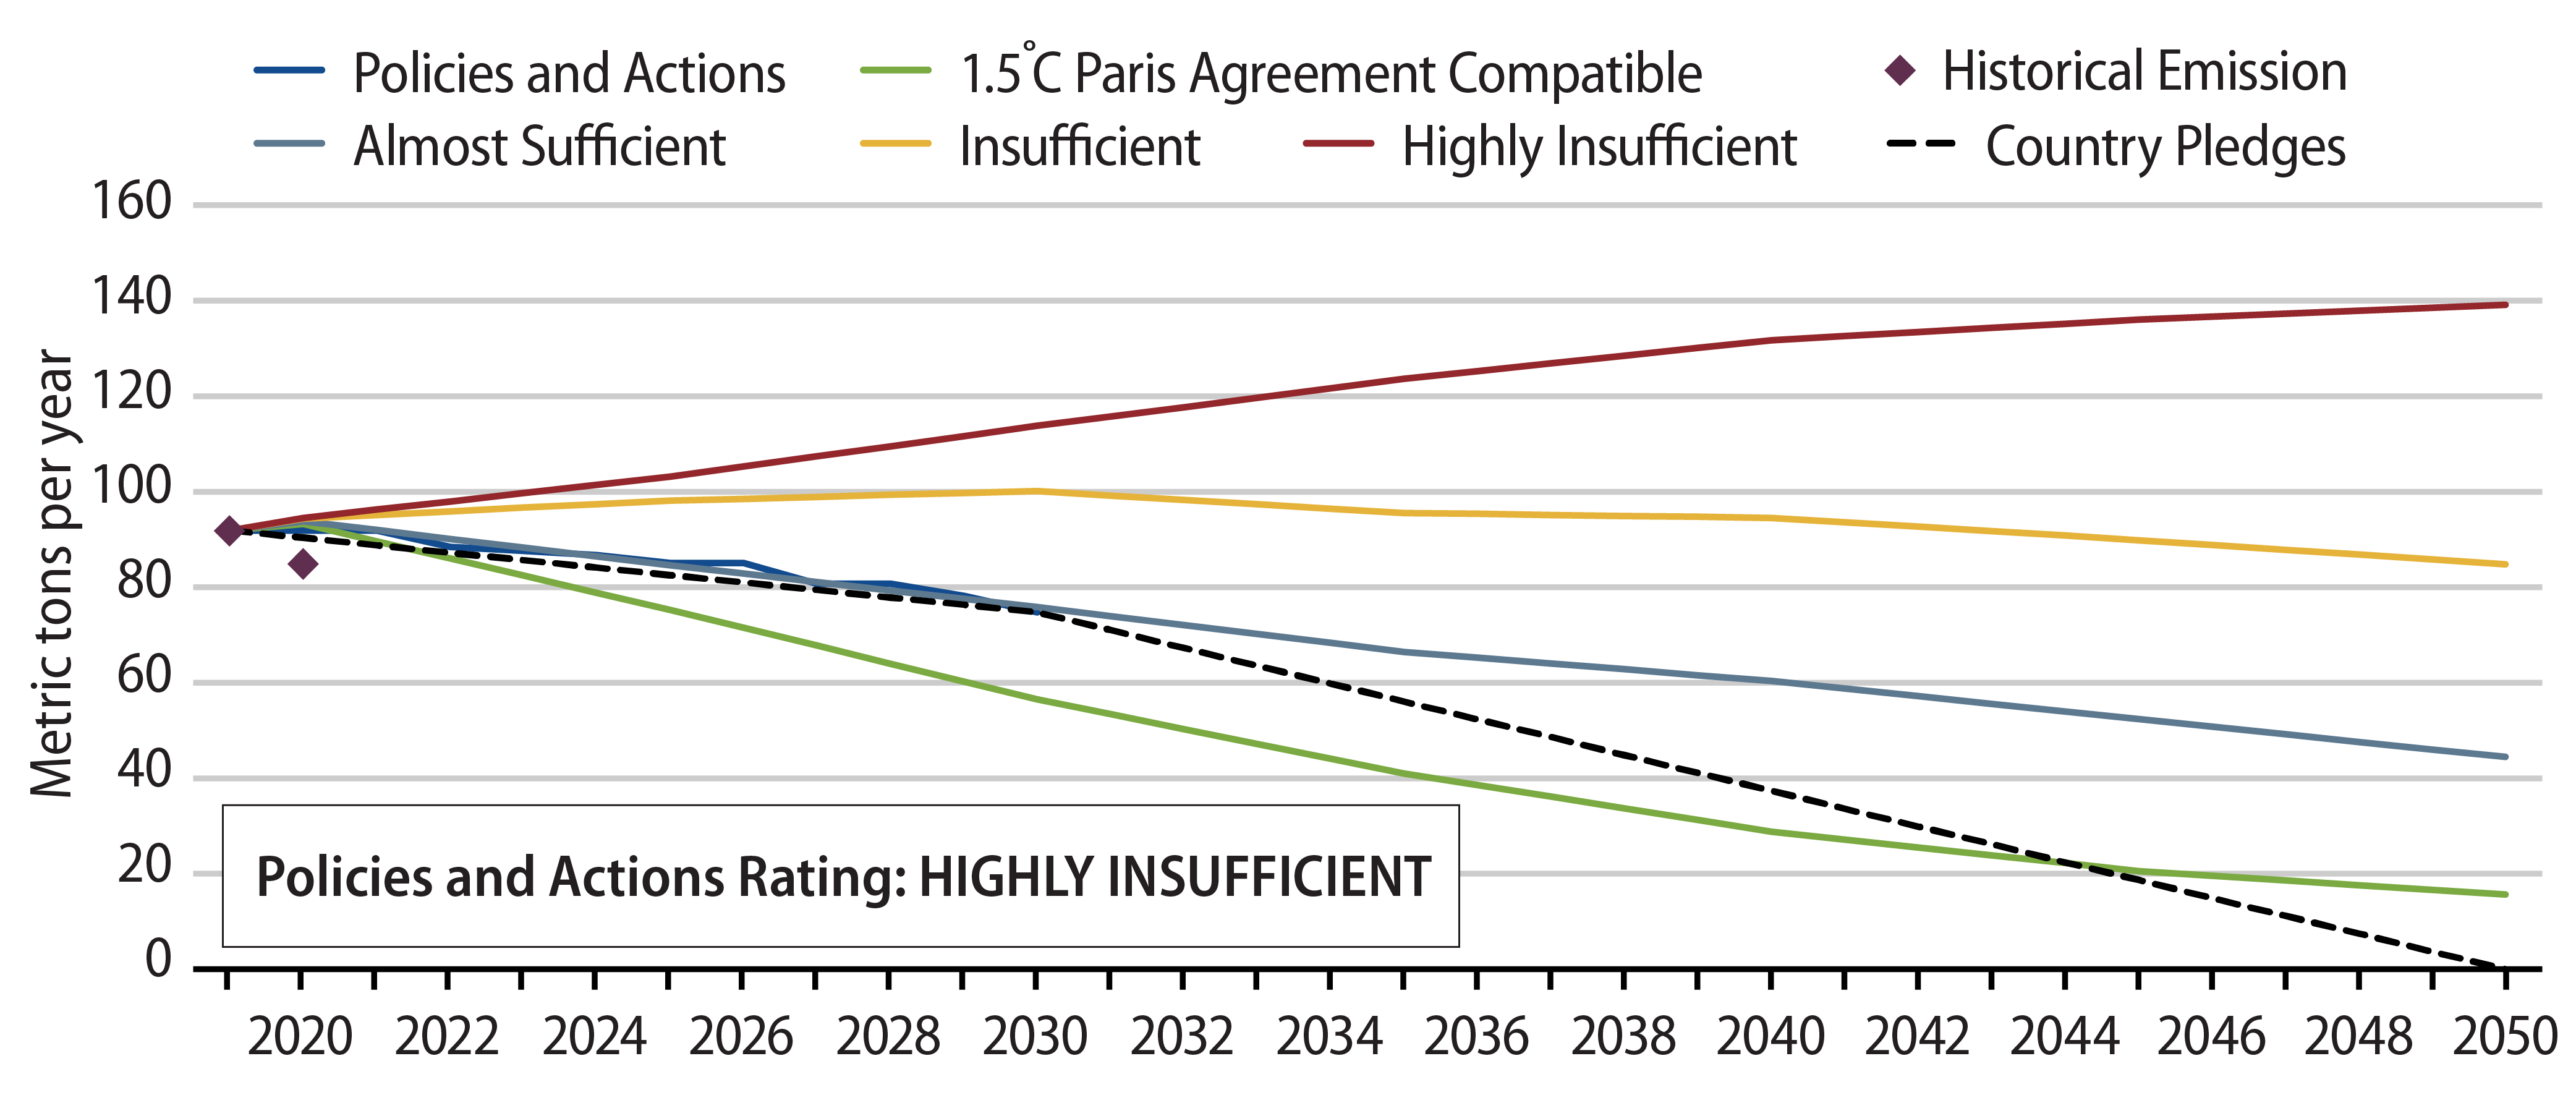
Exhibit 4 shows our estimates of emissions pathways for China, using GDP growth estimates from the International Monetary Fund (IMF)14, a CAT estimated pathway based on Policies and Actions and some modelled pathways with different levels of effectiveness. It can be seen that emissions in China are still poised to increase until 2030 before starting a downward trajectory. Exhibit 5 shows the same pathways, but measured in carbon intensity, i.e., emissions per GDP in metric tons per million US dollars.
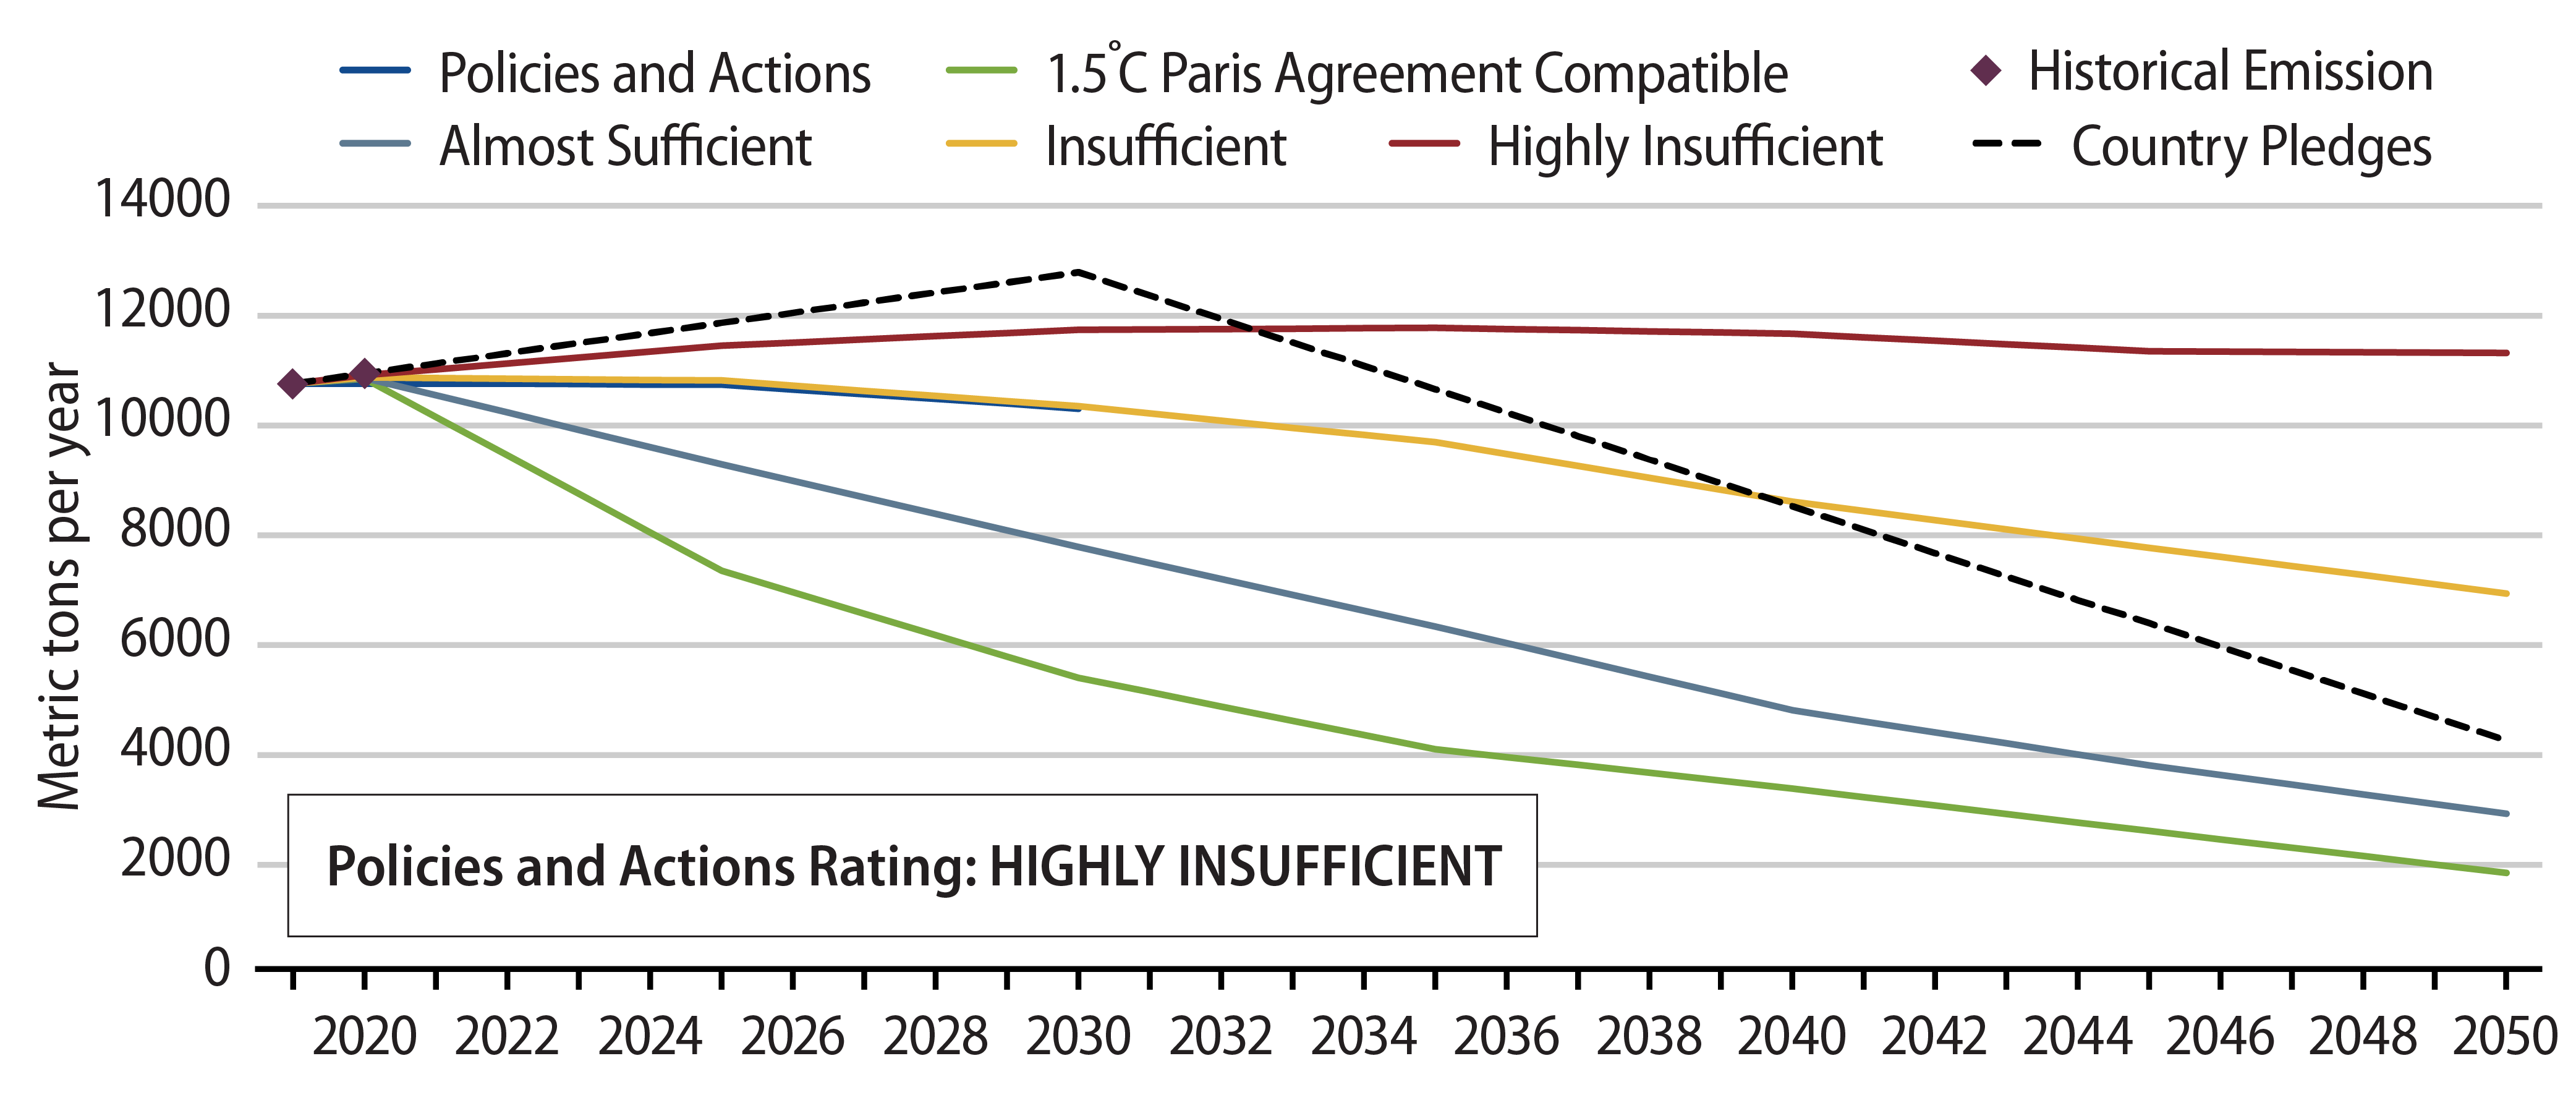
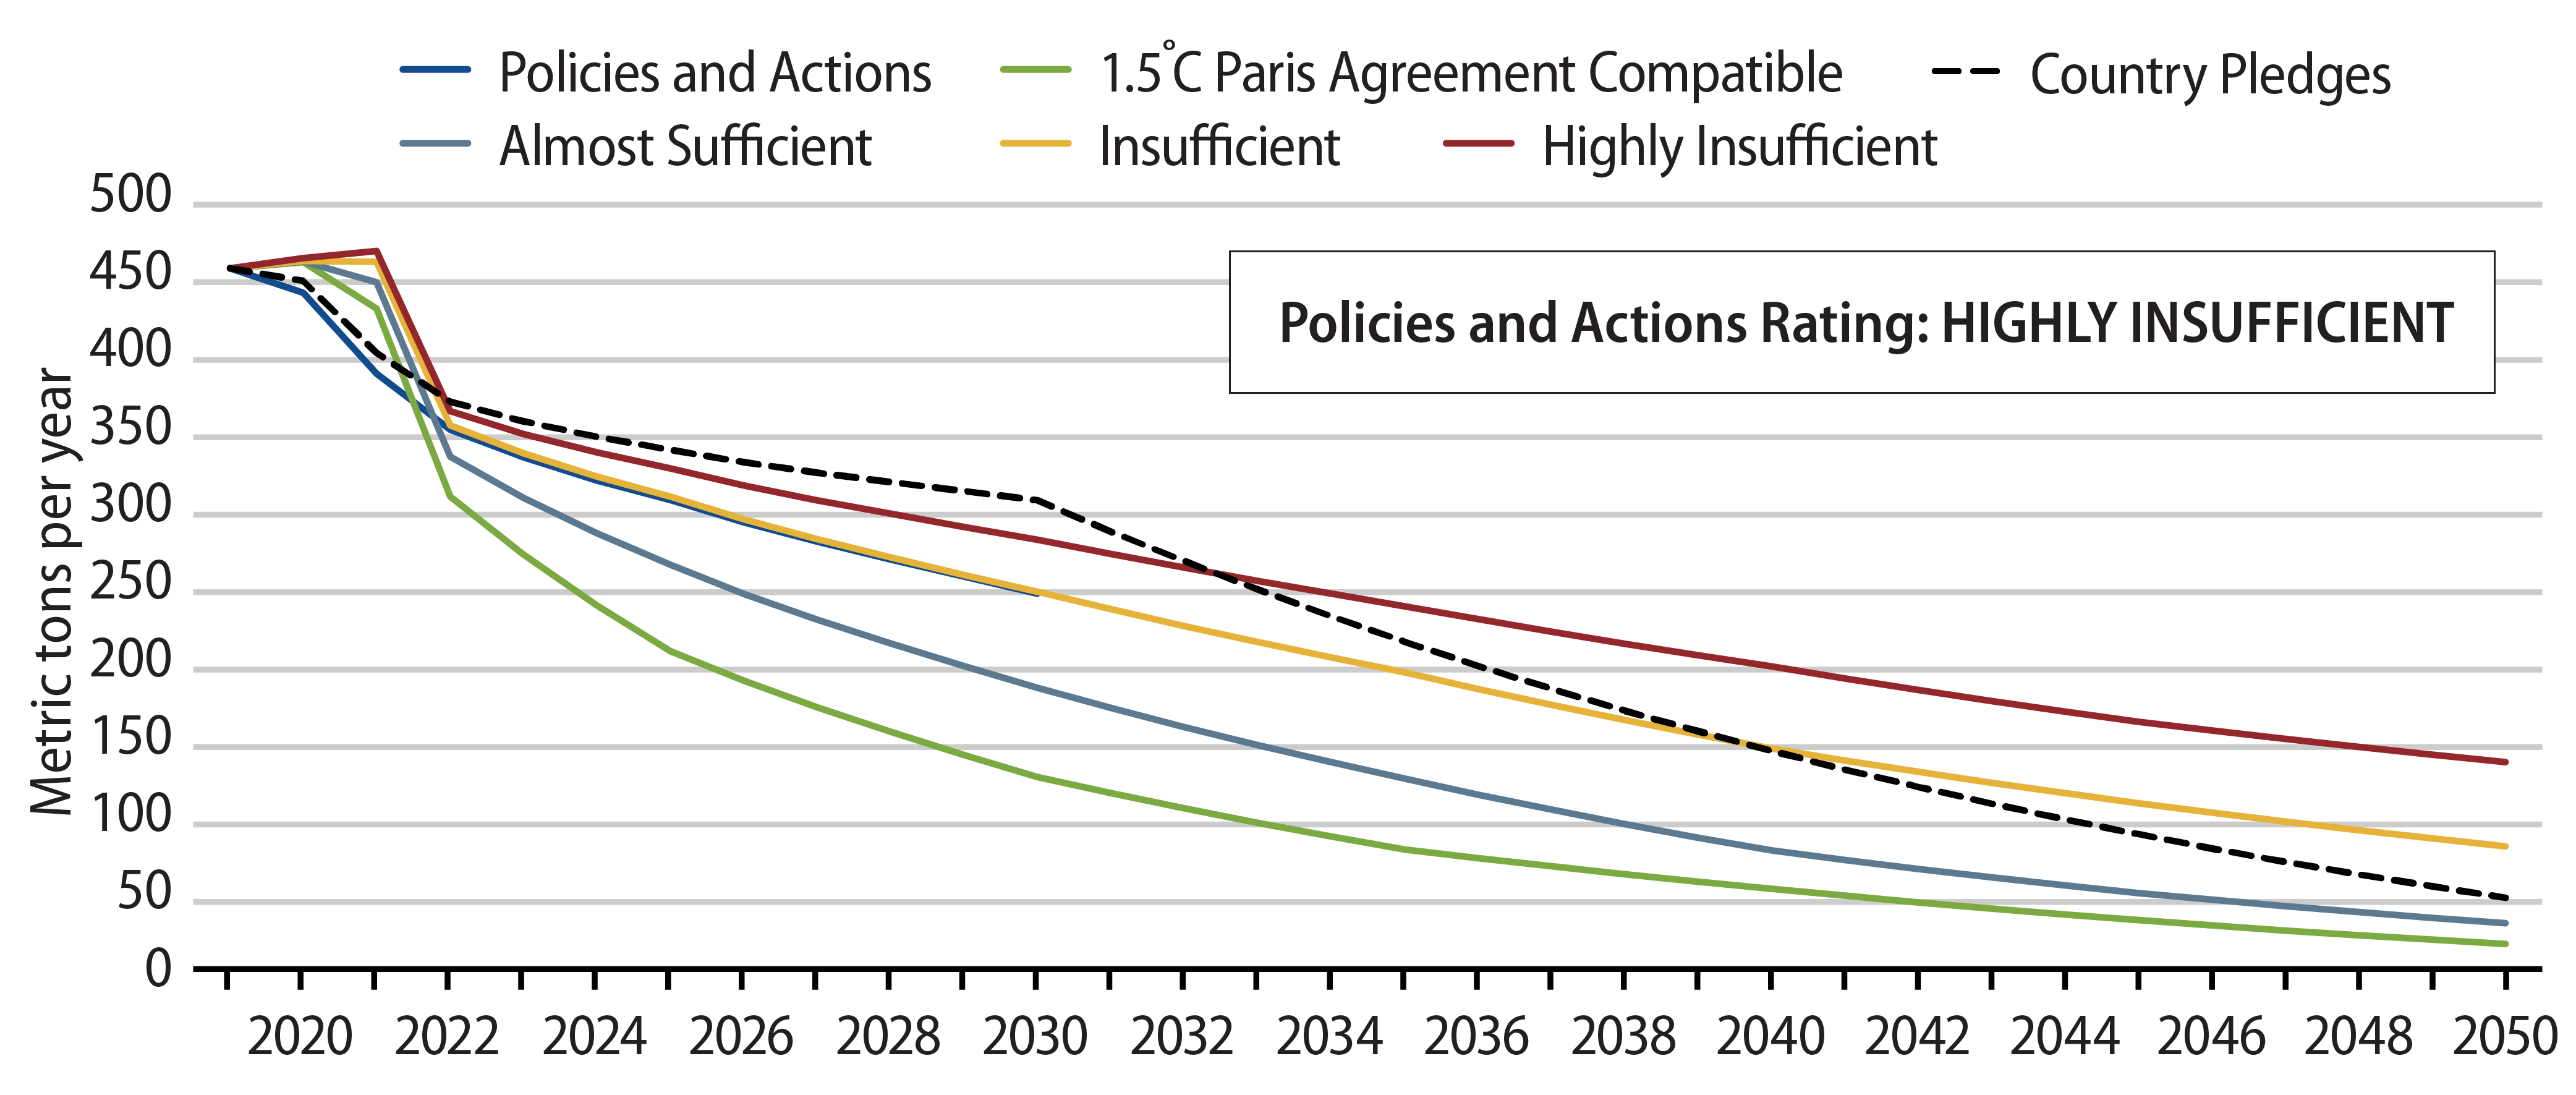
Exhibit 6 shows the pathways for the unconditional emissions reduction target used for Chile in our calculations.
Pathways Toward Net-Zero Emissions of a Sovereign Bond Benchmark
Based on the CAT assessment, it seems that most countries are simply ''not there'' yet. As such, most likely, a strategy for a portfolio of sovereign bonds that relies solely on country targets, whichever classification they might belong to, will fall short of the necessary decarbonization level compatible with a net-zero objective. We examine this question by looking at a sovereign fixed-income index, which are in fact portfolios, and follow the decarbonization pathways for each country exposure as expressed in their targets, without active rebalancing to further reduce portfolio's emissions. If the passive decarbonization strategy of an index falls short of the ultimate net-zero objective, an investor may need to resort to active decarbonization strategies. This might come at the expense of incurring some type of risk, for example, tracking error against the index, given the unavoidable tilts away from those countries with less ambitious targets and into the ones with more ambitious ones. Concentration risk—excessive exposure to one or few issuers—might result, as a portfolio is successively decarbonized over time. In essence, there might be trade-offs between risk and the net-zero objective in strategies of decarbonization of portfolios.
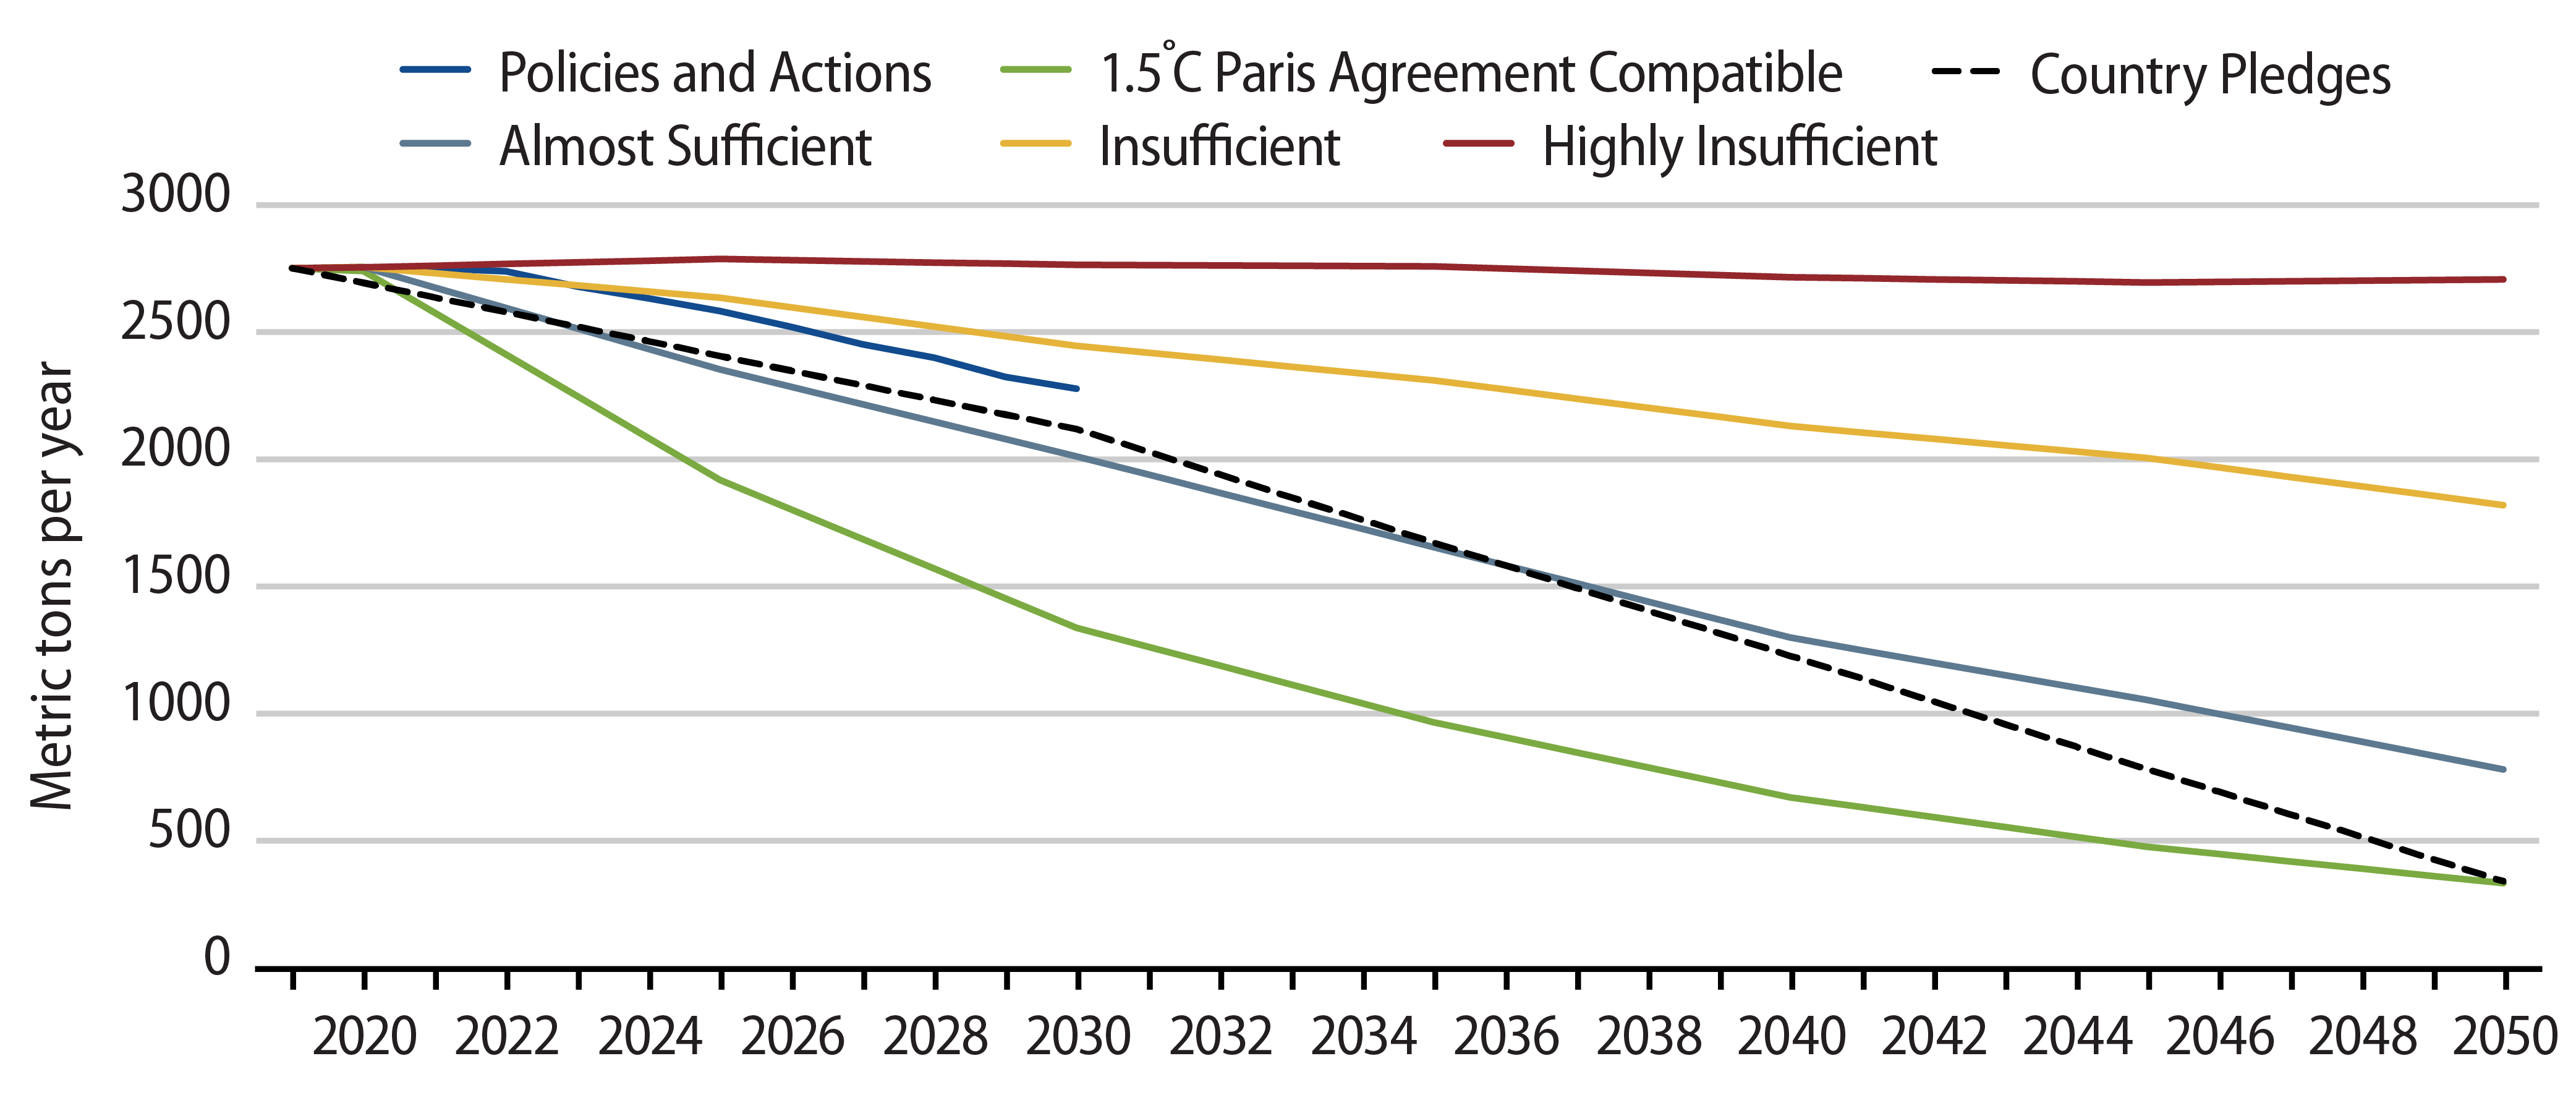
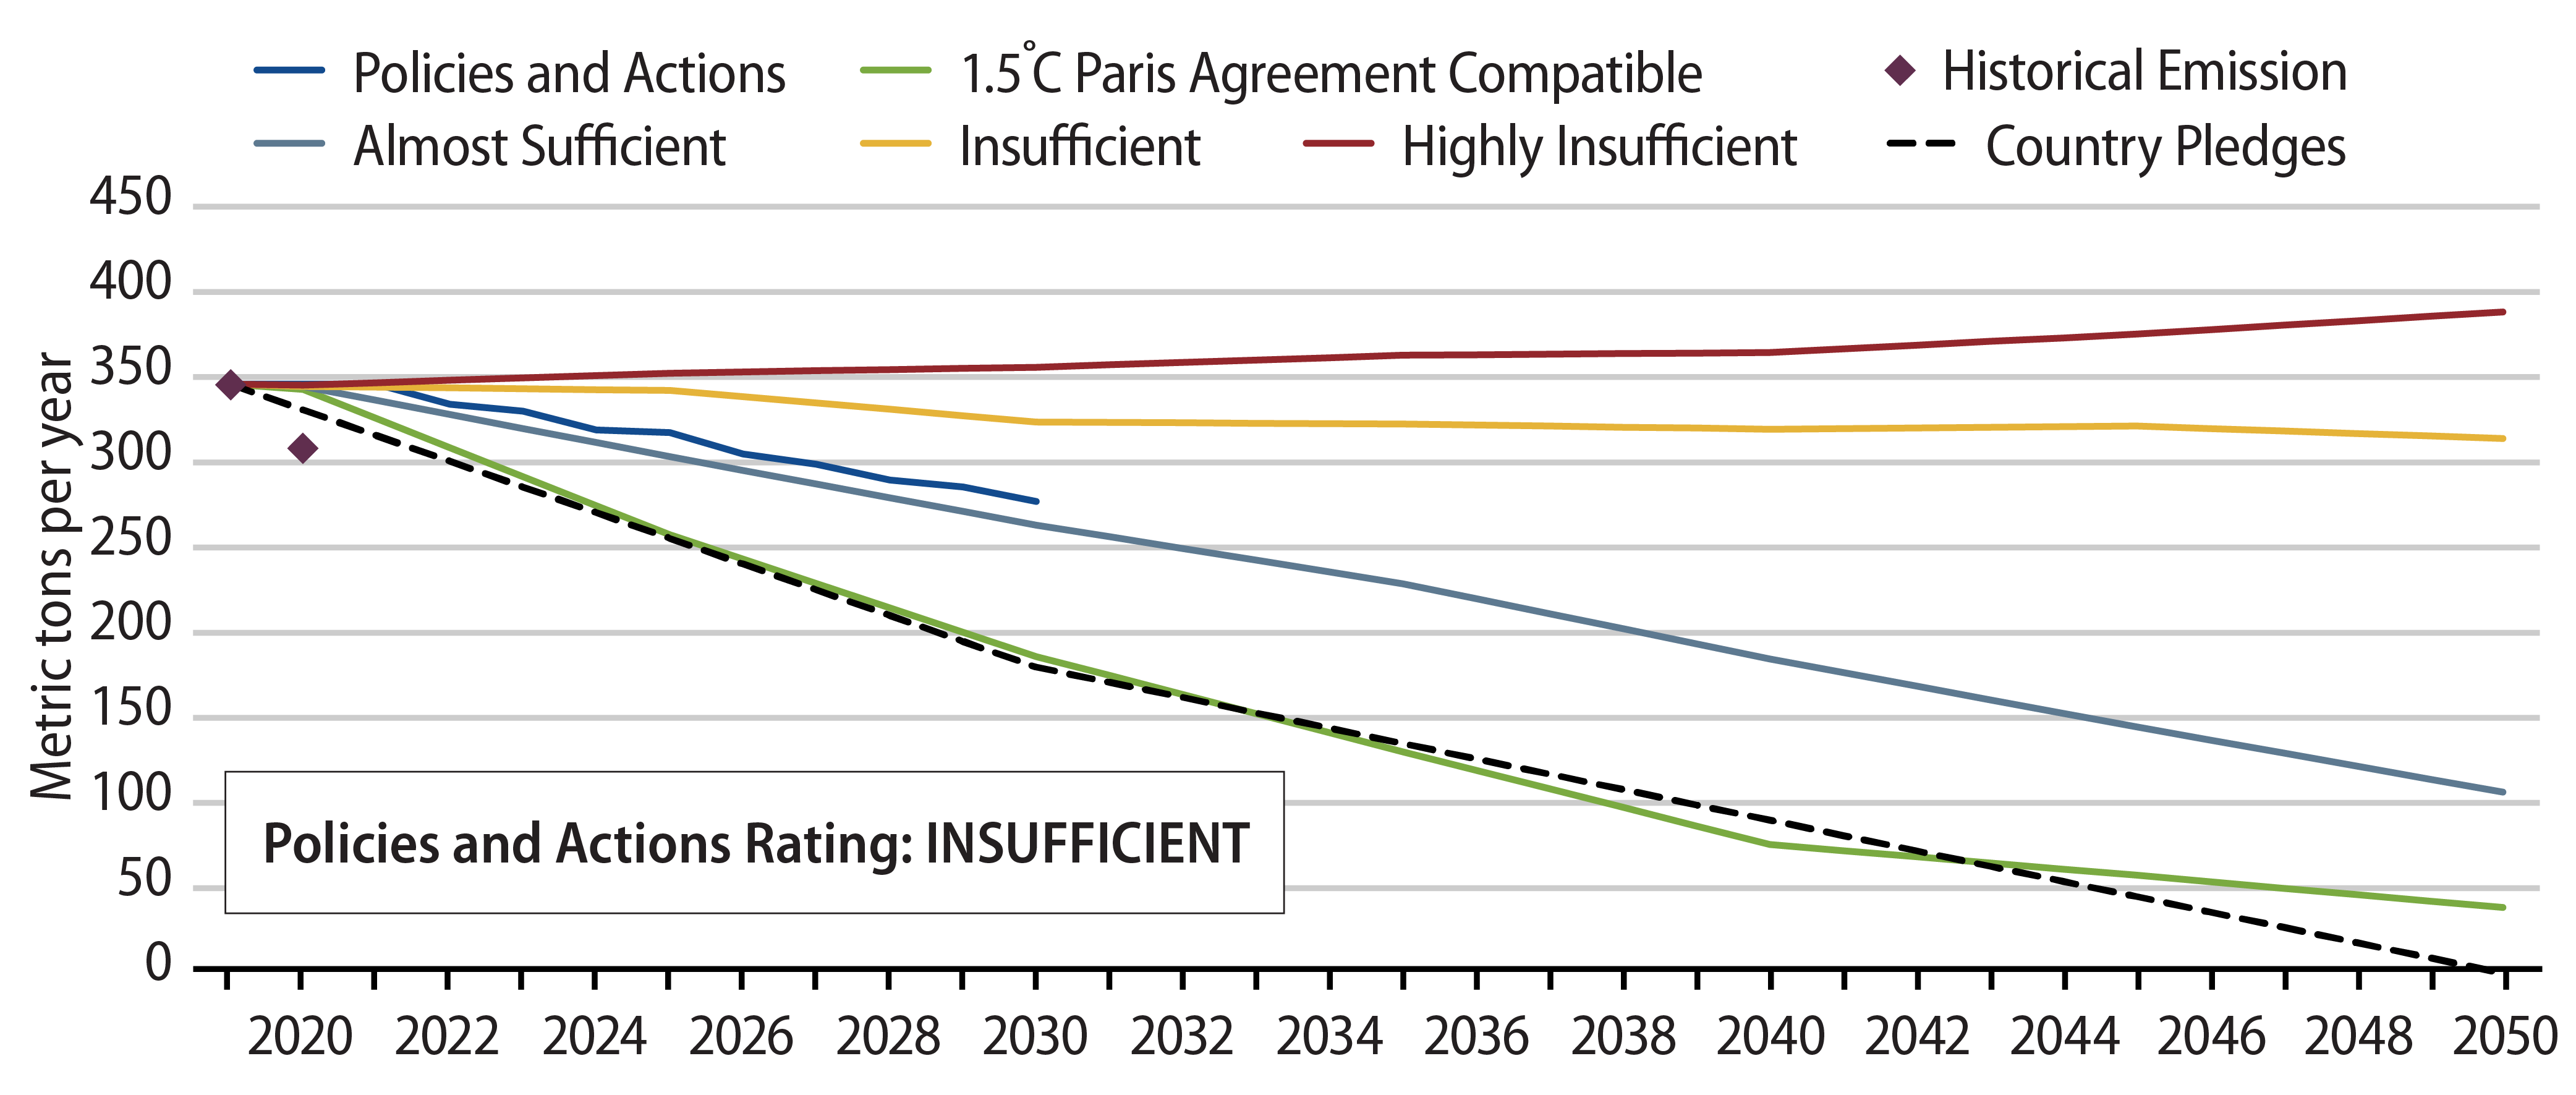
To assess what the fixed-income market tells us about the alignment of country targets with the Paris Agreement, we analyze the impact of decarbonization trajectories using a sovereign bond index as an example. This approach should yield insights into whether the sovereign fixed-income investment universe is compatible with the objectives of the Paris Agreement. Our methodology involves aggregating the emissions pathways of individual countries, weighted by each nation's market value share within each index. We showcase the outcomes for the Bloomberg Global Treasury Total Return Index Unhedged (the Index). By considering various factors such as the type of decarbonization pathway and the specific targets set, we have computed a weighted average emissions trajectory for the index extending to the year 2050. Assessment of country pledges and actions provided by CAT is only projected up to 2030.
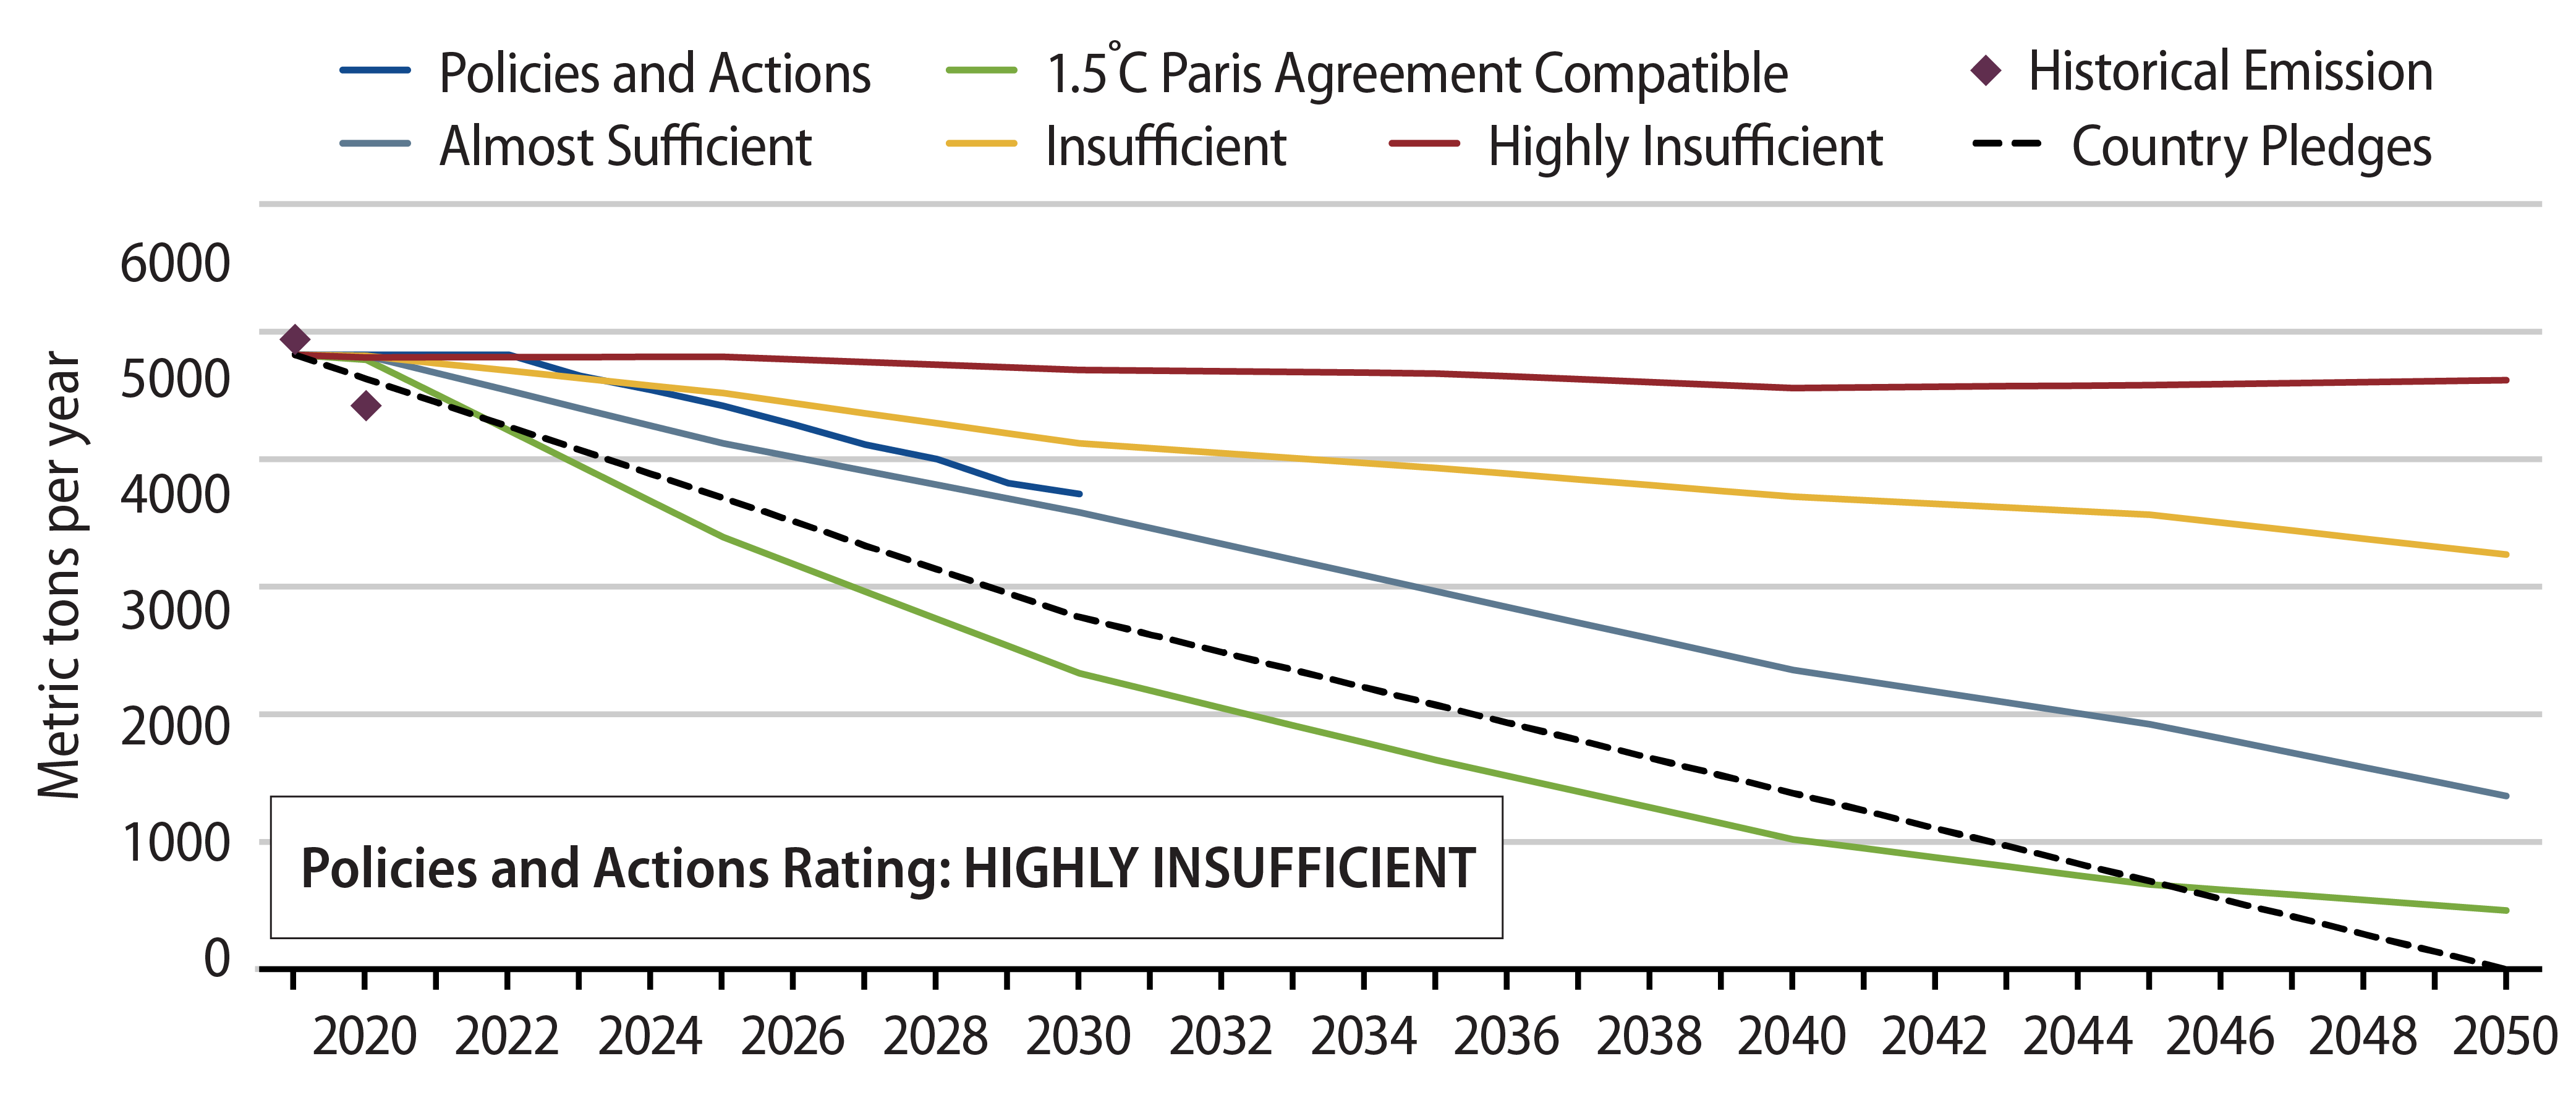
Exhibit 7 shows the resulting estimated decarbonization pathways for the Index. The Policies and Actions tra- jectory is based on the assessment of what is actually happening in each country to reduce emissions and the resulting pathway if all current policies are fully implemented. This exhibit also shows estimated trajectories of decarbon¬ization assuming all countries adopt policies and commitments compatible with Paris 1.5⁰C or Almost Sufficient, Insufficient or Highly Insufficient policies, as assessed by CAT. As can be seen, the Policies and Actions trajectory is assessed to be not sufficient to limiting global warming to 1.5⁰C above pre-industrial levels. Such Policies and Actions, weighted at the benchmark level, can only be considered as Insufficient. In fact, we can infer that the implied temperature rise of the Global Treasury benchmark would be 2⁰C to 3⁰C.
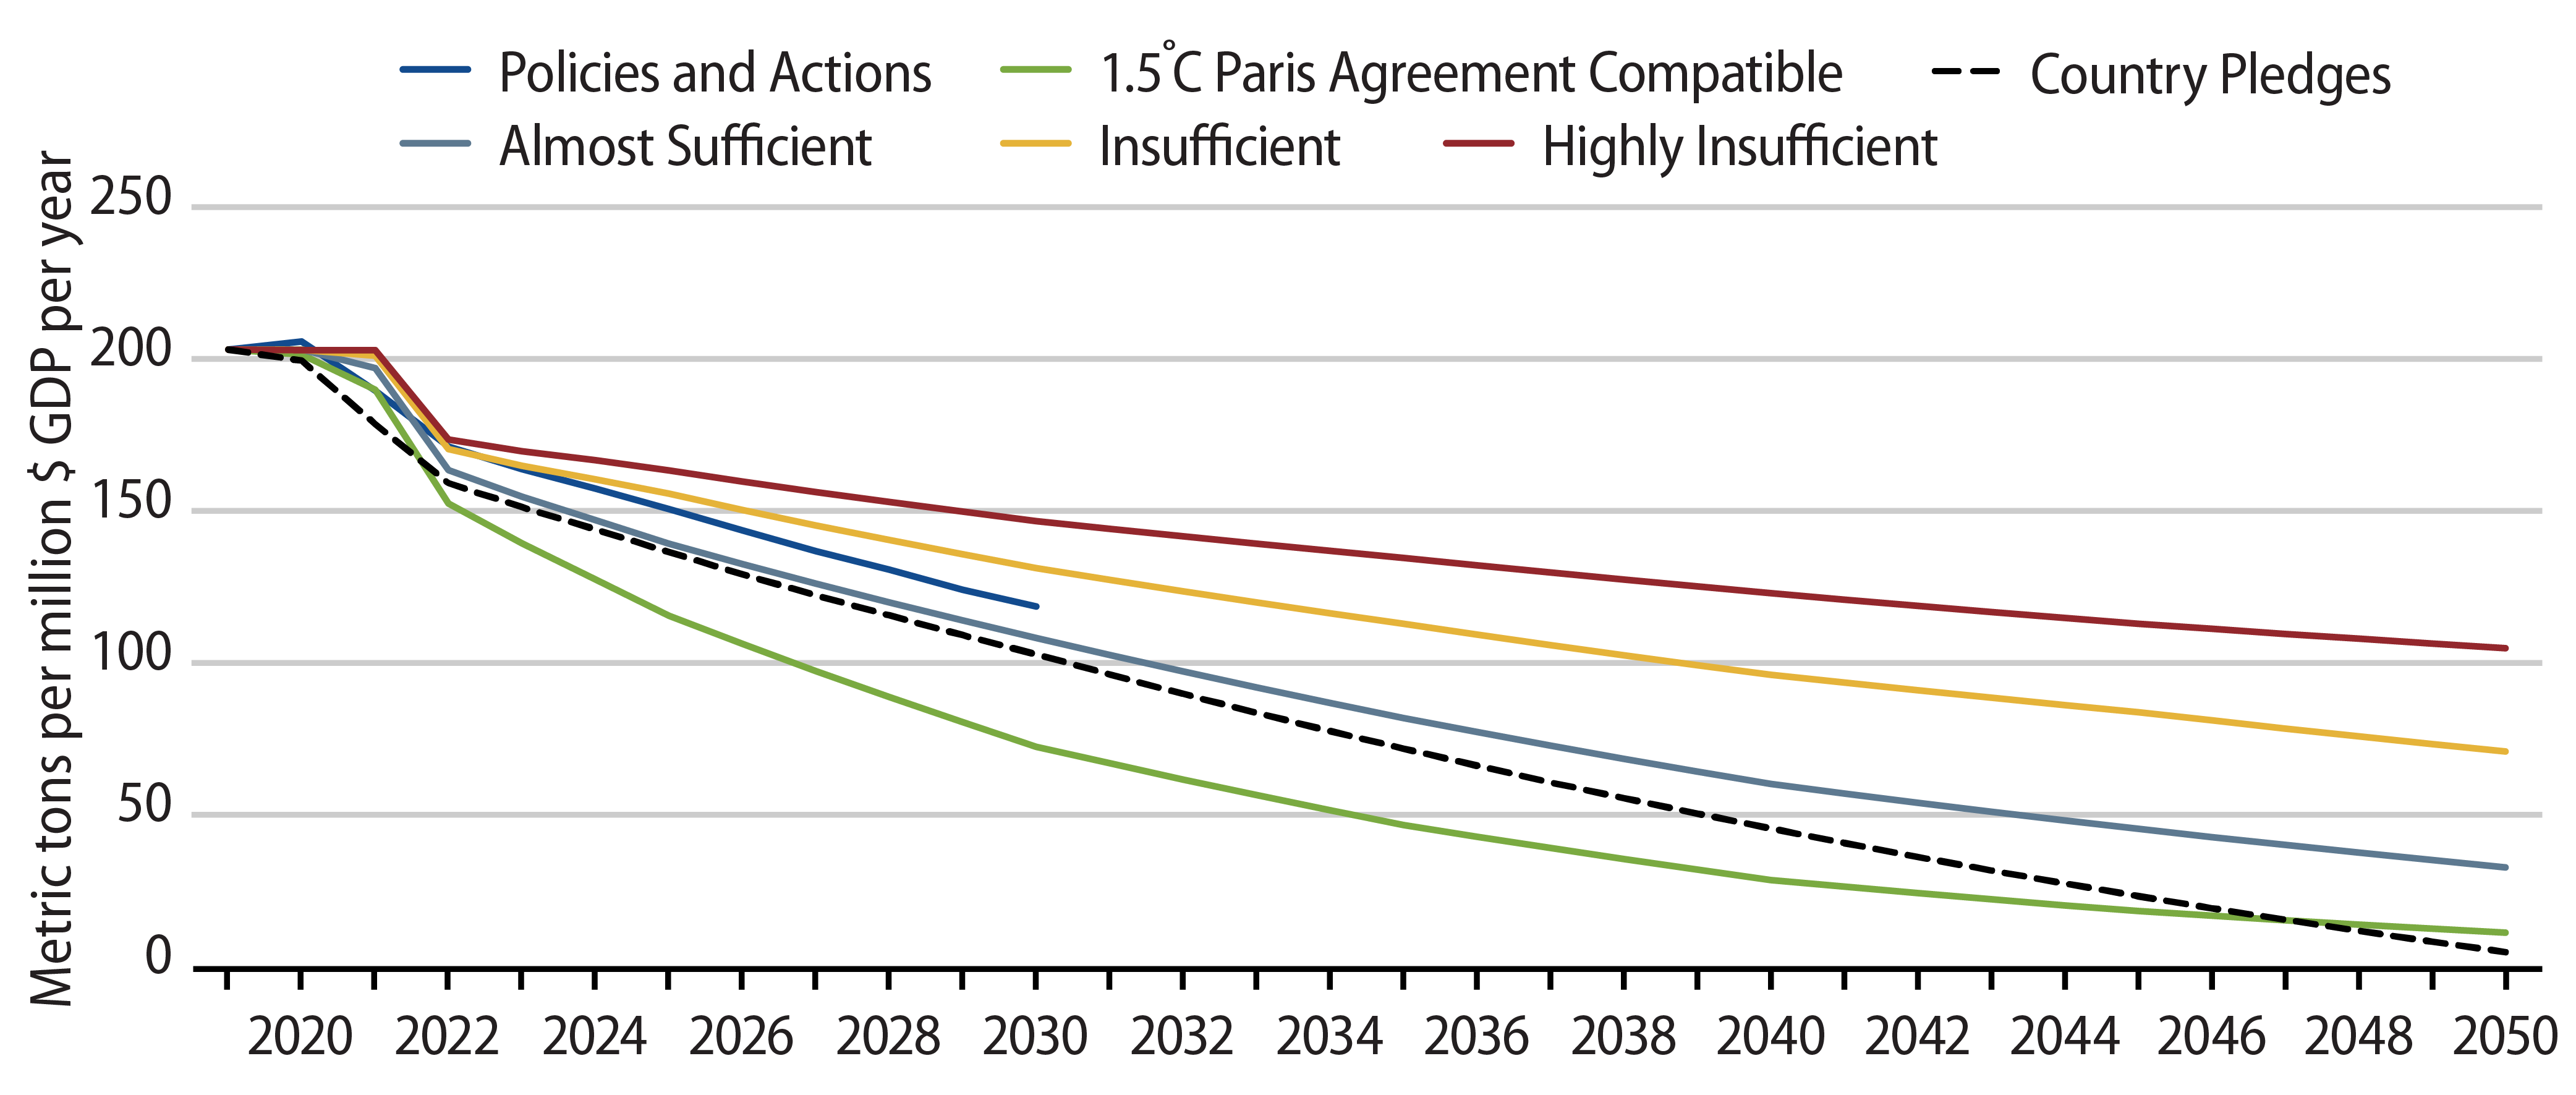
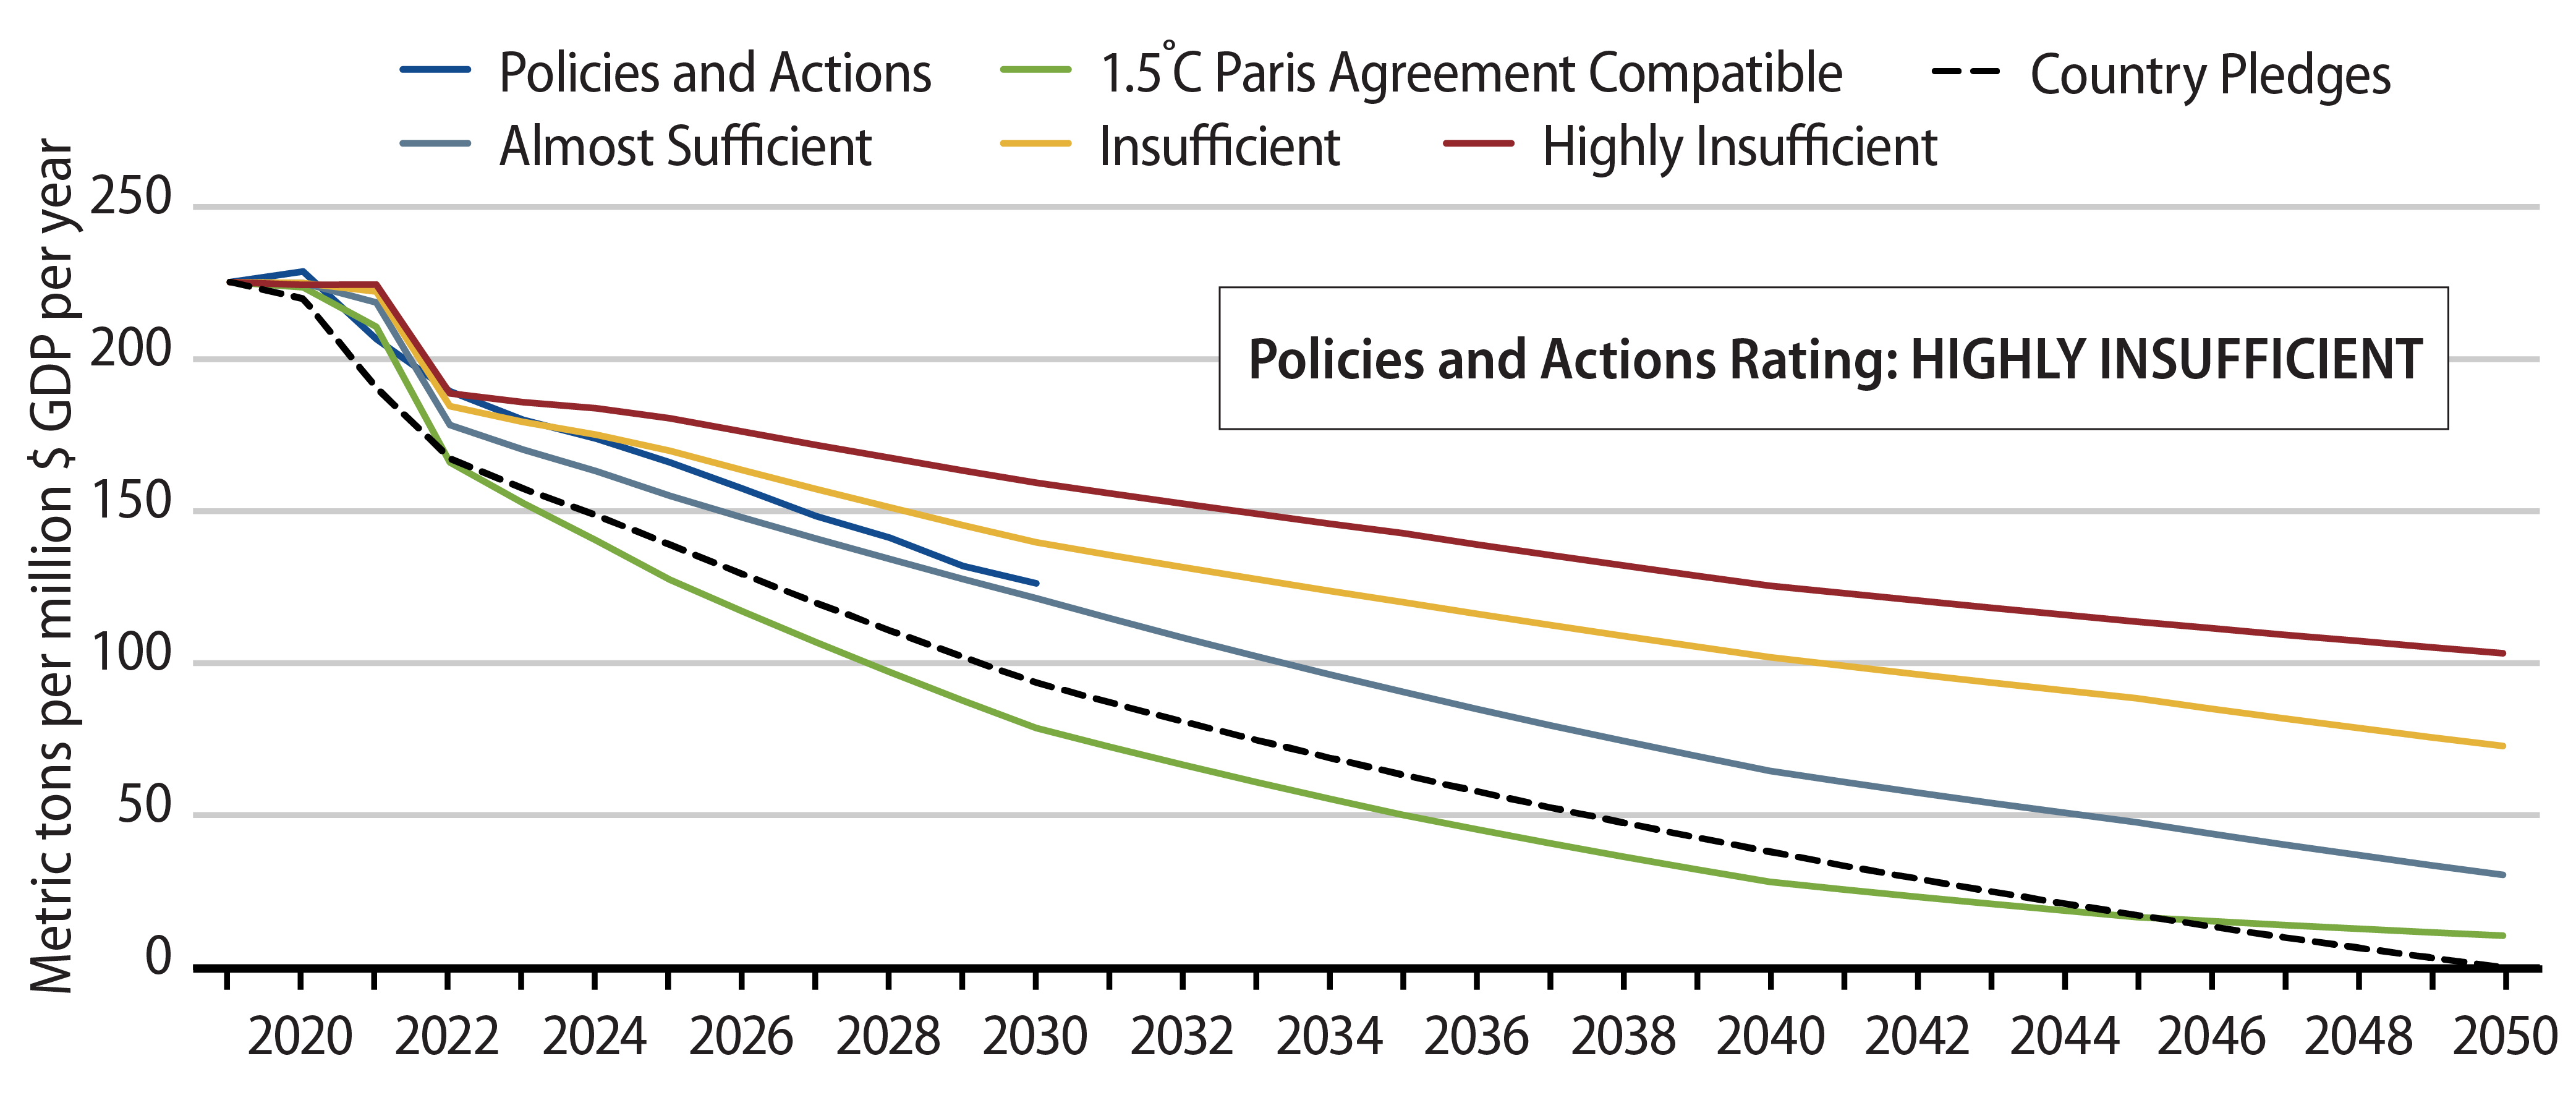
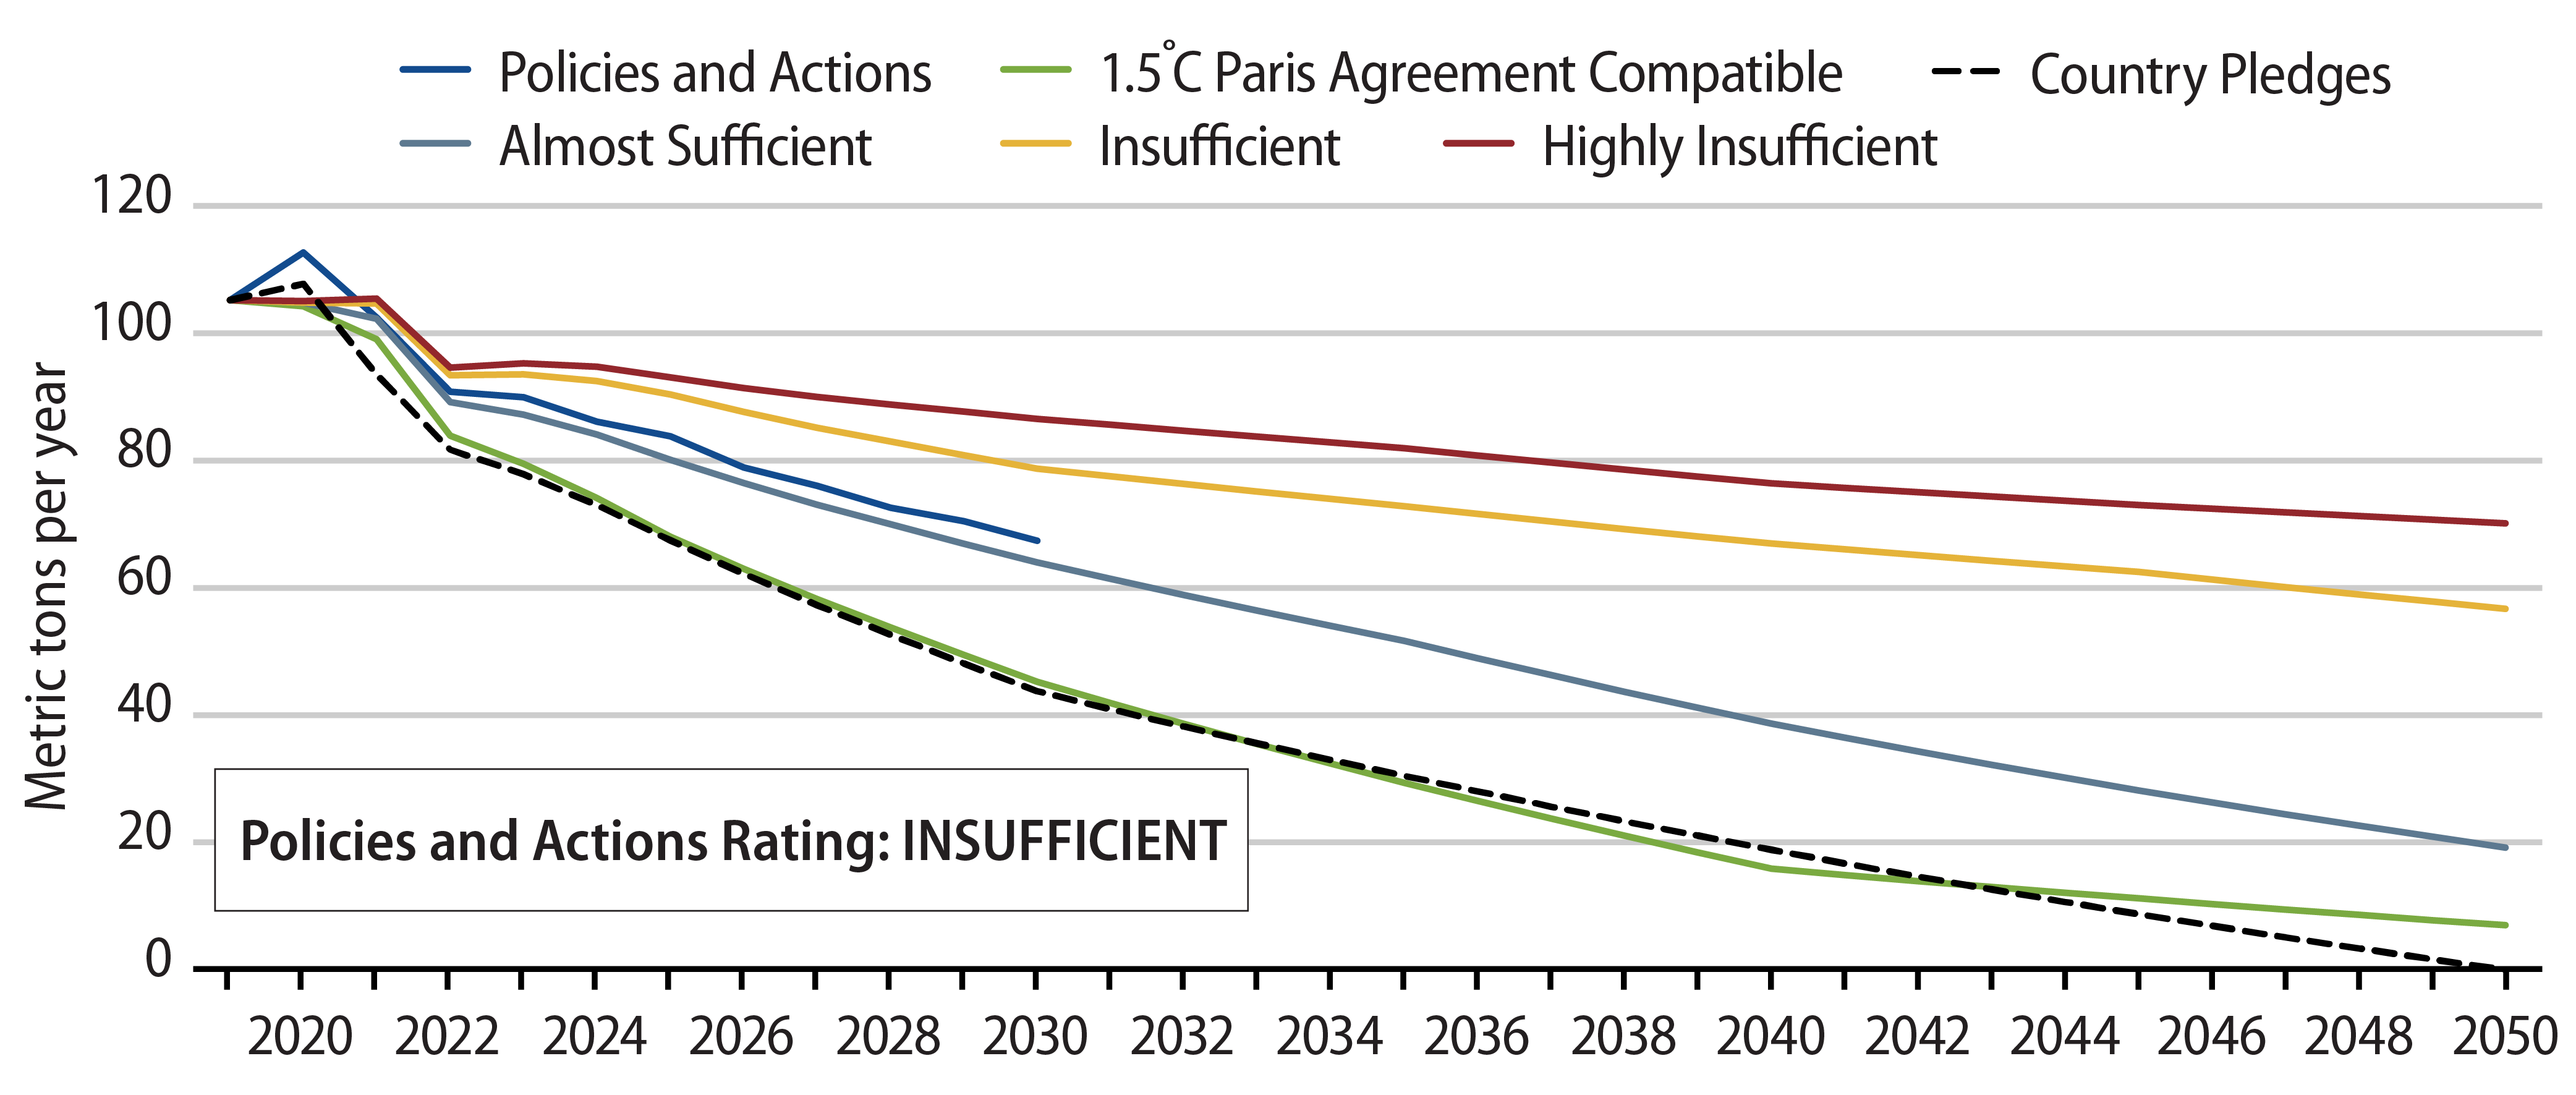
Incorporating a GDP forecast for each nation, alongside the aforementioned emissions trajectories, enables the projection of a weighted average carbon intensity pathway for each index as well. GDP forecasts from The IMF World Economic Outlook15 are used to 2028 and, the last GDP growth rate estimated by the IMF is assumed up to 2050, for each country. See Exhibit 8, where we show the Weighted Average Carbon Intensity (WACI) of the Index under the different pathways.
It is clear from the analysis that for a sovereign portfolio to stay on a net zero path, active rebalancing is needed. To gradually modify a bond portfolio keeping its main risk characteristics and aiming to achieve superior returns requires proper information, tools and expertise analysis. As mentioned earlier, countries are constantly revising their commitments and policies and their realized reduction achievements vary with time requiring dynamic analysis.
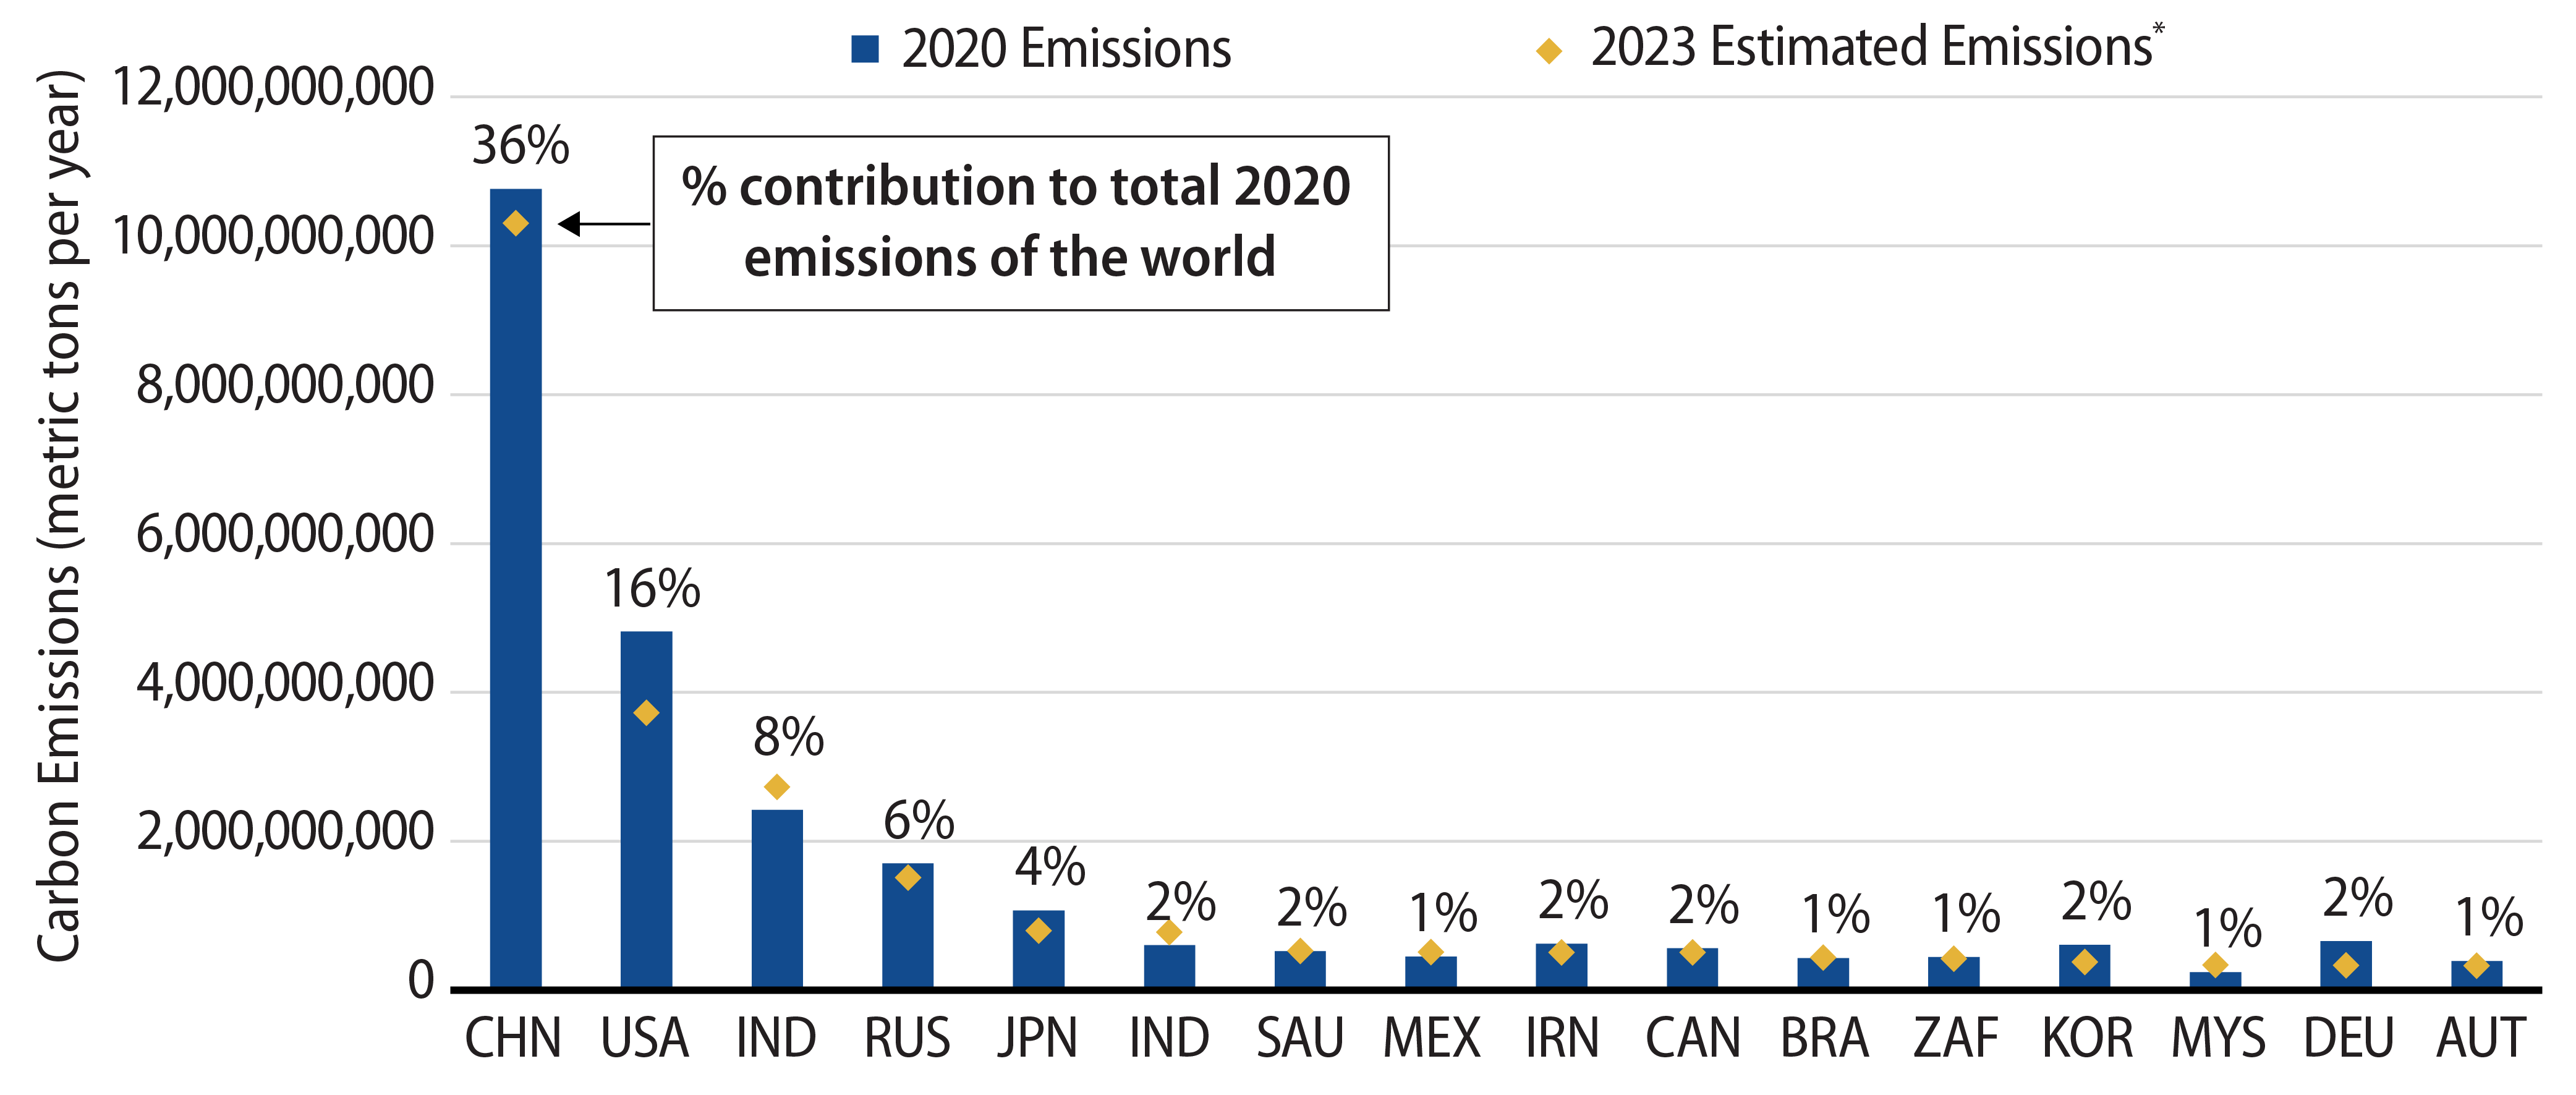
It is insightful to understand where different countries contribute to overall emissions and how their actions may modify their positions in the near future. Exhibit 9 shows how different countries compare in terms of emissions levels as of 2020 and the projections for 2030 based on their approved policies. Most of the reductions in emissions need to take place in China, the US and India.
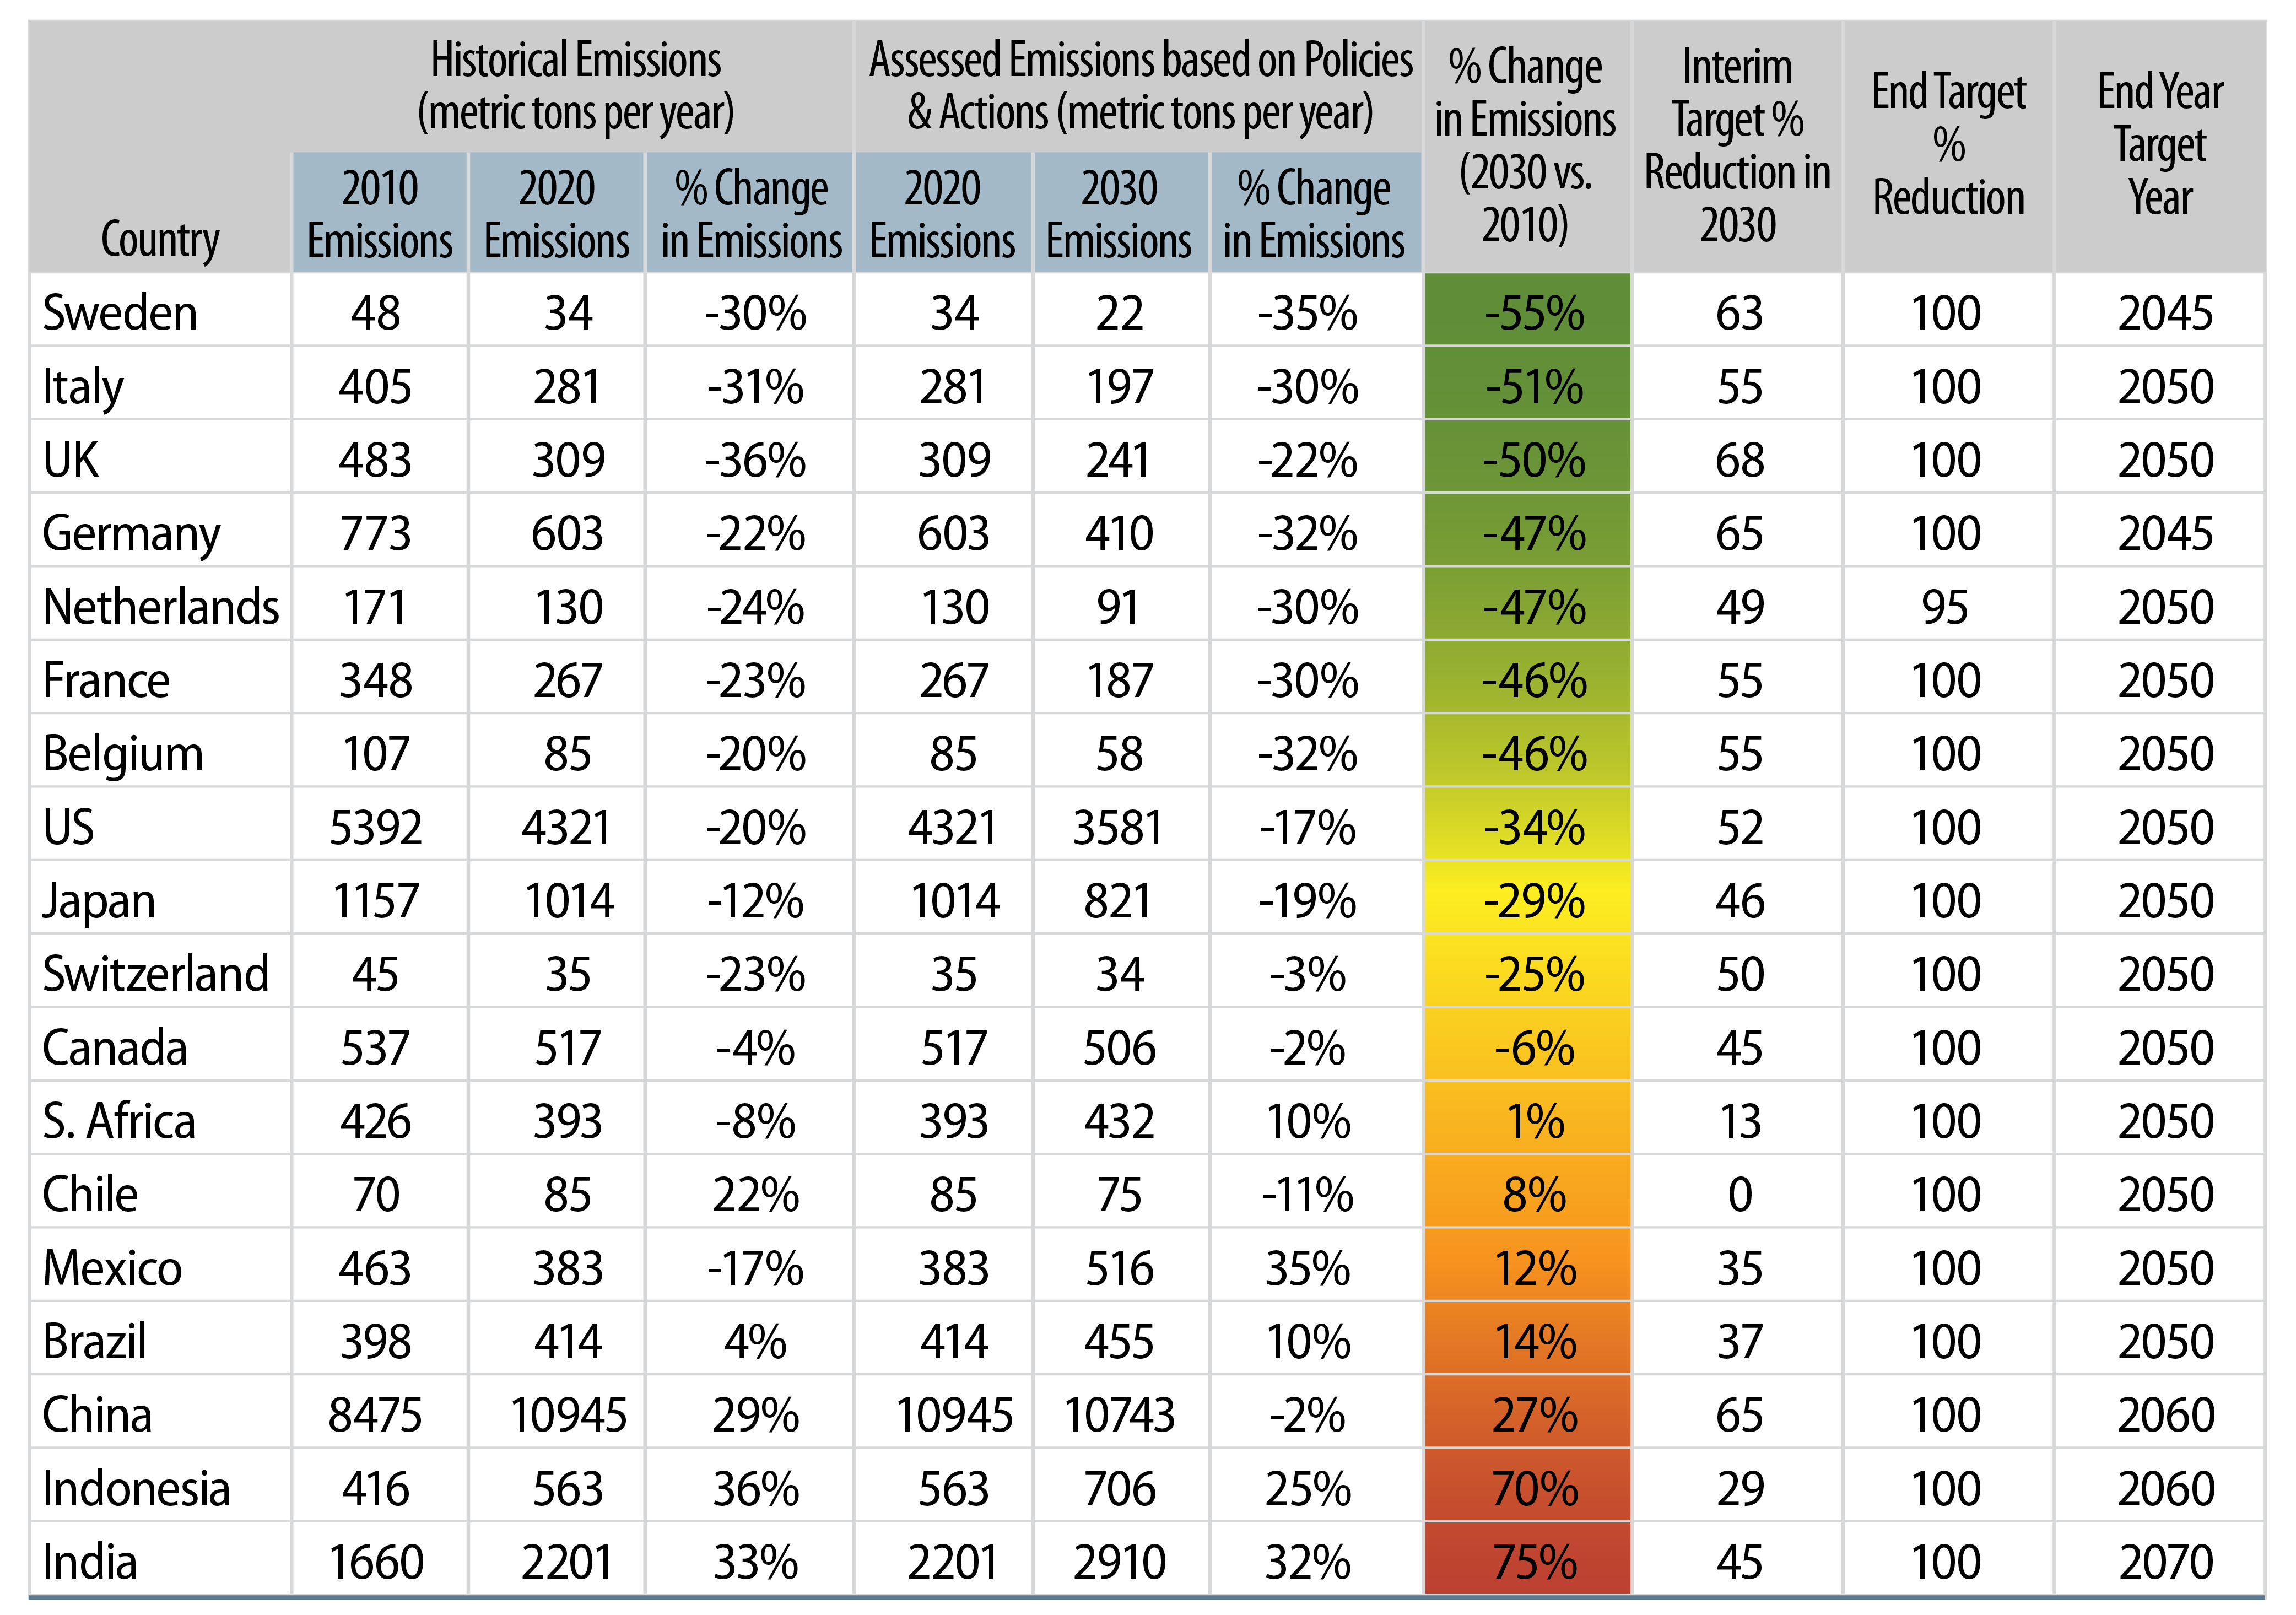
Finally, to compare the relative progress of a set of relevant countries, we produced Exhibit 10, which shows how countries' historical emissions changed from 2010 to 2020. Incorporating CAT's assessment of emissions reductions targets for each country to 2030, we have ranked countries based on their aggregated emissions reduction. For each country we list the 2030 interim target year percent reduction, as well as the end target year and percent reduction. Countries such as China, India, Indonesia and Malaysia are pledging to achieve net zero emissions at a later year (Exhibit 10).
Conclusions
The ambitious goal of limiting the Earth's temperature increase to 1.5⁰C above pre-industrial levels by the end of this century requires a concerted effort from all nations. Central to this effort is the attainment of net-zero emissions by 2050.
Using a sovereign bond index as an example, we assessed whether or not a net-zero emissions portfolio based on country targets is actually achievable. We find that, despite the commitments made by many countries, current policies and actions fall short of what is required to put the world on a trajectory toward net-zero emissions by 2050. Our analysis underscores the inadequacy of passive portfolio decarbonization strategies, particularly in the context of sovereign portfolios. With current country pledges, a passive approach fails to align portfolios with a net-zero pathway.
To steer sovereign portfolios toward net-zero compatibility, proactive measures are needed. This requires a gradual reallocation of country exposures, guided by a strategic approach informed by analysis and expertise. At Western Asset, we are at the forefront of this endeavor, collaborating with clients to help them meet their goals to develop and implement tailored strategies leveraging our proprietary tools and expert insights.
APPENDIX – US and UK Pathways
In this Appendix, we show the modelled pathways for both the US and UK.
- https://www.un.org/en/climatechange/net-zero-coalition
- https://unfccc.int/sites/default/files/resource/ Recommendations%20for%20Reducing%20Greenhouse%20Gas%20Emissions.pdf
- Joeri Rogelj, Drew Shindell, Kejun Jiang, Solomone Fifita, Piers Forster, Veronika Ginzburg, Collins Handa, Haroon Kheshgi, Shigeki Ko- bayashi, Elmar Kriegler, Luis Mundaca, Roland Seferian, and Maria Virginia Vilarino, "2018: Mitigation Pathways Compatible with 1.5°C in the Context of Sustainable Development," Global Warming of 1.5°C. An IPCC Special Report on the Impacts of Global Warming of 1.5°C Above Pre-Industrial Levels and Related Global Greenhouse Gas Emission Pathways, in the Context of Strengthening the Global Re- sponse to the Threat of Climate Change, Sustainable Development, and Efforts to Eradicate Poverty, edited by Valerie Masson-Delmotte, Panmao Zhai, Hans-Otto Portner, Debra Roberts, Jim Skea, Priyadarshi R. Shukla, Anna Pirani, Wilfran Moufouma-Okia, Clotilde Pean, Roz Pidcock, Sarah Connors, J.B. Robin Matthews, Yang Chen, Xiao Zhou, Melissa I. Gomis, Elisabeth Lonnoy, Tom Maycock, Melinda Tignor, and Tim Waterfield, (Cambridge, New York: Cambridge University Press: 2022): 93-174. https://www.ipcc.ch/site/assets/uploads/sites/2/2022/06/SR15_Full_Report_LR.pdf.
- https://zerotracker.net/
- www.climateactiontracker.org
- https://www.climate-transparency.org/wp-content/uploads/2021/01/Colombia-CT-2020.pdf
- https://unfccc.int/sites/default/files/NDC/2023-07/Third%20Update%20of%20Second%20NDC%20for%20the%20UAE_v15.pdf
- www.wri.org www.sciencebasedtargets.org
- www.un.org/en/climatechange/all-about-ndcs#:~:text=Simply%20put%2C%20an%20NDC%2C%20or,update%20it%20every%20 five%20years
- https://unfcc.int/process/the-paris-agreement/long-term-strategies
- https://carbon-neutrality.global
- https://climateinitiativesplatform.org/index.php/Climate_Ambition_Alliance:_Net_Zero_2050
- https://www.un.org/en/climatechange/net-zero-coalition
- https://www.imf.org/external/datamapper/NGDP_RPCH@WEO/OEMDC/ADVEC/WEOWORLD
- World Economic Outlook (October 2023) - Real GDP growth (imf.org)