skip navigation
Blog

Stay up to date on timely topics and market events. Subscribe to our Blog now.

MARKETS
January 05, 2021

Weekly Municipal Monitor—Year in Review

By Robert E. Amodeo, Judith Ewald, Sam Weitzman

Stay up to date on timely topics and market events. Subscribe to our Blog now.

Quiet Week for Muni Yields

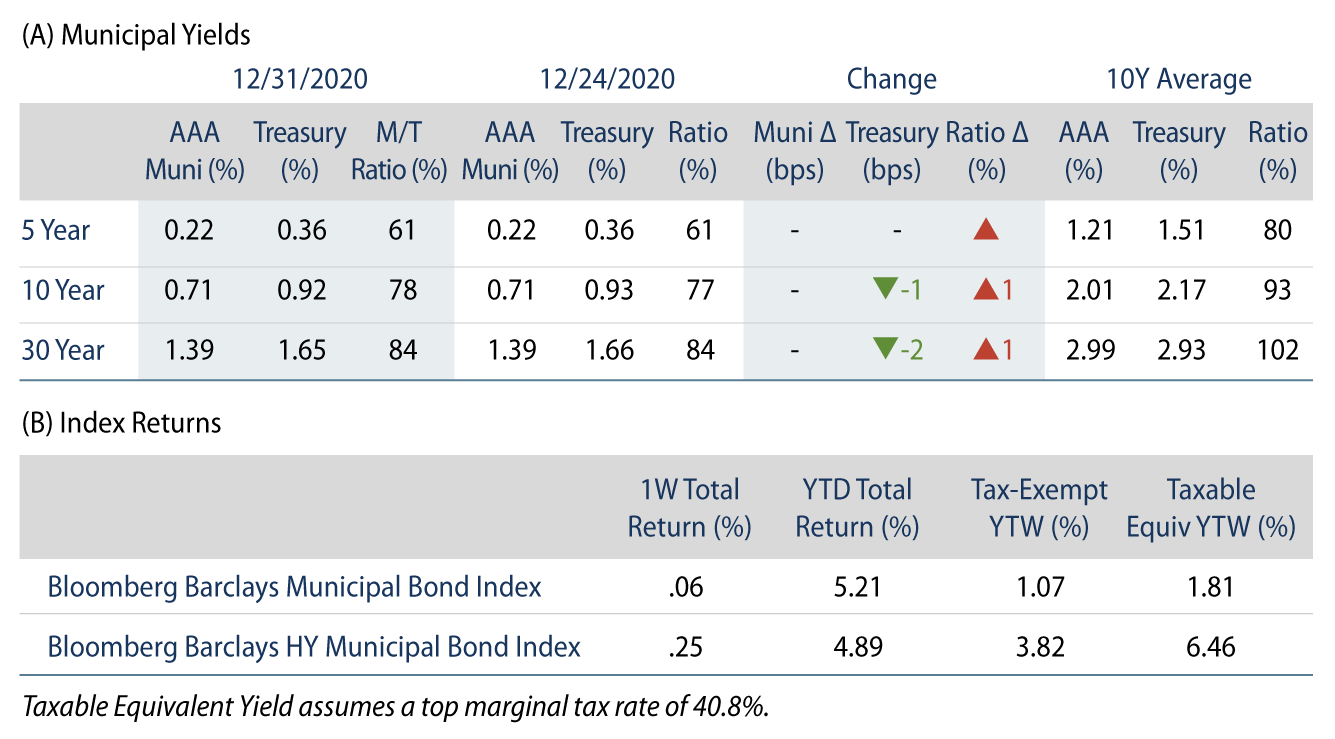
Municipal yields were unchanged during the quiet holiday-shortened week. Fund flows remained positive while new-issue supply was virtually non-existent during the last two weeks of 2020. AAA municipal yields were also unchanged during the week. Municipal/Treasury ratios moved slightly higher as Treasuries rallied. The Bloomberg Barclays Municipal Index returned 0.06%, while the HY Muni Index returned 0.25%. All told, the investment-grade index returned 5.21% in 2020, while the high-yield index returned 4.89%. This week we look back at last year’s key performance drivers and touch on our outlook as we head into 2021.

Municipal Technicals Remain Strong, Supported by Positive Fund Flows

Fund Flows: Municipal mutual funds recorded eight consecutive weeks of inflows to end the year. According to Lipper, during the week ending December 30 municipal mutual funds recorded $1.8 billion of net inflows. Long-term funds recorded $704 million of inflows, intermediate funds recorded $140 million of outflows and high-yield funds recorded $228 million of inflows. Municipal mutual fund net inflows ended the year at $39.7 billion, despite the $47.5 billion of outflows observed in March and April.

Supply: The muni market recorded $390 million of new-issue volume over the last two holiday-shortened weeks. Issuance of $498 billion in 2020 marked a record year of issuance, up 18% year-over-year (YoY), primarily driven by higher taxable issuance, which was 118% higher YoY. Tax-exempt issuance declined 3.8% YoY.

This Week in Munis: Year in Review

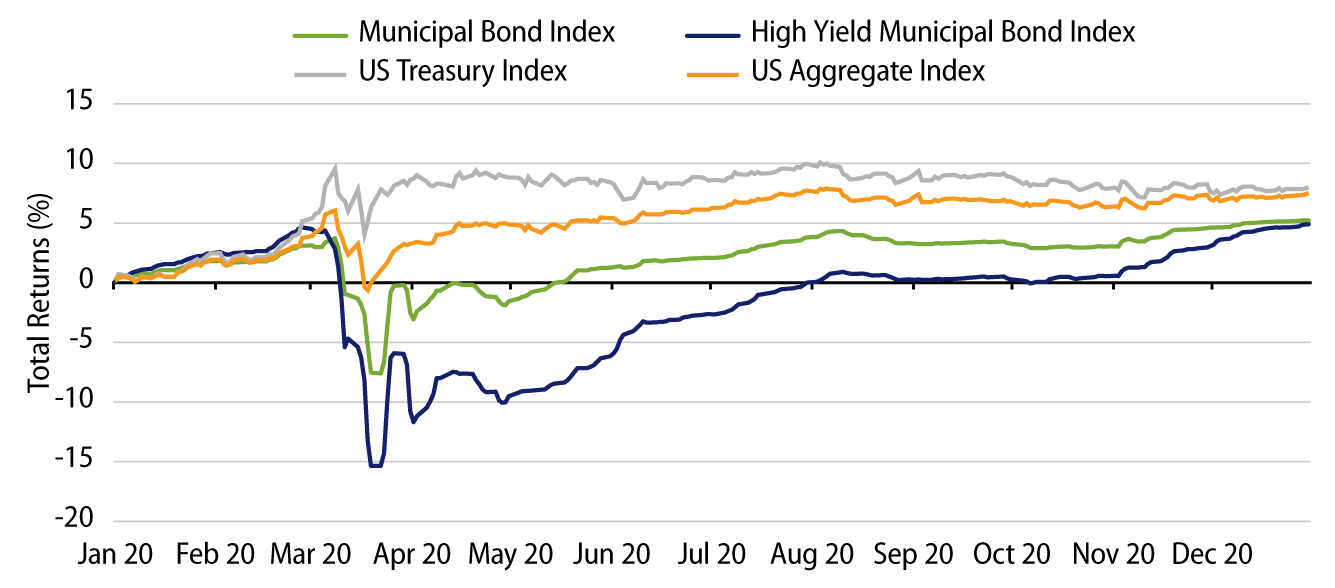
It was an unprecedented year for the municipal market. Munis disconnected from their traditional safe-haven status amid the heightened illiquidity and credit challenges observed in March when municipal mutual funds recorded their most rapid outflow cycle in the history of the municipal market. The Bloomberg Barclays Municipal Bond Index declined nearly 11% over that two-week period.

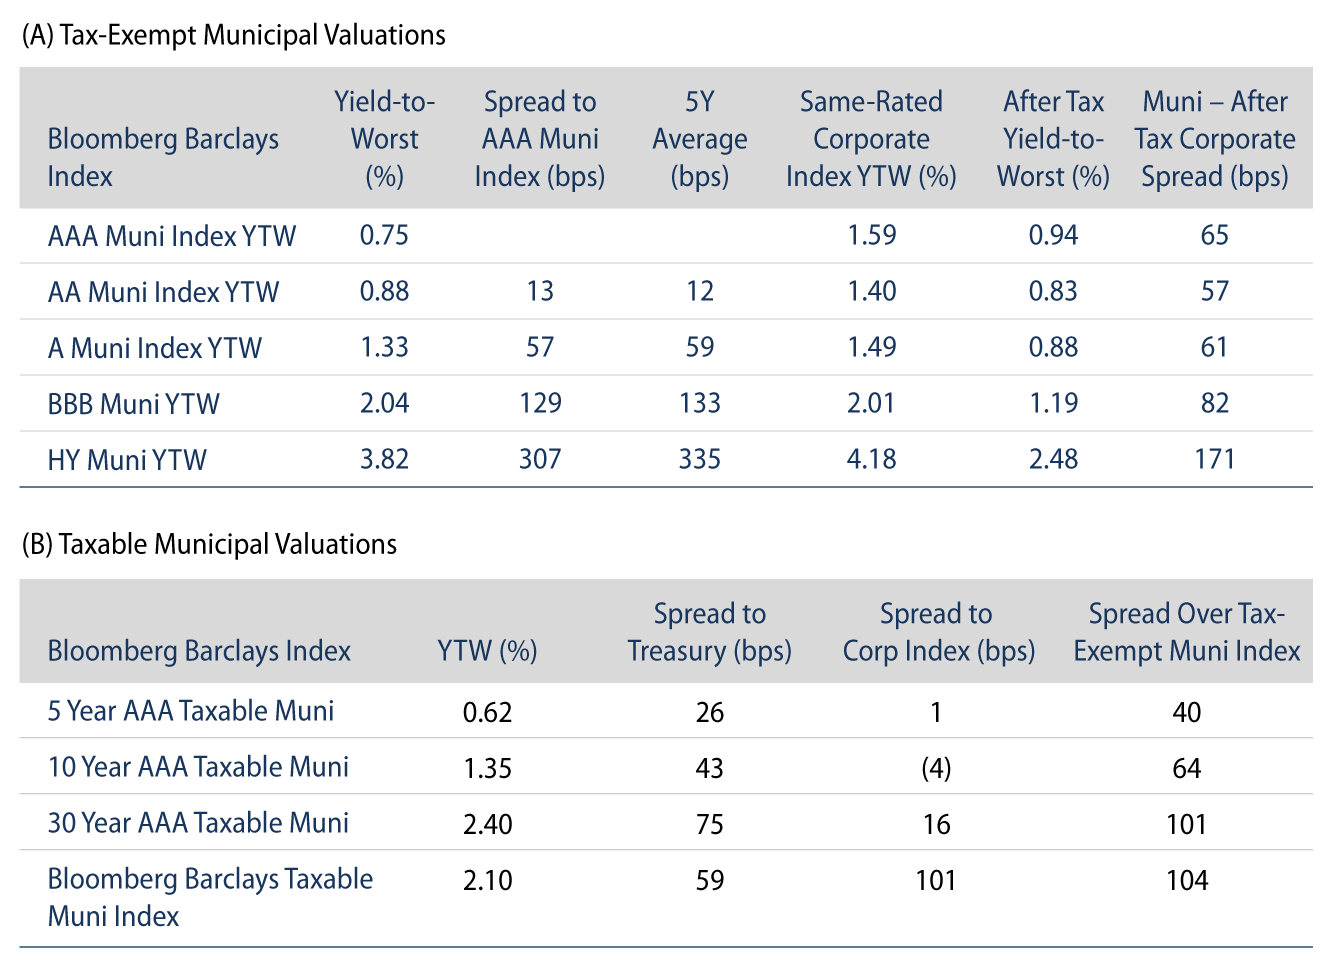
Following the congressional aid and Federal Reserve stabilization measures, the muni market recovered throughout 2020 and fund flows ended the year in positive territory. All told, the Bloomberg Barclays Municipal Bond Index returned 5.21% and the Taxable Municipal Bond Index returned 10.52%. Tax-exempts underperformed Treasuries and like-rated corporates, while taxable munis outperformed on increasing global demand for the asset class.

Quality Returns: Highest-quality municipals were the best performers of 2020, largely due to the severity of the pandemic-related drawdowns, particularly in HY municipal funds. AAA, AA and A rated indices returned 5.51%, 5.24%, and 5.27%, respectively. BBB and HY municipal indices underperformed, returning 4.55% and 4.89%, respectively.

Sector Returns: From a sector perspective, general obligation (GO) bonds outpaced revenue bonds, with the GO sector returning 5.49% and the revenue-backed sector returning 5.31%. Top-performing revenue sectors included the essential services; investment-grade tobacco, water & sewer, and health care sectors outperformed, returning 6.60%, 5.86% and 5.70%, respectively. Resource recovery, special tax and housing underperformed the broader index, returning 3.11%, 4.73%, and 4.47%, respectively.

Curve Returns: Duration contributed to municipal returns, as 10-year muni bonds and beyond outperformed the index for calendar year 2020. However, intermediate munis were the top performers as the 15-year municipal bond index returned 6.32% for the year.

Exhibit 1: YTD Total Returns by Asset Class
Explore YTD Total Returns by Asset Class.
Source: Bloomberg Barclays. As of 31 Dec 20. Select the image to expand the view.

Our Preliminary 2021 Muni Outlook

  • Municipalities will continue to grapple with the economic impact of the pandemic and their need to address sizeable budget gaps through the first half of 2021 as large parts of the US remain quarantined. We do not anticipate vaccine rollouts to materially impact growth ahead of the second quarter.

  • While states and locals did not receive the well-publicized stimulus needed to address revenue shortfalls, we expect the muni market to still benefit either directly or indirectly from the $900 billion bill passed through Congress at the end of 2020. The $281 billion Paycheck Protection Program should be supportive of tax collections, while certain sectors should benefit from direct aid measures, including $54 billion for primary and secondary education, $45 billion for transportation and $23 billion for higher education. We also anticipate Democrats will push for additional aid, specifically aid for state and local governments, after January 20 when President-elect Biden takes office.

  • Given the anticipated austerity measures that will result from the budgetary gaps which are likely to persist throughout the year, absent additional aid, we anticipate downgrades to outpace upgrades, but for defaults to remain concentrated within the speculative-grade segment of the municipal market.

  • The volatility and unprecedented conditions seen in 2020 underscore the benefits of active management in the municipal market. These benefits include investment managers’ ability to independently evaluate credits and anticipate expected volatility associated with downgrade pressures, as well as to manage liquidity ahead of increased market sensitivity to fund flow cycles.

Exhibit 2: Municipal Bond Yields and Index Return
Explore Municipal Bond Yields and Index Return.
Sources: (A) Muni yields: Thomson Reuters MMD; Treasury Yields: Bloomberg. As of 31 Dec 20.
(B) Bloomberg. As of 31 Dec 20. Select the image to expand the view.
Exhibit 3: Tax-Exempt and Taxable Municipal Valuations
Explore Tax-Exempt and Taxable Municipal Valuations.
Sources: (A) Bloomberg, Western Asset. AAA, AA, A, BBB Corporate Indices. After-tax yield assumes a top effective tax rate of 40.8%. As of 31 Dec 20.
(B) Bloomberg, Western Asset; Taxable Muni Index Corporate comparable used is the long corporate (ex. BBB) to better align credit quality and duration. As of 31 Dec 20. Select the image to expand the view.
© Western Asset Management Company, LLC 2024. The information contained in these materials ("the materials") is intended for the exclusive use of the designated recipient ("the recipient"). This information is proprietary and confidential and may contain commercially sensitive information, and may not be copied, reproduced or republished, in whole or in part, without the prior written consent of Western Asset Management Company ("Western Asset").
Past performance does not predict future returns. These materials should not be deemed to be a prediction or projection of future performance. These materials are intended for investment professionals including professional clients, eligible counterparties, and qualified investors only.
These materials have been produced for illustrative and informational purposes only. These materials contain Western Asset's opinions and beliefs as of the date designated on the materials; these views are subject to change and may not reflect real-time market developments and investment views.
Third party data may be used throughout the materials, and this data is believed to be accurate to the best of Western Asset's knowledge at the time of publication, but cannot be guaranteed. These materials may also contain strategy or product awards or rankings from independent third parties or industry publications which are based on unbiased quantitative and/or qualitative information determined independently by each third party or publication. In some cases, Western Asset may subscribe to these third party's standard industry services or publications. These standard subscriptions and services are available to all asset managers and do not influence rankings or awards in any way.
Investment strategies or products discussed herein may involve a high degree of risk, including the loss of some or all capital. Investments in any products or strategies described in these materials may be volatile, and investors should have the financial ability and willingness to accept such risks.
Unless otherwise noted, investment performance contained in these materials is reflective of a strategy composite. All other strategy data and information included in these materials reflects a representative portfolio which is an account in the composite that Western Asset believes most closely reflects the current portfolio management style of the strategy. Performance is not a consideration in the selection of the representative portfolio. The characteristics of the representative portfolio shown may differ from other accounts in the composite. Information regarding the representative portfolio and the other accounts in the composite are available upon request. Statements in these materials should not be considered investment advice. References, either general or specific, to securities and/or issuers in the materials are for illustrative purposes only and are not intended to be, and should not be interpreted as, recommendation to purchase or sell such securities. Employees and/or clients of Western Asset may have a position in the securities or issuers mentioned.
These materials are not intended to provide, and should not be relied on for, accounting, legal, tax, investment or other advice. The recipient should consult its own counsel, accountant, investment, tax, and any other advisers for this advice, including economic risks and merits, related to making an investment with Western Asset. The recipient is responsible for observing the applicable laws and regulations of their country of residence.
Founded in 1971, Western Asset Management Company is a global fixed-income investment manager with offices in Pasadena, New York, London, Singapore, Tokyo, Melbourne, São Paulo, Hong Kong, and Zürich. Western Asset is a wholly owned subsidiary of Franklin Resources, Inc. but operates autonomously. Western Asset is comprised of six legal entities across the globe, each with distinct regional registrations: Western Asset Management Company, LLC, a registered Investment Adviser with the Securities and Exchange Commission; Western Asset Management Company Distribuidora de Títulos e Valores Mobiliários Limitada is authorized and regulated by Comissão de Valores Mobiliários and Brazilian Central Bank; Western Asset Management Company Pty Ltd ABN 41 117 767 923 is the holder of the Australian Financial Services License 303160; Western Asset Management Company Pte. Ltd. Co. Reg. No. 200007692R is a holder of a Capital Markets Services License for fund management and regulated by the Monetary Authority of Singapore; Western Asset Management Company Ltd, a registered Financial Instruments Business Operator and regulated by the Financial Services Agency of Japan; and Western Asset Management Company Limited is authorised and regulated by the Financial Conduct Authority ("FCA") (FRN 145930). This communication is intended for distribution to Professional Clients only if deemed to be a financial promotion in the UK as defined by the FCA. This communication may also be intended for certain EEA countries where Western Asset has been granted permission to do so. For the current list of the approved EEA countries please contact Western Asset at +44 (0)20 7422 3000.