skip navigation
Blog

Stay up to date on timely topics and market events. Subscribe to our Blog now.

MARKETS
June 16, 2020

Weekly Municipal Monitor—Muni Payrolls Decline, Highlighting Austerity

By Sam Weitzman, Robert E. Amodeo

Stay up to date on timely topics and market events. Subscribe to our Blog now.

Municipal market returns grinded higher last week, supported by strong flows into municipal mutual funds and seasonally high coupon and principal reinvestment which offset an elevated calendar. This week we take a deeper dive into jobs data associated with COVID-19 economic impacts to assess varying degrees of austerity at the state and local levels.

The Muni Market Posted Positive Returns Last Week

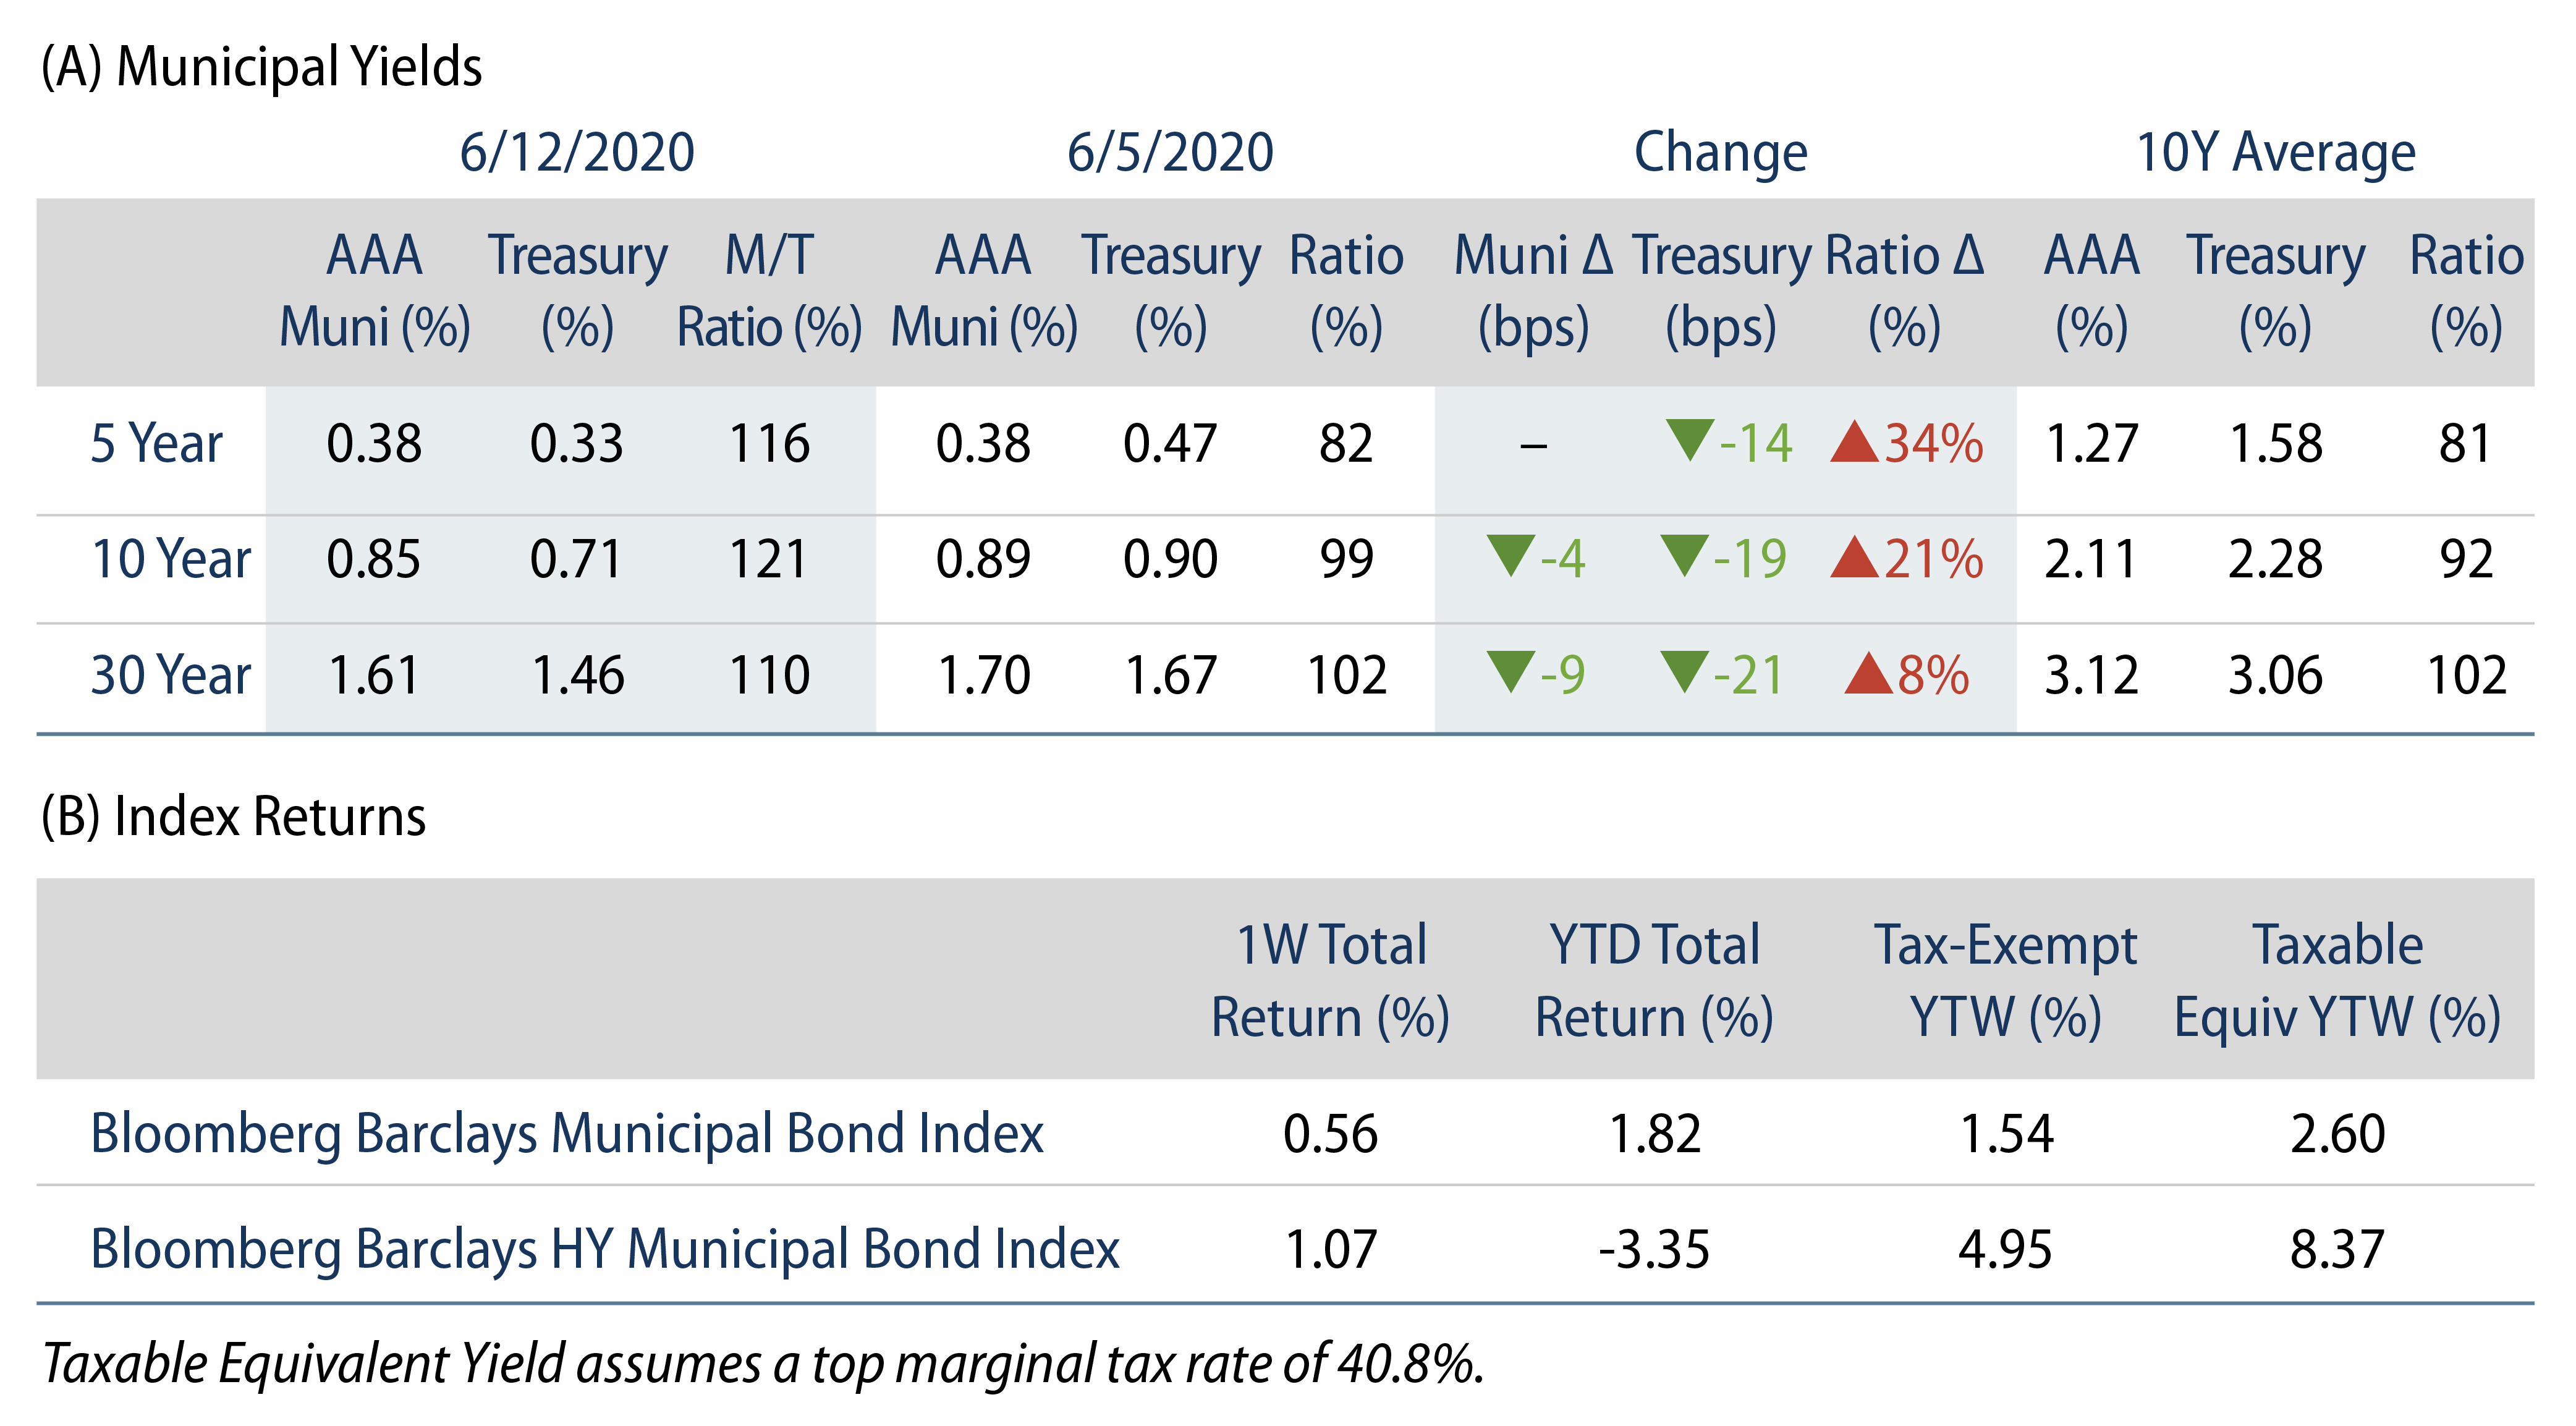
AAA municipal yields moved lower in intermediate and long maturities, supported by a rally in Treasury rates and robust fund flows. The Bloomberg Barclays Municipal Index returned 0.56%, while the HY Muni Index returned 1.07%. The outperformance in Treasuries resulted in increasing Muni/Treasury Ratios, particularly at the short end.

Muni Technicals Strengthen, Supported by Robust Fund Flows

Municipal mutual funds reported $2.8 billion of inflows, a fifth consecutive week of inflows. Long-term funds recorded $2.0 billion of inflows, HY funds recorded $572 million of inflows and intermediate funds recorded $1 billion of inflows. Year-to-date (YTD) municipal fund net outflows now total $11.5 billion. In addition to robust fund flows, the municipal market typically sees seasonally high coupon and principal payments in June and July, which can drive reinvestment into the asset class.

The elevated municipal fund inflows and coupon/principal reinvestment offset an elevated supply calendar. The muni market recorded $11.3 billion of new-issue volume last week, up 10% from the prior week. YTD issuance of $173 billion is 17% above last year’s pace, primarily driven by taxable supply, which is over 3x that of last year’s levels while tax-exempt supply remains below last year’s levels. We anticipate an approximate $12 billion calendar next week, led by $1.9 billion from the New York State Urban Development Commission and $794 million in taxable Texas Transportation Commission transactions.

This Week in Munis: Muni Payrolls Decline, Highlighting Austerity

Following the better-than-expected jobs report released on June 5, this week we are highlighting state and local payroll declines that we have observed across the nation. As the economic impact of COVID-19 roils state and local finances, austerity comes into focus. Given state and local financial disclosures are frequently dated, Western Asset’s credit research team utilizes many real-time tools to assess changing credit conditions, one of which is monthly state and local payroll reports released by the Bureau of Labor Statistics (Exhibit 1).

Exhibit 1: State and Local Payroll Growth
Explore State and Local Payroll Growth.
Source: Bloomberg, BLS, Western Asset. As of 31 May 20. Select the image to expand the view.

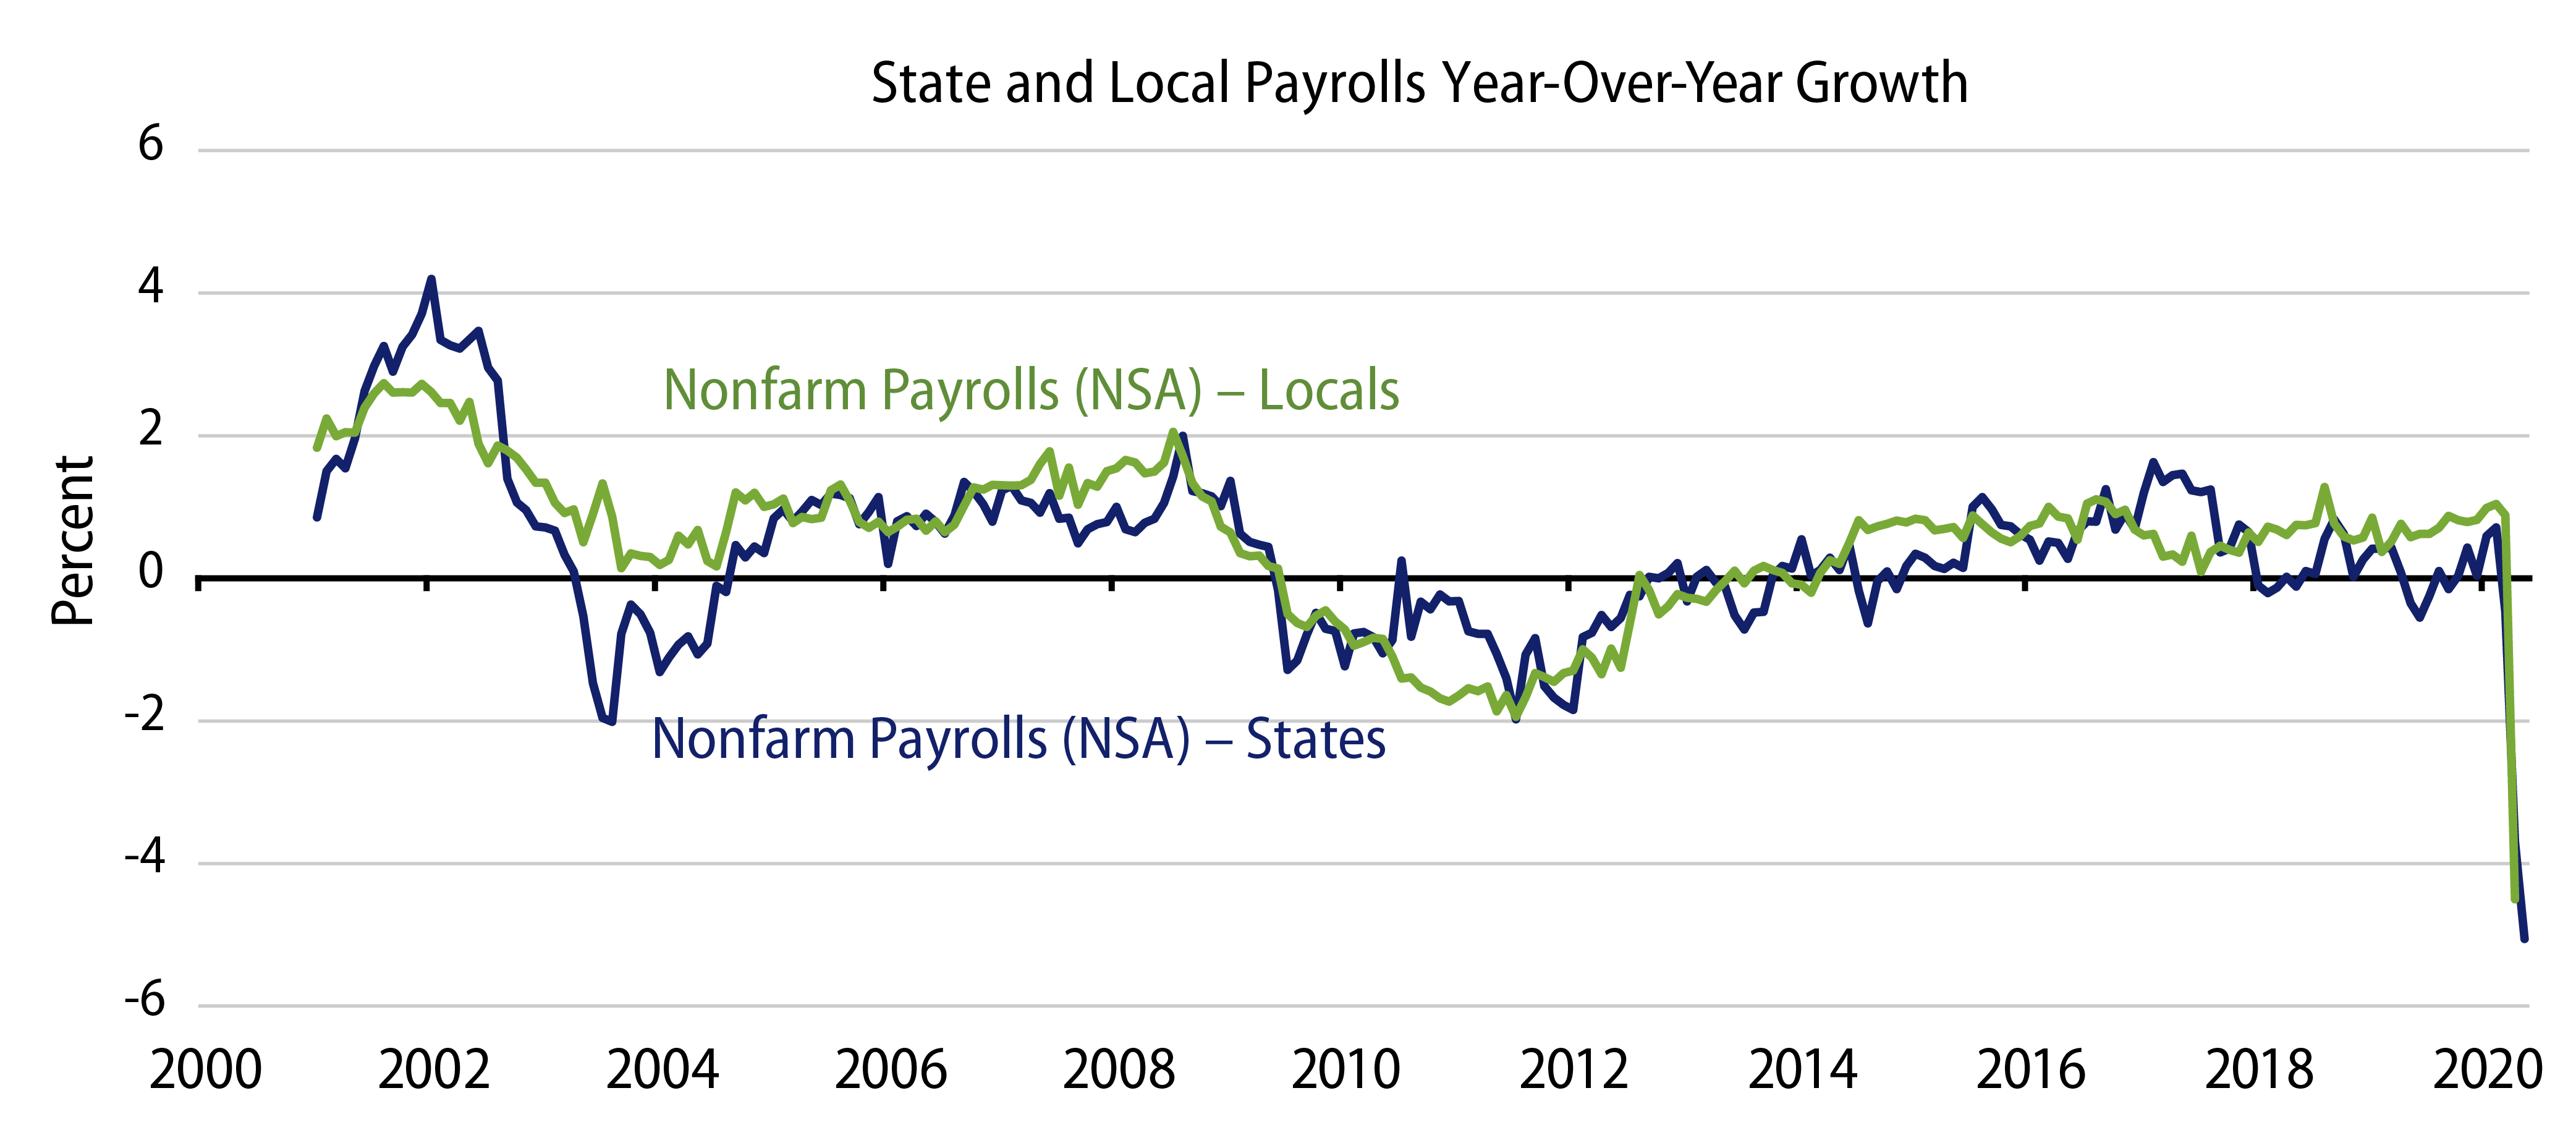
In May, state and local payrolls declined 662,000 to 18.6 million, down 3.6% month-over-month. Considering payroll declines in March and April, states and local municipalities reduced employment by approximately 1.6 million individuals, which is approximately 7.9% below February highs, and steeper than prior recessions. Looking at the state-level detail as of April 30, Michigan, Vermont and Hawaii observed the largest payroll declines, consistent with the manufacturing and tourism strain in those economies.

While not great for growth (state and local spending accounts for approximately 14% of GDP), spending reductions and payroll cuts are what we have seen from states and locals to meet their obligations in the past, and what our base case calls for going forward. However, we remain cautious on local general obligations and downstream entities that could receive lower state funding due to budgetary stress.

Exhibit 2: Municipal Bond Yields and Index Returns
Explore Municipal Bond Yields and Index Returns.
Source: (A) Muni Yields: Thomson Reuters MMD; Treasury Yields: Bloomberg. As of 12 June 20.
(B) Bloomberg. As of 12 June 20. Select the image to expand the view.
Exhibit 3: Tax-Exempt and Taxable Municipal Valuations
Explore Tax-Exempt and Taxable Municipal Valuations.
Source: (A) Bloomberg, Western Asset. AAA, AA, A, BBB Corporate Indices. As of 12 June 20.
(B) Bloomberg, Western Asset, Taxable Muni Index Corporate comparable used is the Long Corporate (ex. BBB) to better align credit quality and duration. As of 12 June 20. Select the image to expand the view.
© Western Asset Management Company, LLC 2024. The information contained in these materials ("the materials") is intended for the exclusive use of the designated recipient ("the recipient"). This information is proprietary and confidential and may contain commercially sensitive information, and may not be copied, reproduced or republished, in whole or in part, without the prior written consent of Western Asset Management Company ("Western Asset").
Past performance does not predict future returns. These materials should not be deemed to be a prediction or projection of future performance. These materials are intended for investment professionals including professional clients, eligible counterparties, and qualified investors only.
These materials have been produced for illustrative and informational purposes only. These materials contain Western Asset's opinions and beliefs as of the date designated on the materials; these views are subject to change and may not reflect real-time market developments and investment views.
Third party data may be used throughout the materials, and this data is believed to be accurate to the best of Western Asset's knowledge at the time of publication, but cannot be guaranteed. These materials may also contain strategy or product awards or rankings from independent third parties or industry publications which are based on unbiased quantitative and/or qualitative information determined independently by each third party or publication. In some cases, Western Asset may subscribe to these third party's standard industry services or publications. These standard subscriptions and services are available to all asset managers and do not influence rankings or awards in any way.
Investment strategies or products discussed herein may involve a high degree of risk, including the loss of some or all capital. Investments in any products or strategies described in these materials may be volatile, and investors should have the financial ability and willingness to accept such risks.
Unless otherwise noted, investment performance contained in these materials is reflective of a strategy composite. All other strategy data and information included in these materials reflects a representative portfolio which is an account in the composite that Western Asset believes most closely reflects the current portfolio management style of the strategy. Performance is not a consideration in the selection of the representative portfolio. The characteristics of the representative portfolio shown may differ from other accounts in the composite. Information regarding the representative portfolio and the other accounts in the composite are available upon request. Statements in these materials should not be considered investment advice. References, either general or specific, to securities and/or issuers in the materials are for illustrative purposes only and are not intended to be, and should not be interpreted as, recommendation to purchase or sell such securities. Employees and/or clients of Western Asset may have a position in the securities or issuers mentioned.
These materials are not intended to provide, and should not be relied on for, accounting, legal, tax, investment or other advice. The recipient should consult its own counsel, accountant, investment, tax, and any other advisers for this advice, including economic risks and merits, related to making an investment with Western Asset. The recipient is responsible for observing the applicable laws and regulations of their country of residence.
Founded in 1971, Western Asset Management Company is a global fixed-income investment manager with offices in Pasadena, New York, London, Singapore, Tokyo, Melbourne, São Paulo, Hong Kong, and Zürich. Western Asset is a wholly owned subsidiary of Franklin Resources, Inc. but operates autonomously. Western Asset is comprised of six legal entities across the globe, each with distinct regional registrations: Western Asset Management Company, LLC, a registered Investment Adviser with the Securities and Exchange Commission; Western Asset Management Company Distribuidora de Títulos e Valores Mobiliários Limitada is authorized and regulated by Comissão de Valores Mobiliários and Brazilian Central Bank; Western Asset Management Company Pty Ltd ABN 41 117 767 923 is the holder of the Australian Financial Services License 303160; Western Asset Management Company Pte. Ltd. Co. Reg. No. 200007692R is a holder of a Capital Markets Services License for fund management and regulated by the Monetary Authority of Singapore; Western Asset Management Company Ltd, a registered Financial Instruments Business Operator and regulated by the Financial Services Agency of Japan; and Western Asset Management Company Limited is authorised and regulated by the Financial Conduct Authority ("FCA") (FRN 145930). This communication is intended for distribution to Professional Clients only if deemed to be a financial promotion in the UK as defined by the FCA. This communication may also be intended for certain EEA countries where Western Asset has been granted permission to do so. For the current list of the approved EEA countries please contact Western Asset at +44 (0)20 7422 3000.