skip navigation
Blog

Stay up to date on timely topics and market events. Subscribe to our Blog now.

ECONOMY
August 07, 2020

Americans Getting Back to Work in July, Contrary to Popular Perceptions

By Michael J. Bazdarich, PhD

Stay up to date on timely topics and market events. Subscribe to our Blog now.

Payroll jobs rose by 1.763 million in July, with private-sector jobs up 1.462 million. The “core” jobs measure we usually track, private sector less construction and retailing, gained 1.184 million jobs. June job counts were revised up for total jobs and down for private sector, but these changes were slight relative to the monthly changes.

Before making editorial comment, we’ll stipulate that the July gains are far lower than 4-to-5 million gains of June (how could they not be?) and July employment levels remain well below the pre-shutdown levels of February. Still, the announced July gains are far stronger than one would have expected given media accounts of a faltering/reversing economic recovery, and the data clearly show workers gradually getting back on the job.

It is hard work putting data together from all sectors of the economy. When private-sector and media analysts attempt to front-run the official news, they can easily be swayed by anecdotes and, occasionally, by political and epidemiological biases. Hence, we were skeptical of various claims that the economic recovery was relapsing in July in the face of a rebound in COVID cases. Those caseloads have since started to head down again, and, meanwhile, today’s data failed to show any meaningful setbacks in the pace of economic recovery.

There were a few pockets of especially strong gains, namely restaurants up 502,000, retail trade up 258,000, public schools up 215,000, temporary help services up 144,000, health care up 126,000, apparel stores up 121,000, personal services (barbers, etc.) up 119,000, recreation up 87,000, and childcare up 45,000. The public school gains are a false flag, as teachers who normally would have been “furloughed” in July this year went off the payrolls in May. The other large gains here are more substantial. Elsewhere, gains were more modest, with a few sectors showing slight declines, as there almost always are.

To put things in perspective, the accompanying table shows how various sectors have performed: those we normally focus on (construction, manufacturing, etc.), those showing especially sharp July gains and those sectors we have been describing in recent months as having been especially hard hit by the shutdown.

Exhibit 1: Some Details of Payroll Job Changes
Explore Some Details of Payroll Job Changes.
Bureau of Labor Statistics. As of 31 Jul 2020. Select the image to expand the view.

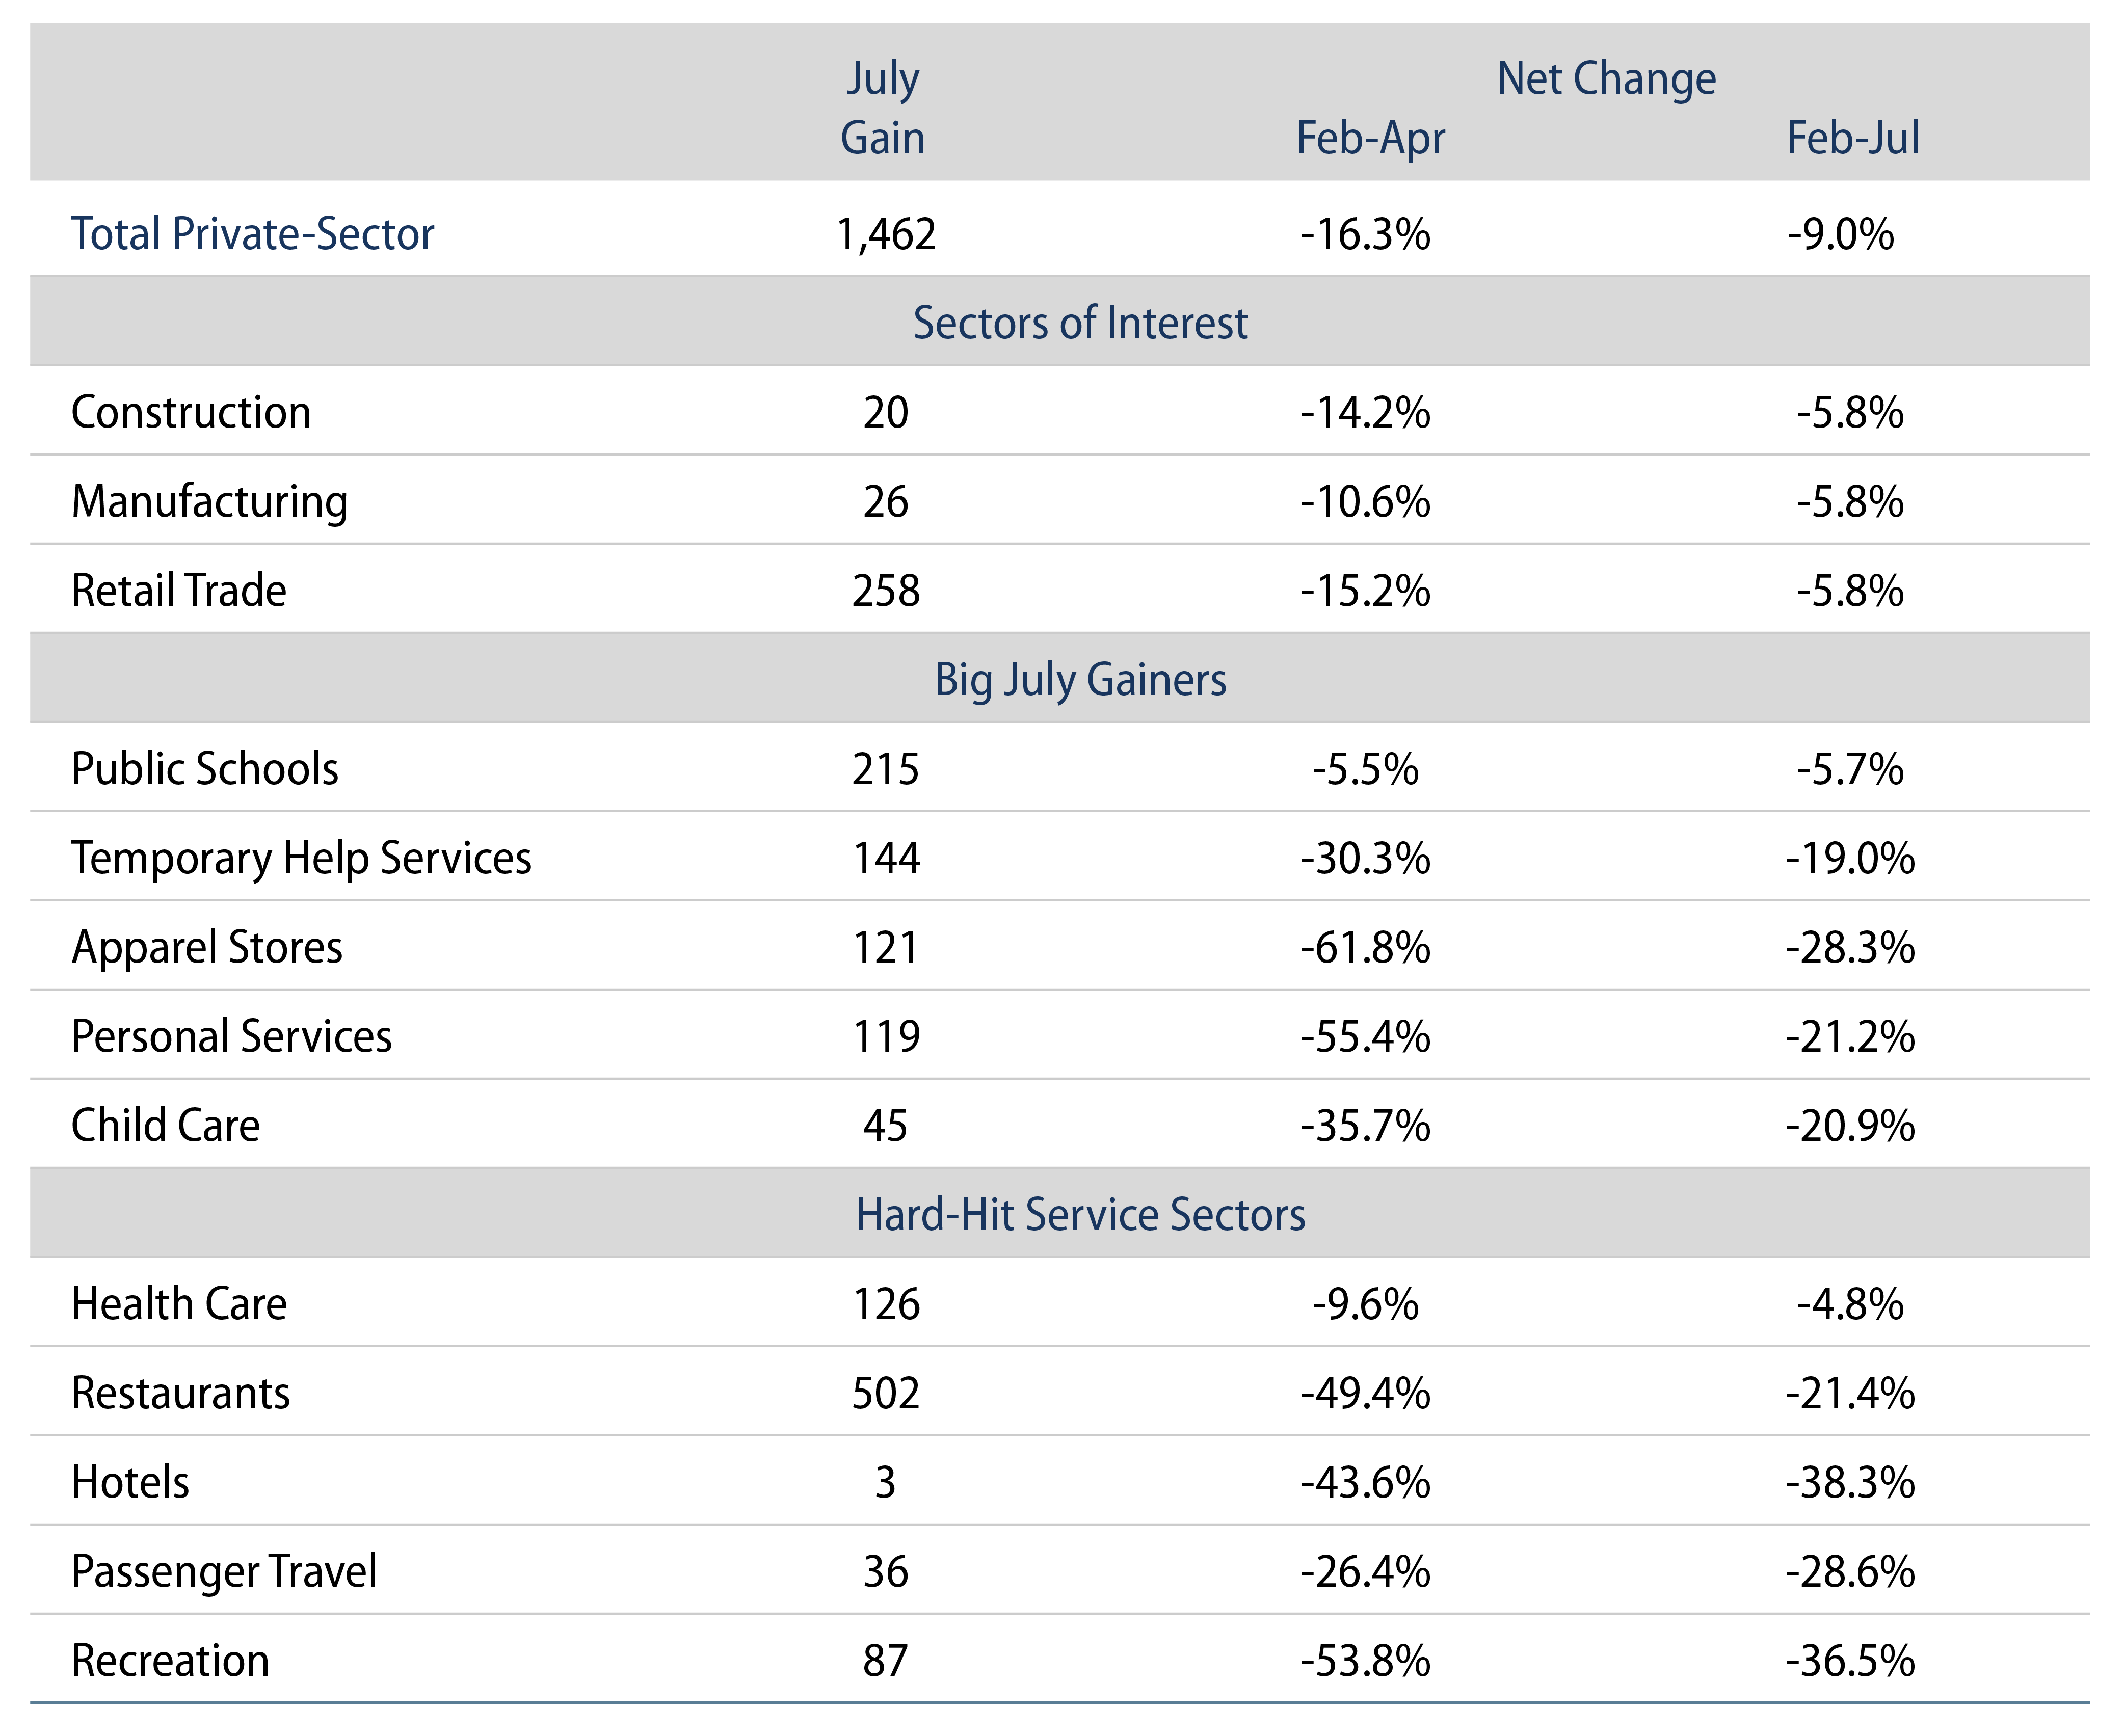
As you can see from the table, no sector is fully recovered from the shutdown. Construction and manufacturing have seen substantial rebounds, and, interestingly enough, so has retail trade. (The Paycheck Protection Program—PPP—is likely helping there.) Other sectors showing large job gains in July generally saw extremely sharp declines through April and, even with the July gains, remain substantially depressed. Still, they are recovering.

Among the hard-hit service sectors, health care and restaurants have shown nice rebounds, with health care nearly back to full strength and restaurants back more than one might have expected (PPP again?). However, not surprisingly, hotels, travel and recreation have barely bounced over the last three months. For these sectors, continued shutdown and fears of infection among potential customers are powerful forces holding them back.

These last few industries are unlikely to see a more substantial recovery until an effective vaccine emerges or else popular fears somehow dissipate. In the meantime, though, it is important to distinguish the rest of the economy from these “special case” sectors.

The economy on balance will still be depressed, thanks to continuing woes in the shutdown “epicenter” sectors. However, total employment and GDP can still achieve something resembling a V-shaped recovery just on the strength of those sectors where recovery is occurring. In other words, after GDP growth rates of -5.0% and -32.9% in 1Q and 2Q, a second-half performance of +25% and +5% in 3Q and 4Q would look strong, but would leave the economy in 4Q at 4% below year-ago levels. Those suggested second-half growth numbers look about right to us, and the 4% net decline in 4Q20 over 4Q19 looks to be consistent with the ongoing softness in the aforementioned service sectors.

© Western Asset Management Company, LLC 2024. The information contained in these materials ("the materials") is intended for the exclusive use of the designated recipient ("the recipient"). This information is proprietary and confidential and may contain commercially sensitive information, and may not be copied, reproduced or republished, in whole or in part, without the prior written consent of Western Asset Management Company ("Western Asset").
Past performance does not predict future returns. These materials should not be deemed to be a prediction or projection of future performance. These materials are intended for investment professionals including professional clients, eligible counterparties, and qualified investors only.
These materials have been produced for illustrative and informational purposes only. These materials contain Western Asset's opinions and beliefs as of the date designated on the materials; these views are subject to change and may not reflect real-time market developments and investment views.
Third party data may be used throughout the materials, and this data is believed to be accurate to the best of Western Asset's knowledge at the time of publication, but cannot be guaranteed. These materials may also contain strategy or product awards or rankings from independent third parties or industry publications which are based on unbiased quantitative and/or qualitative information determined independently by each third party or publication. In some cases, Western Asset may subscribe to these third party's standard industry services or publications. These standard subscriptions and services are available to all asset managers and do not influence rankings or awards in any way.
Investment strategies or products discussed herein may involve a high degree of risk, including the loss of some or all capital. Investments in any products or strategies described in these materials may be volatile, and investors should have the financial ability and willingness to accept such risks.
Unless otherwise noted, investment performance contained in these materials is reflective of a strategy composite. All other strategy data and information included in these materials reflects a representative portfolio which is an account in the composite that Western Asset believes most closely reflects the current portfolio management style of the strategy. Performance is not a consideration in the selection of the representative portfolio. The characteristics of the representative portfolio shown may differ from other accounts in the composite. Information regarding the representative portfolio and the other accounts in the composite are available upon request. Statements in these materials should not be considered investment advice. References, either general or specific, to securities and/or issuers in the materials are for illustrative purposes only and are not intended to be, and should not be interpreted as, recommendation to purchase or sell such securities. Employees and/or clients of Western Asset may have a position in the securities or issuers mentioned.
These materials are not intended to provide, and should not be relied on for, accounting, legal, tax, investment or other advice. The recipient should consult its own counsel, accountant, investment, tax, and any other advisers for this advice, including economic risks and merits, related to making an investment with Western Asset. The recipient is responsible for observing the applicable laws and regulations of their country of residence.
Founded in 1971, Western Asset Management Company is a global fixed-income investment manager with offices in Pasadena, New York, London, Singapore, Tokyo, Melbourne, São Paulo, Hong Kong, and Zürich. Western Asset is a wholly owned subsidiary of Franklin Resources, Inc. but operates autonomously. Western Asset is comprised of six legal entities across the globe, each with distinct regional registrations: Western Asset Management Company, LLC, a registered Investment Adviser with the Securities and Exchange Commission; Western Asset Management Company Distribuidora de Títulos e Valores Mobiliários Limitada is authorized and regulated by Comissão de Valores Mobiliários and Brazilian Central Bank; Western Asset Management Company Pty Ltd ABN 41 117 767 923 is the holder of the Australian Financial Services License 303160; Western Asset Management Company Pte. Ltd. Co. Reg. No. 200007692R is a holder of a Capital Markets Services License for fund management and regulated by the Monetary Authority of Singapore; Western Asset Management Company Ltd, a registered Financial Instruments Business Operator and regulated by the Financial Services Agency of Japan; and Western Asset Management Company Limited is authorised and regulated by the Financial Conduct Authority ("FCA") (FRN 145930). This communication is intended for distribution to Professional Clients only if deemed to be a financial promotion in the UK as defined by the FCA. This communication may also be intended for certain EEA countries where Western Asset has been granted permission to do so. For the current list of the approved EEA countries please contact Western Asset at +44 (0)20 7422 3000.