skip navigation
Blog

Stay up to date on timely topics and market events. Subscribe to our Blog now.

MARKETS
April 30, 2024

Weekly Municipal Monitor—Languishing Ladder Opportunities

By Sam Weitzman

Stay up to date on timely topics and market events. Subscribe to our Blog now.

Investment-Grade Municipals Posted Negative Returns Last Week

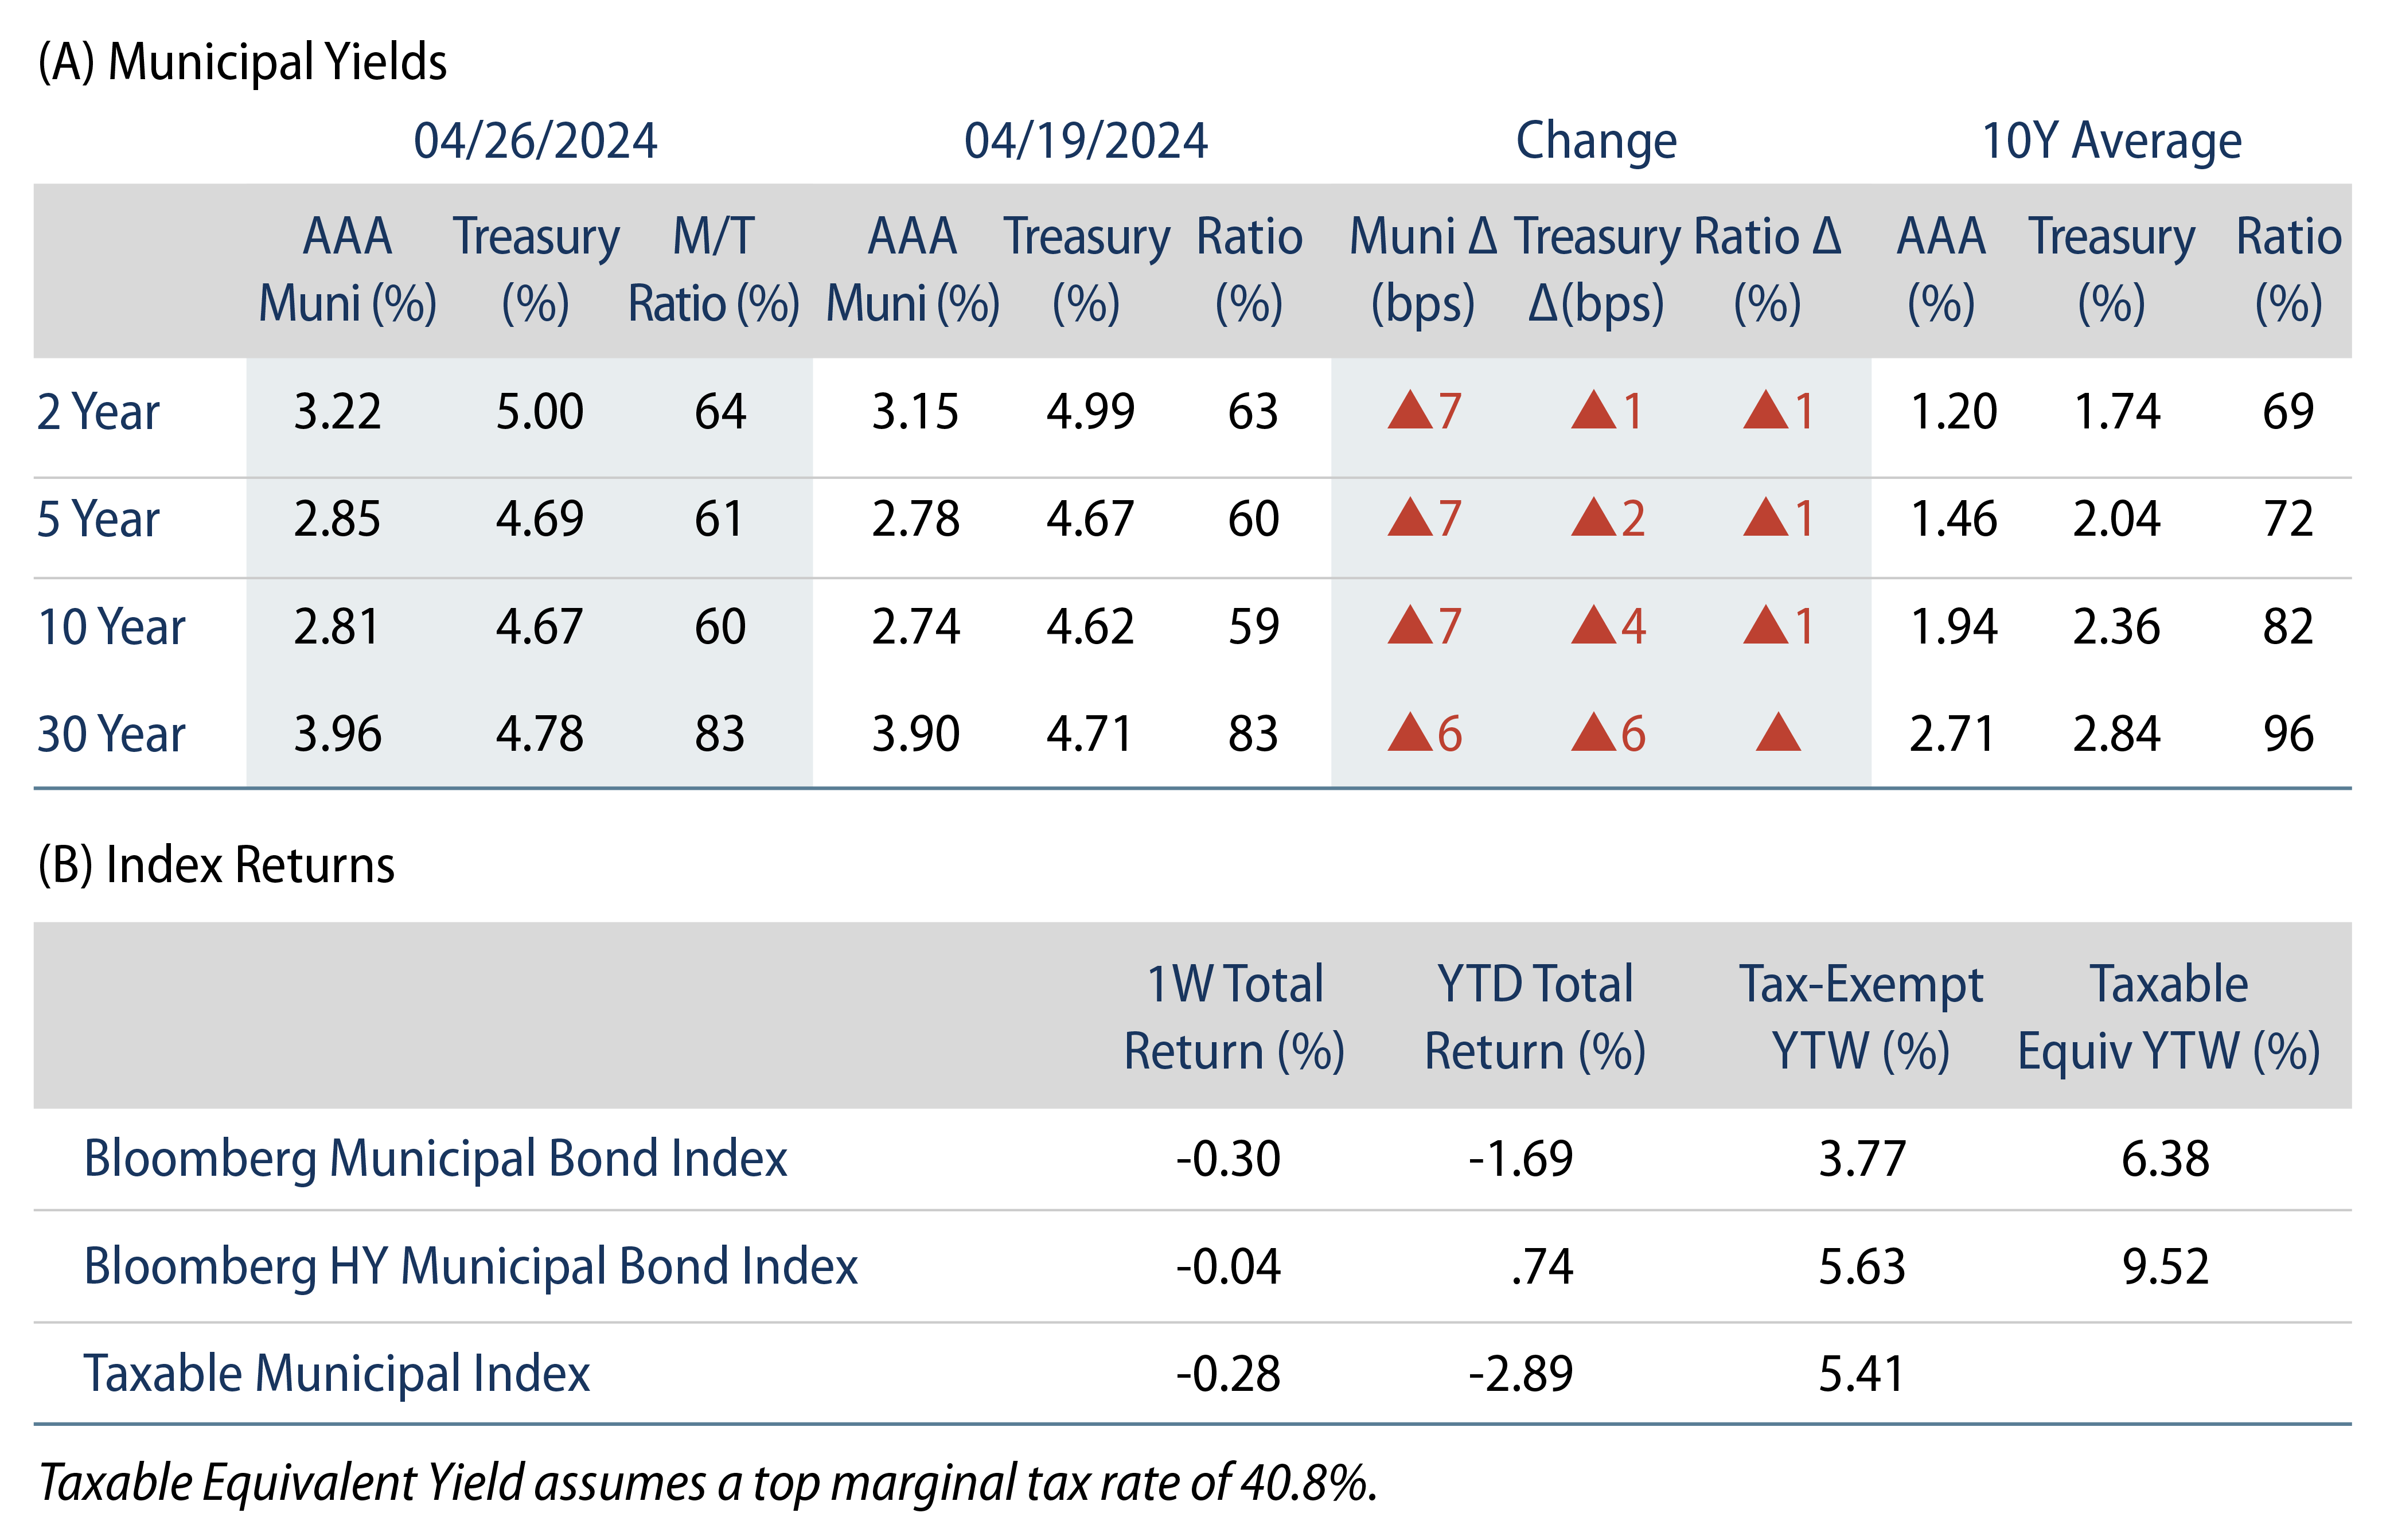
Investment-grade munis posted negative returns last week as high-grade muni yields moved higher across the curve. Muni technicals were challenged due to elevated supply levels. The weaker technical factors contributed to muni underperformance versus Treasuries, as yields moved higher on strong durable goods data, personal spending data and steady core inflation, as measured by the Personal Consumption Expenditures (PCE) price index. The Bloomberg Municipal Index returned -0.30% during the week, the High Yield Muni Index returned -0.04% and the Taxable Muni Index returned -0.28%. This week we highlight potential challenges faced by popular municipal ladder strategies.

Technicals Were Relatively Weak Amid a Heavy New-Issue Calendar

Fund Flows: During the week ending April 24, weekly reporting municipal mutual funds recorded $200 million of net inflows, according to Lipper. Long-term funds recorded $236 million of inflows, intermediate funds recorded $39 million of inflows and high-yield funds recorded $83 million of inflows. Short-term funds recorded $61 million of outflows. This week’s inflows lead estimated year-to-date (YTD) net inflows lower to $9.4 billion.

Supply: The muni market recorded $15 billion of new-issue volume last week, up 72% from the prior week. YTD issuance of $139 billion is 41% higher than last year’s level, with tax-exempt issuance 51% higher and taxable issuance 26% lower year-over-year. This week’s calendar is expected to fall to $6 billion. Largest deals include $1.9 billion Novant Health and $650 million NY/NJ Port Authority transactions.

This Week in Munis: Languishing Ladder Opportunities

For much of the past decade the municipal ladder separately managed account (SMA) solution served as a cost-effective vehicle to provide consistent income and a higher yield investment. A conventionally upward sloping yield curve also provided price support from the roll-down effect and consistent reinvestment at higher yields, underpinning the value proposition of ladder strategies. However, recent inflation-driven rate volatility has created new challenges for ladder mandates.

The increase in interest rates observed in 2022 and 2023 has driven greater demand for tax-loss harvesting within muni SMA mandates. Many ladder strategies, which typically involve buying and holding bonds to maturity, encountered new municipal liquidity concerns as investors sought to realize losses on securities not initially intended for sale. Tax loss harvesting can be a key advantage of SMA mandates; however, investors should be aware that returns could be further diminished by market liquidity challenges.

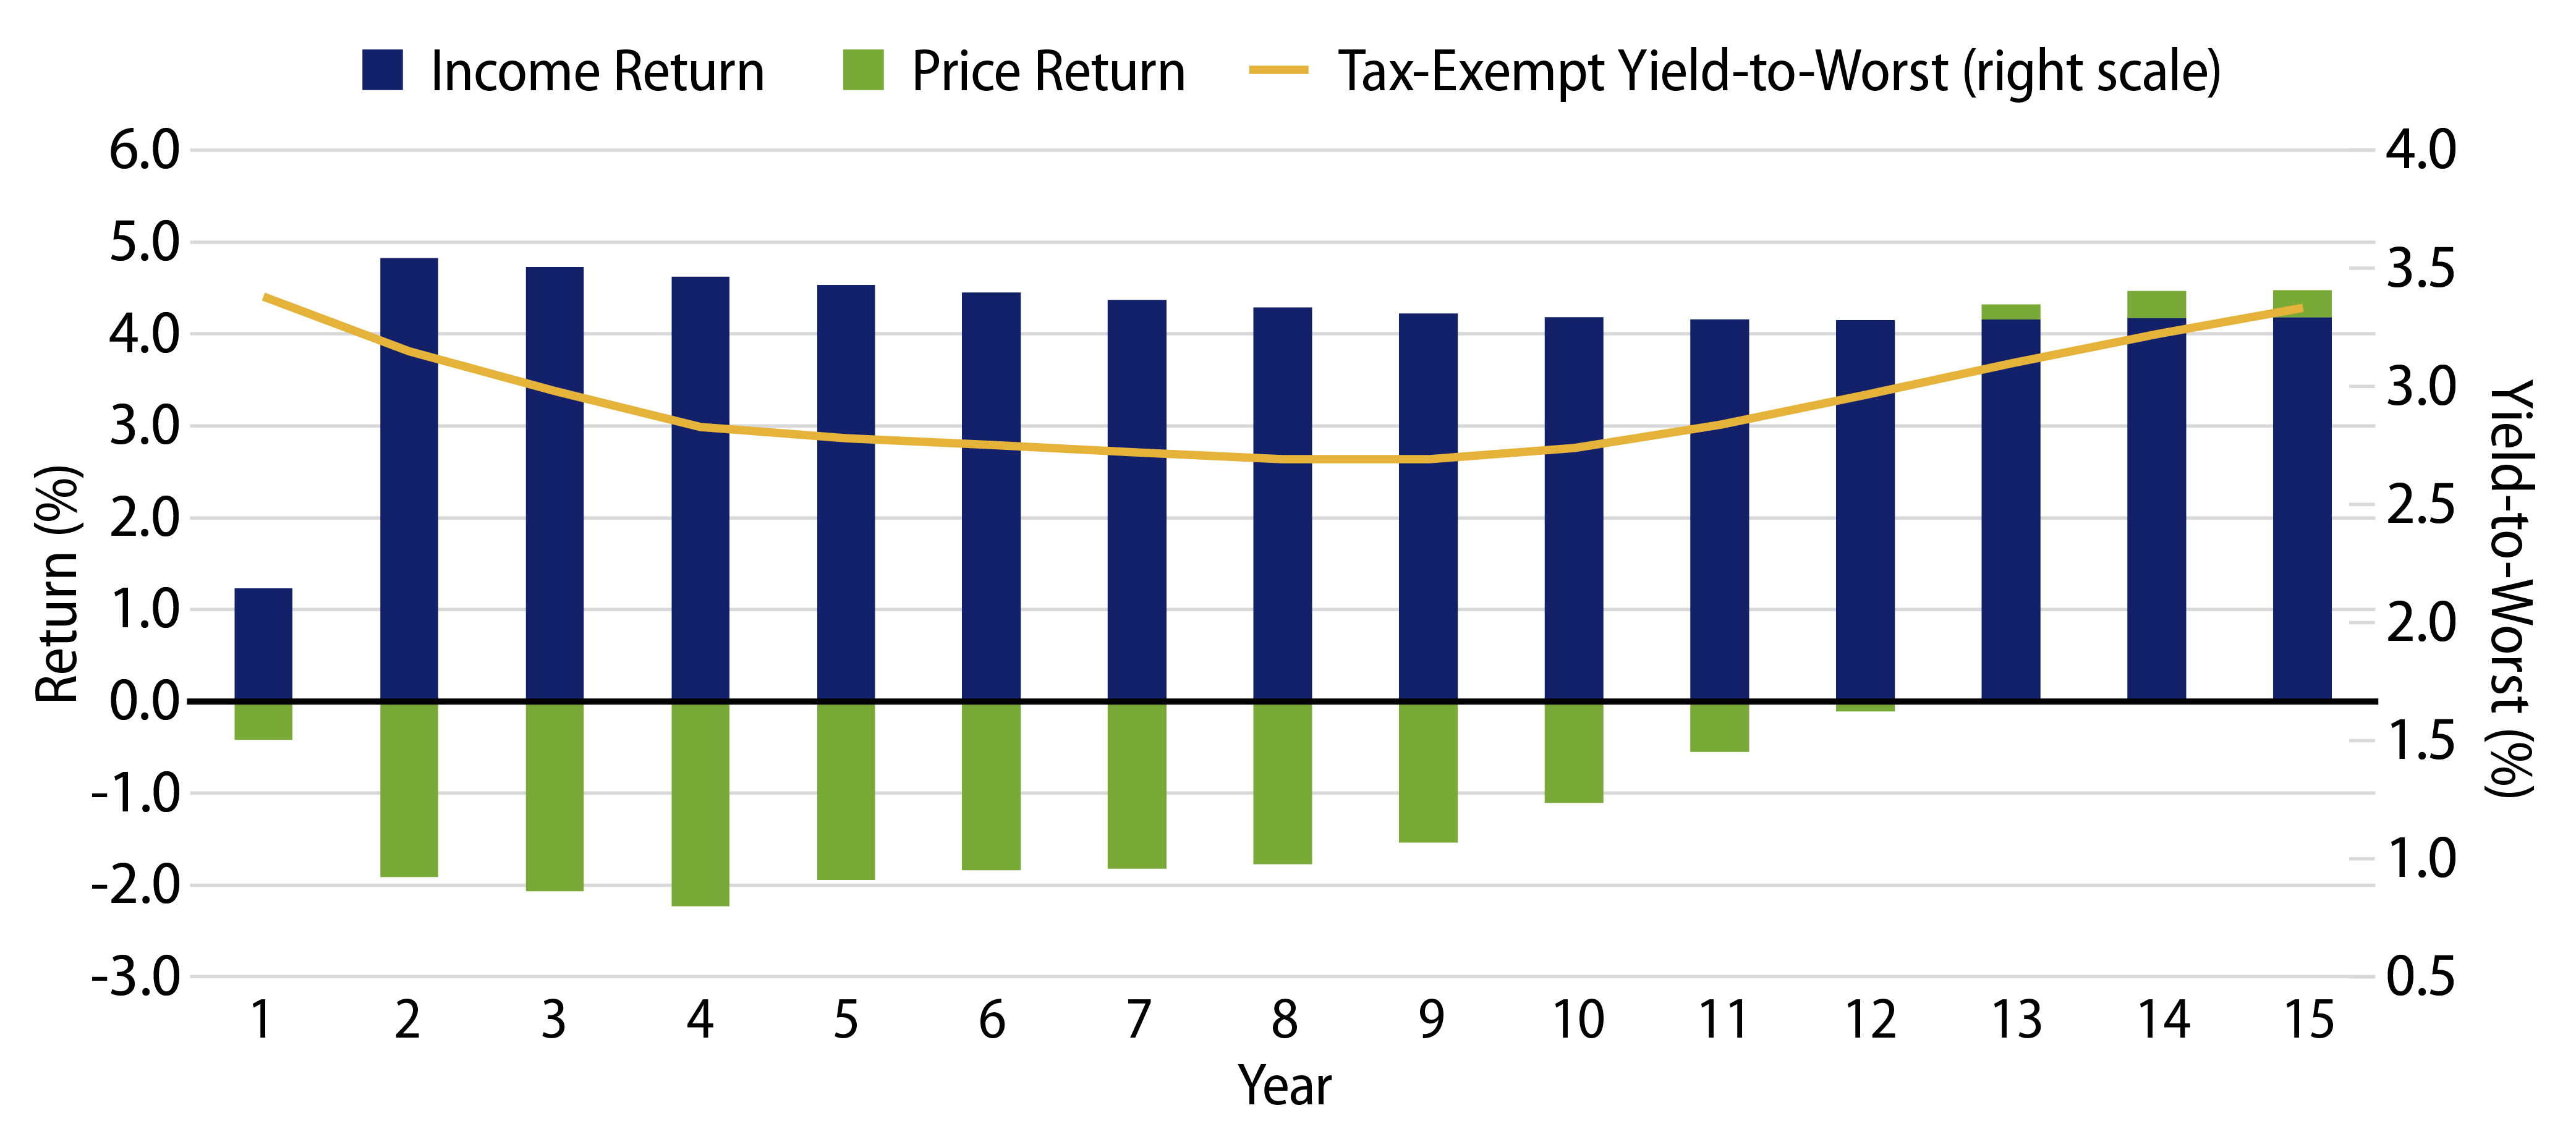
The significant inversion of the municipal yield curve has also limited the income and return potential of ladder structures, which seek to allocate a bond in every year. From an income perspective, the average yield to worst (YTW) of AAA securities within 5-9 years is 2.73%, nearly 50 basis points (bps) lower than the yields within 0-5 years. While a traditional upward sloping yield curve provides the benefit of carry plus the “roll-down” price advantage, the significant and persistent yield curve inversion has contributed to a “roll-up” price disadvantage. All else being equal, an investor who invests in a 4-year municipal bond may expect a -2.23% price return and a 2.39% total return.

Exhibit 1: AAA Muni Yield Curve vs. Estimated Price and Income Returns
AAA Muni Yield Curve vs. Estimated Price and Income Returns
Source: Western Asset, Thomson Reuters MMD. As of 17 Apr 24. Estimated return figures reflect AAA municipal yield curve returns, one year forward, if conditions are unchanged. Yield-to-worst (YTW) is the lowest potential yield that can be received on a bond without the issuer actually defaulting. Select the image to expand the view.

While muni investors have turned to ladders over the past decade to minimize costs in a low interest rate environment, Western Asset believes current market conditions underscore the benefit of active management, even within SMA portfolios. Certain market environments may favor a ladder-like allocation, and some investors may even prefer to forego the economic benefits of an active allocation for more predictable cash flows, but we believe those who maintain the flexibility to invest across the curve will be better positioned to capitalize on the risk-adjusted return opportunities that market conditions can present.

Municipal Credit Curves and Relative Value

Exhibit 2: Muni Credit Curves
Muni Credit Curves
Source: Bloomberg, Western Asset. As of 26 Apr 24. Bloomberg BVAL Municipal Credit Indices (AAA, AA, A, BBB, respectively) and US Sovereign Curves. Taxable-Equivalent Muni Credit Curves consider the top marginal effective tax rate of 40.8%. Select the image to expand the view.
Exhibit 3: Taxable-Equivalent Muni Credit Curves
Taxable-Equivalent Muni Credit Curves
Source: Bloomberg, Western Asset. As of 26 Apr 24. Bloomberg BVAL Municipal Credit Indices (AAA, AA, A, BBB, respectively) and US Sovereign Curves. Taxable-Equivalent Muni Credit Curves consider the top marginal effective tax rate of 40.8%. Select the image to expand the view.
Exhibit 4: AAA Munis versus Treasuries
AAA Munis versus Treasuries
Source: Muni Yields: Thomson Reuters MMD, Treasury Yields: Bloomberg. As of 26 Apr 24. Past performance is not a guarantee of future results. It is not possible to invest directly in an Index. Select the image to expand the view.
Exhibit 5: Tax-Exempt and Taxable Muni Valuations
Tax-Exempt and Taxable Muni Valuations
Source: Bloomberg. Yield-to-worst (YTW) is the lowest potential yield that can be received on a bond without the issuer actually defaulting. As of 26 Apr 24. Select the image to expand the view.

Western Asset Key Themes for Muni Investors

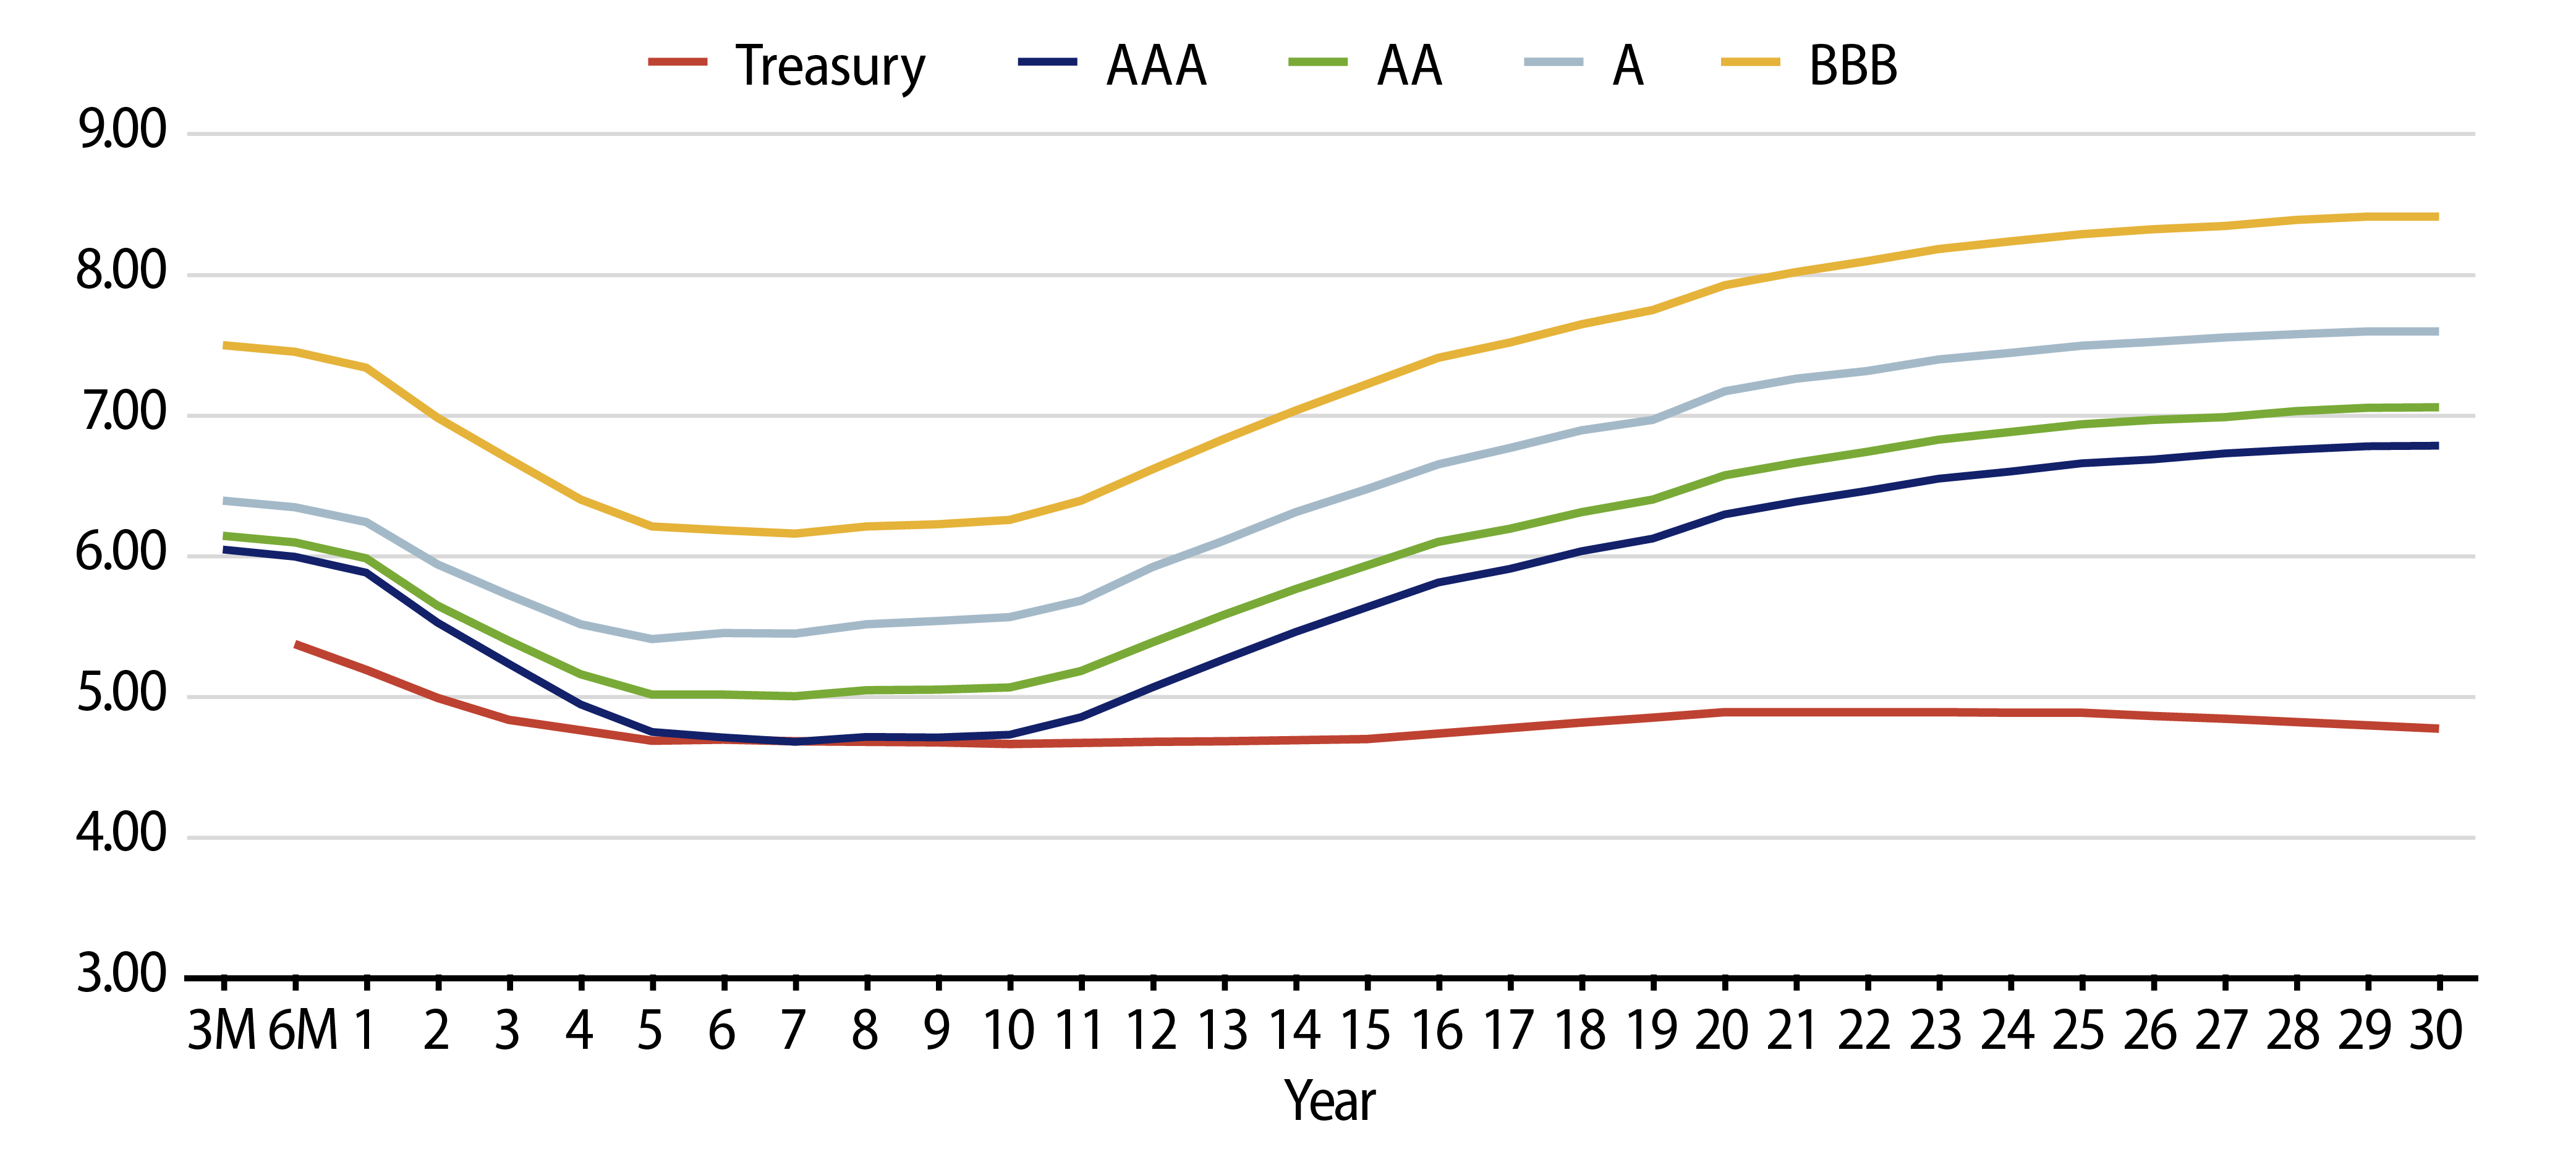
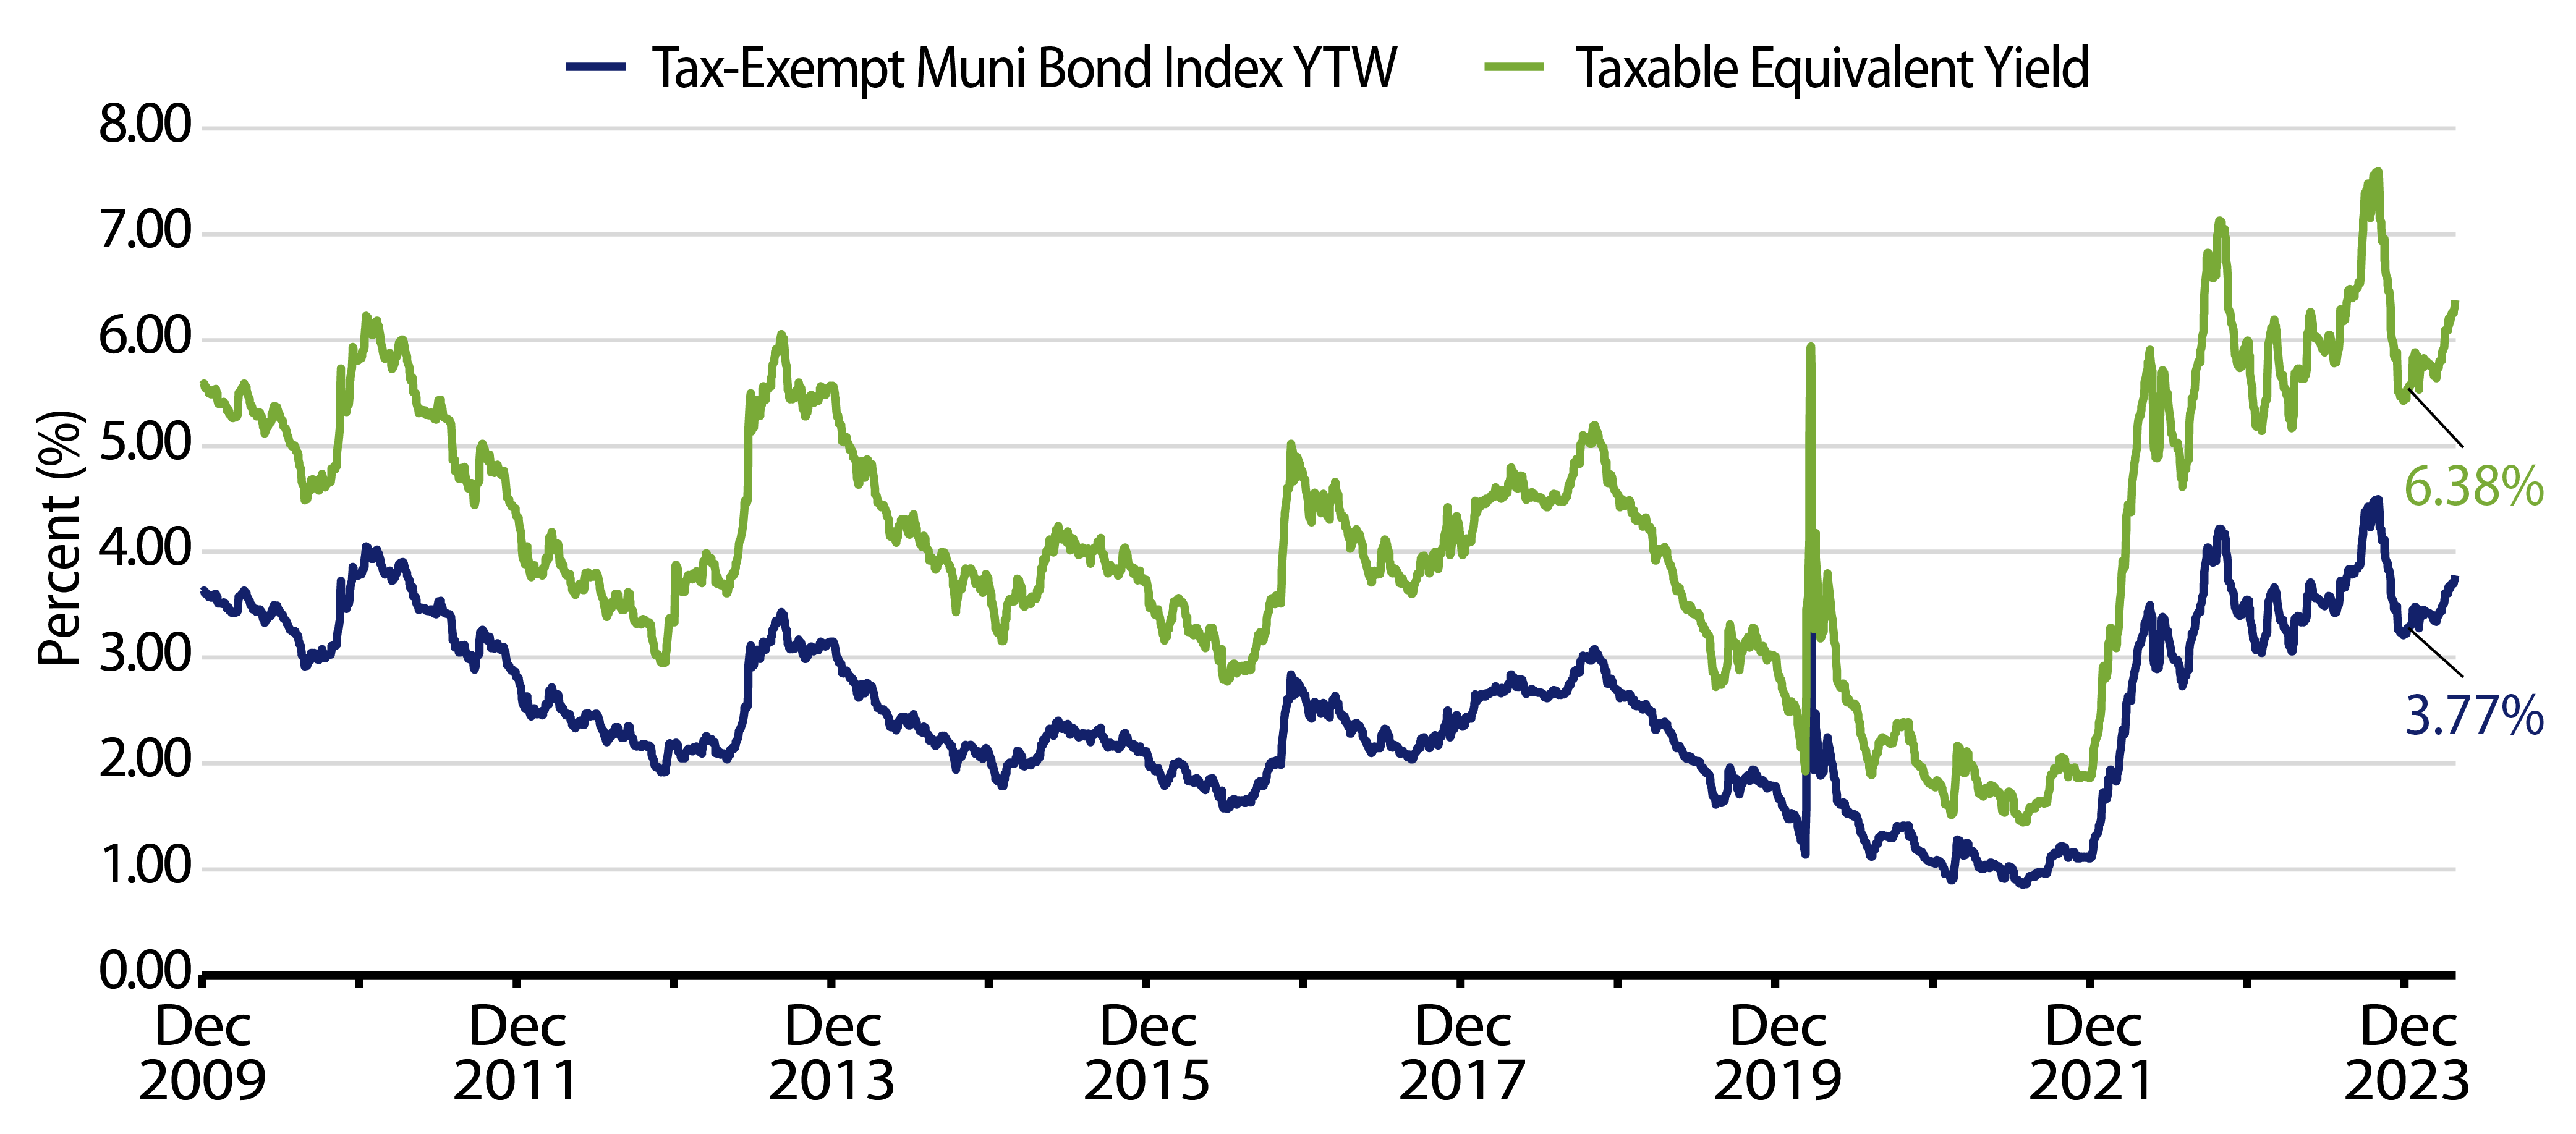
Theme #1: Municipal taxable-equivalent yields are above decade averages.

Exhibit 6: Muni and Taxable-Equivalent Muni Yield-to-Worst
Muni and Taxable-Equivalent Muni Yield-to-Worst
Source: Bloomberg, Western Asset. As of 26 Apr 24. Bloomberg Municipal Bond Index Yield Considering Highest Marginal Tax Rate of 40.8%. Indexes are unmanaged and one cannot directly invest in them. They do not include fees, expenses or sales charges. Past performance is not an indicator or a guarantee of future results. Select the image to expand the view.

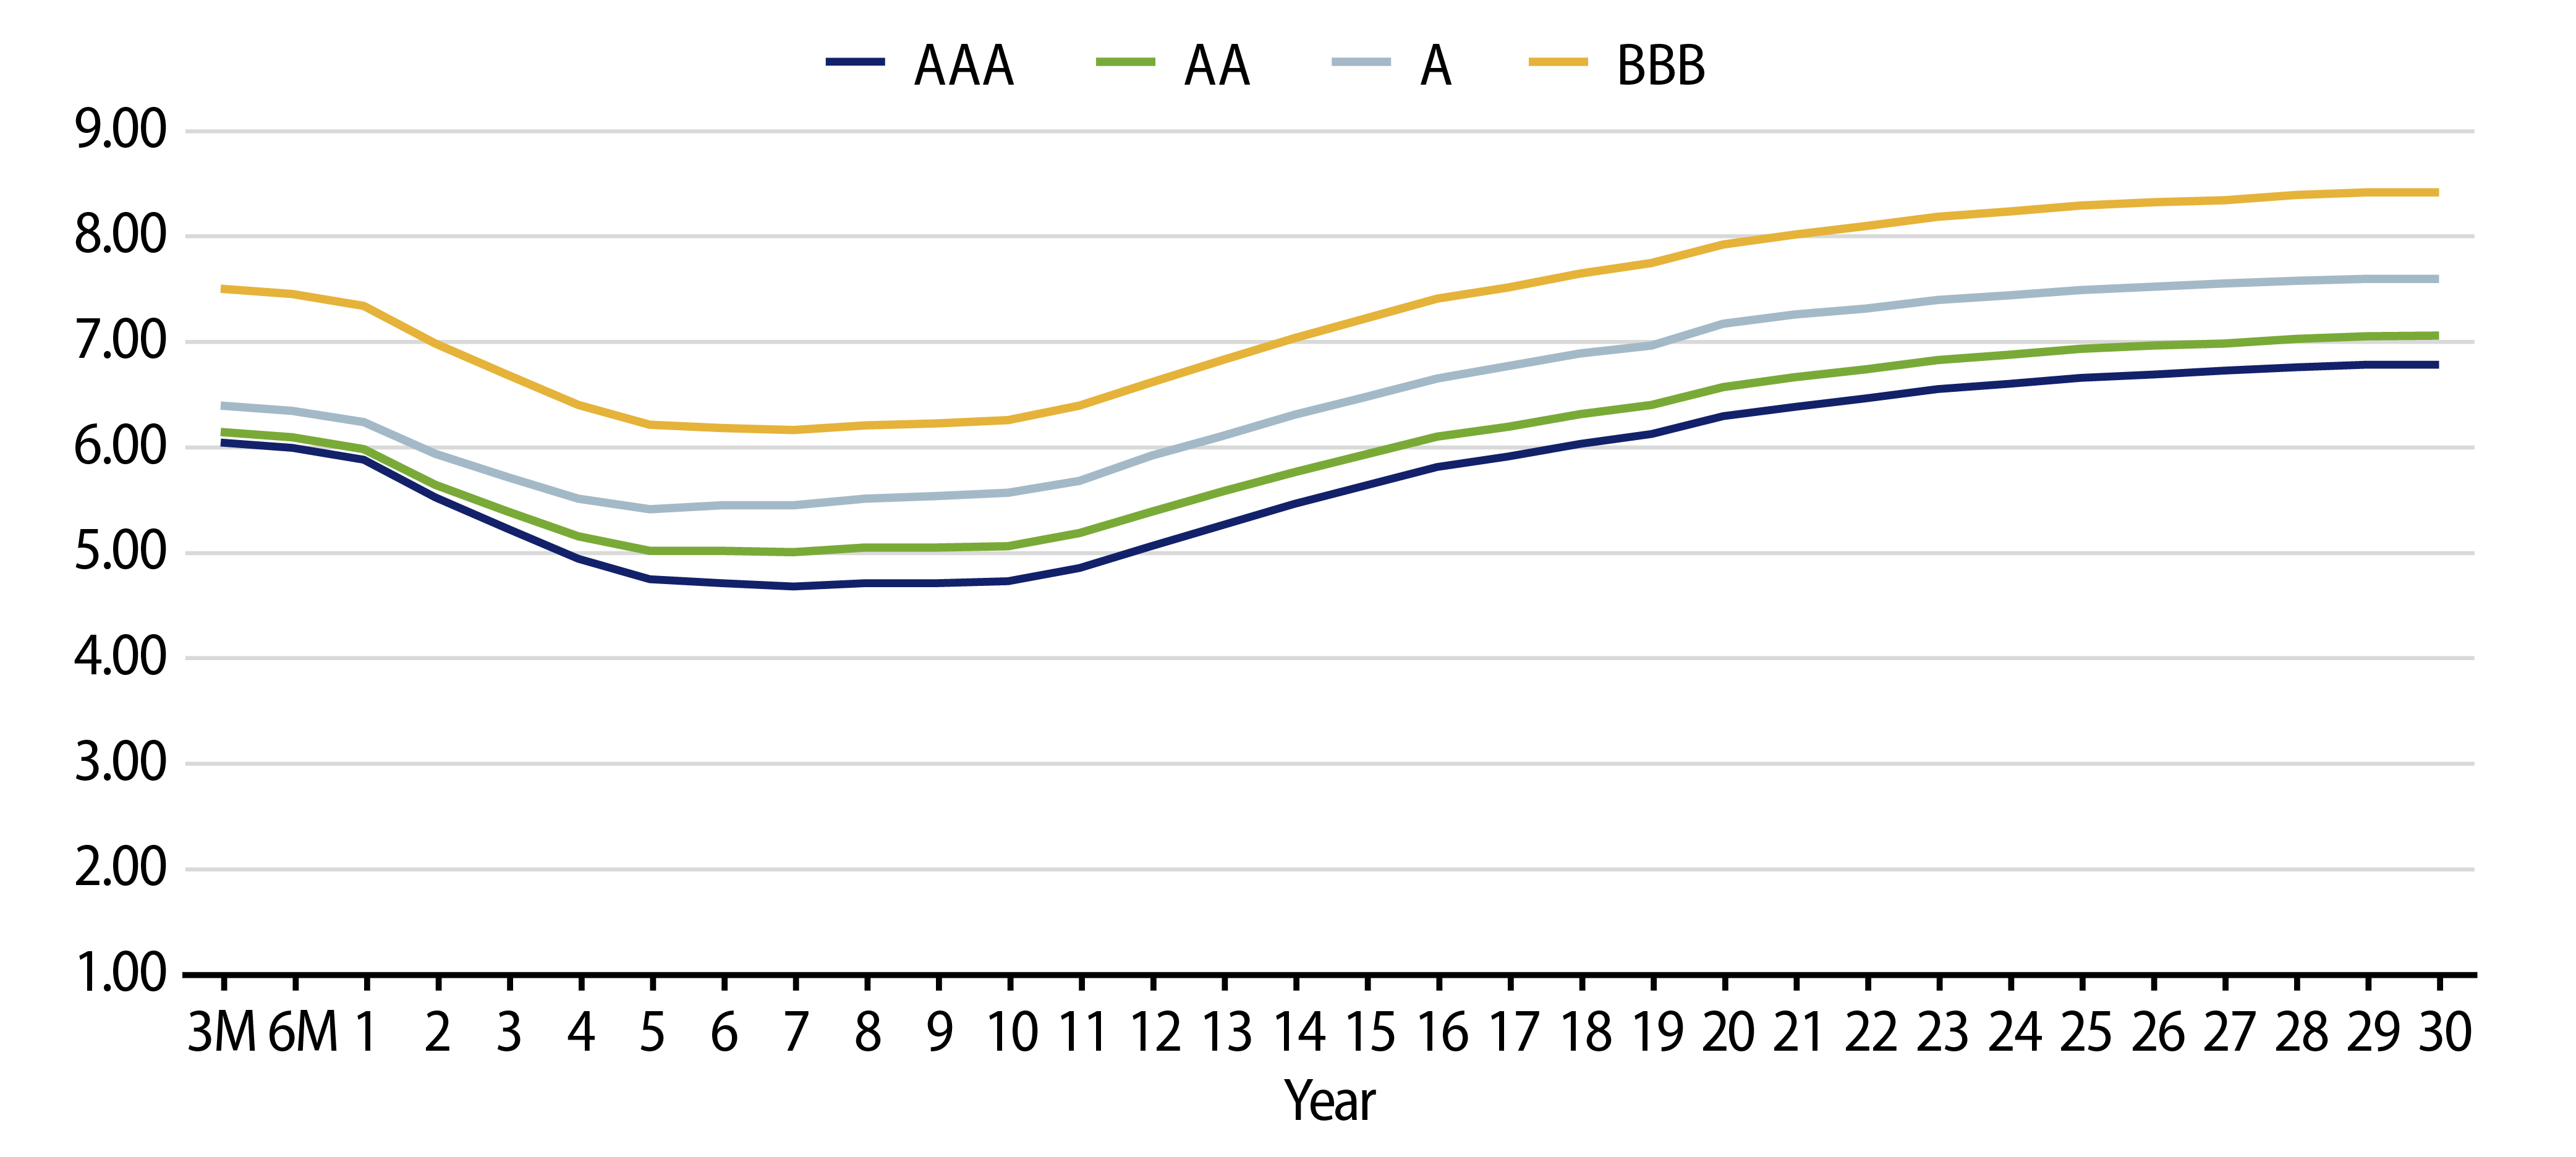
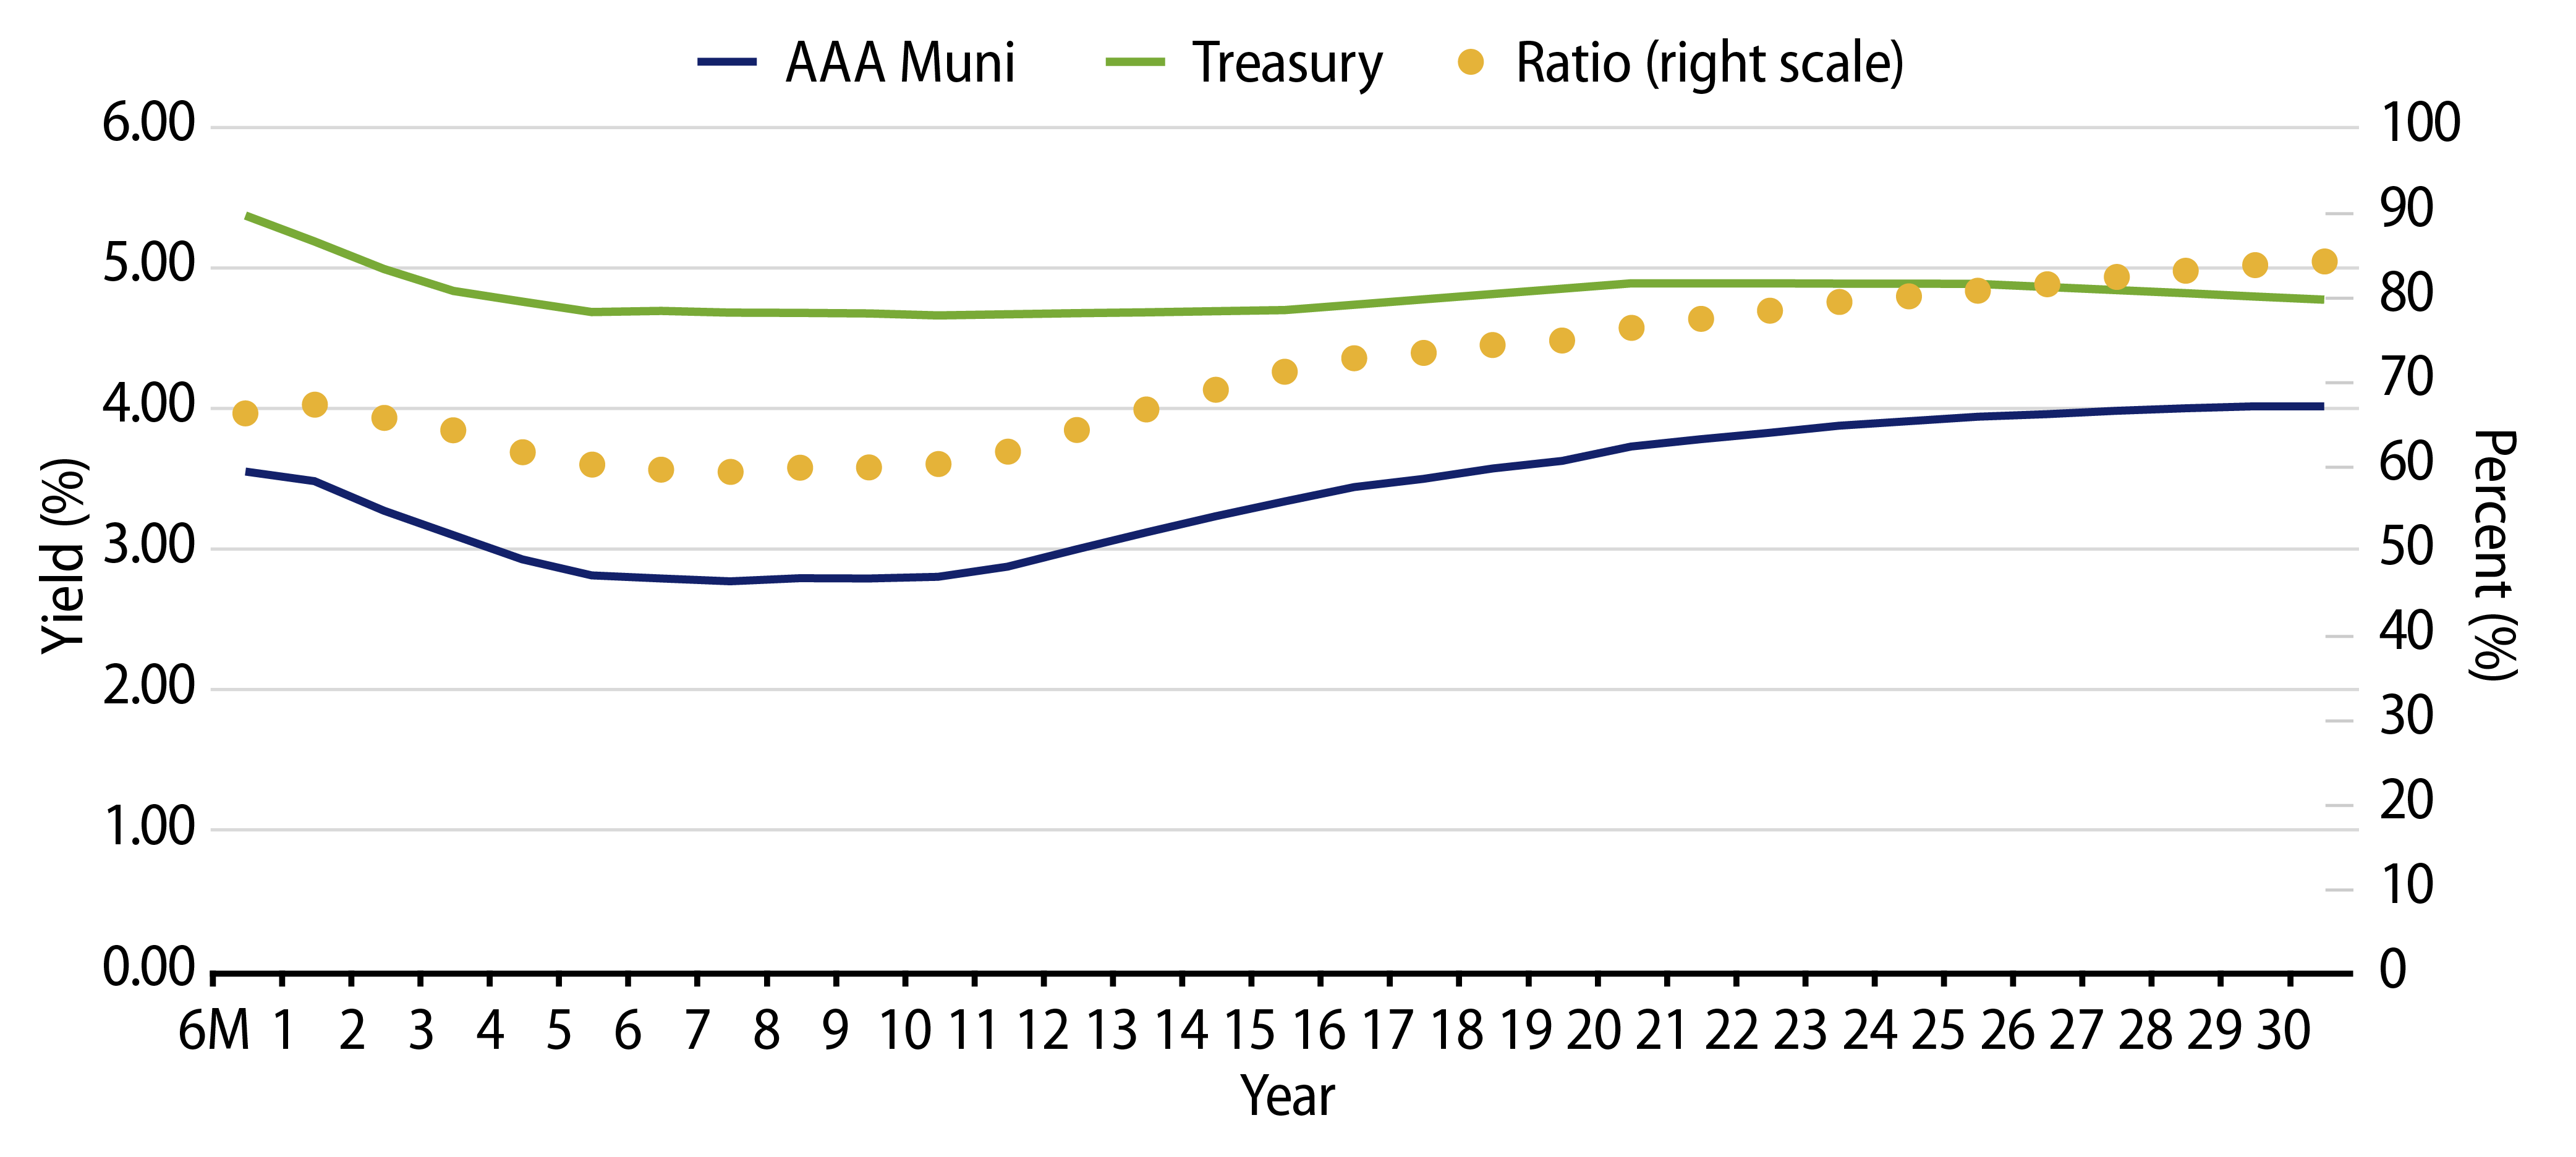
Theme #2: The inverted yield curve suggests less relative value in 5- and 10-year maturities.

Exhibit 7: AAA Municipal vs. Treasury Yield Curves
AAA Municipal vs. Treasury Yield Curves
Source: Bloomberg, Western Asset. As of 26 Apr 24 Bloomberg Valuation Service (BVAL) AAA Muni Curve and US On-/Off-the-Run Sovereign Curve. Indexes are unmanaged and one cannot directly invest in them. They do not include fees, expenses or sales charges. Past performance is not an indicator or a guarantee of future results. Select the image to expand the view.

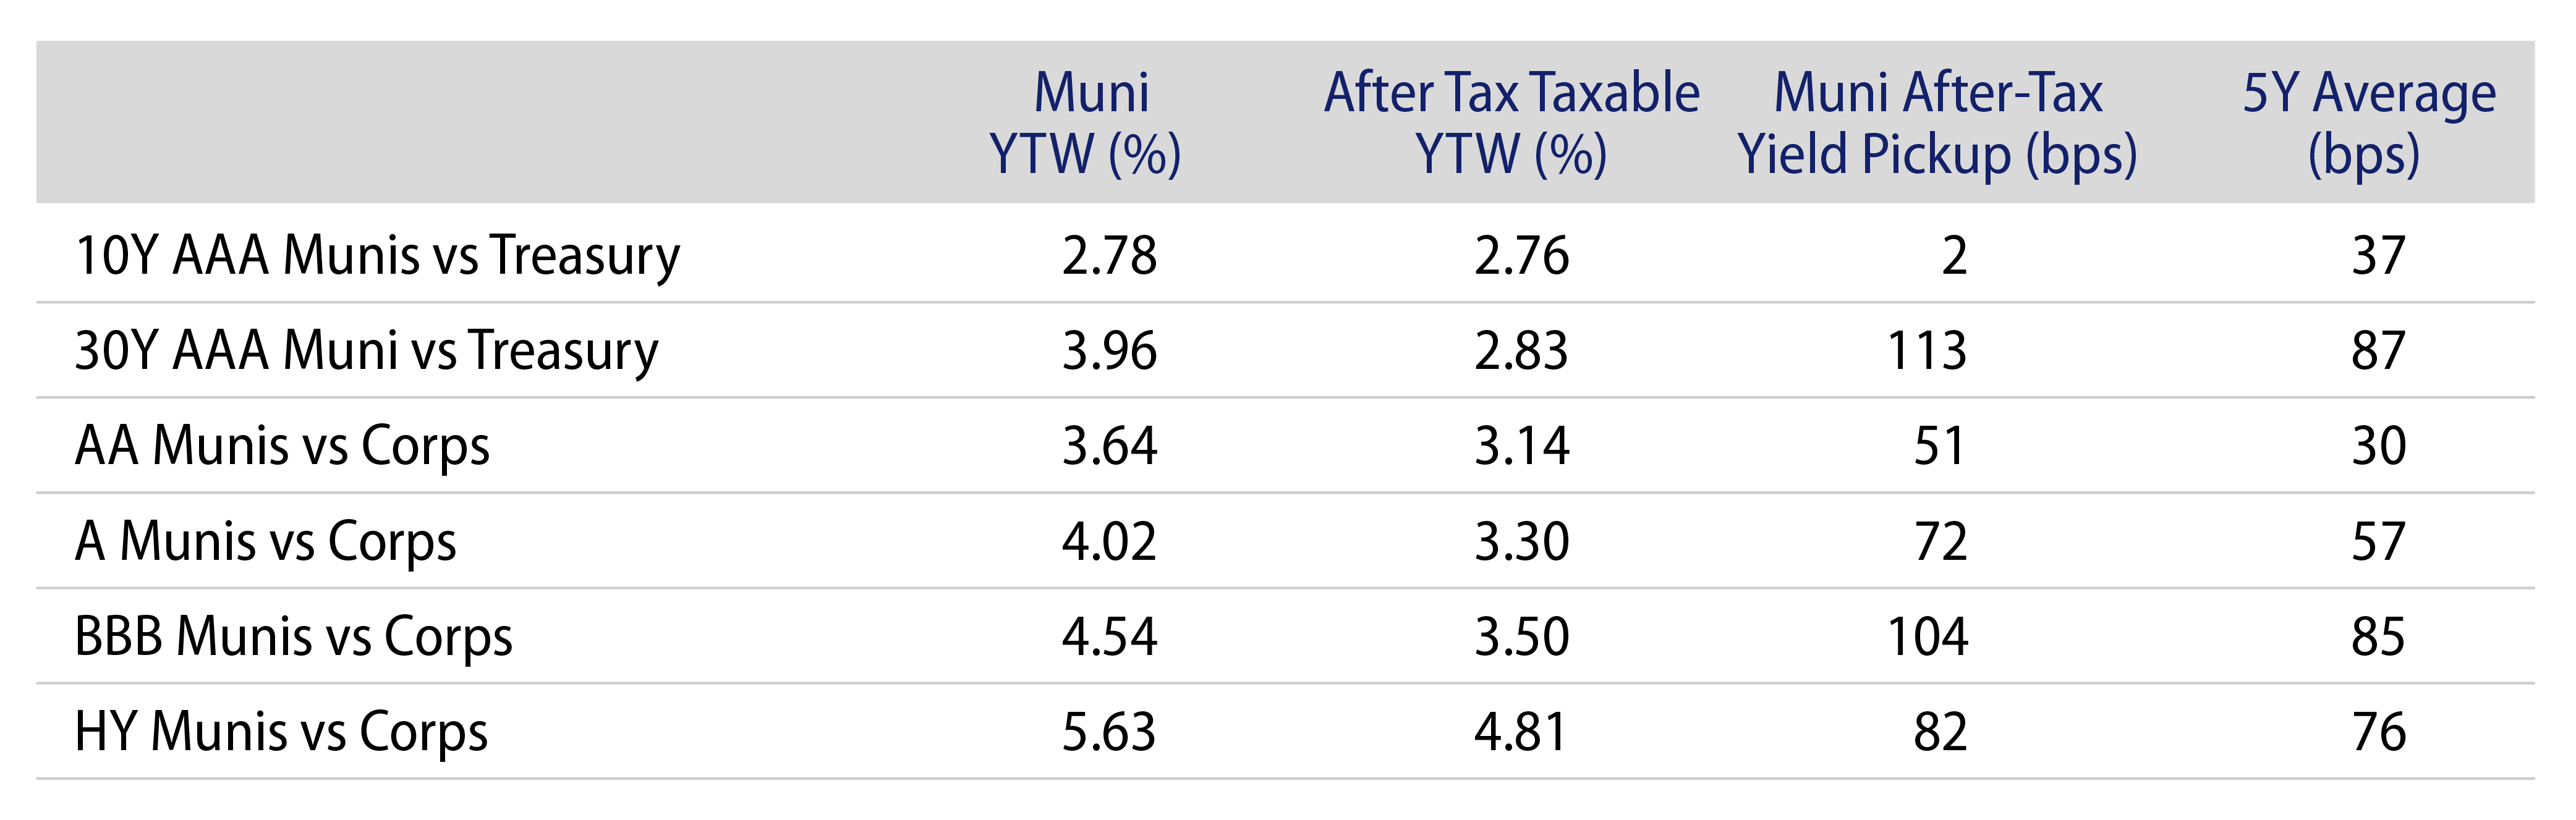
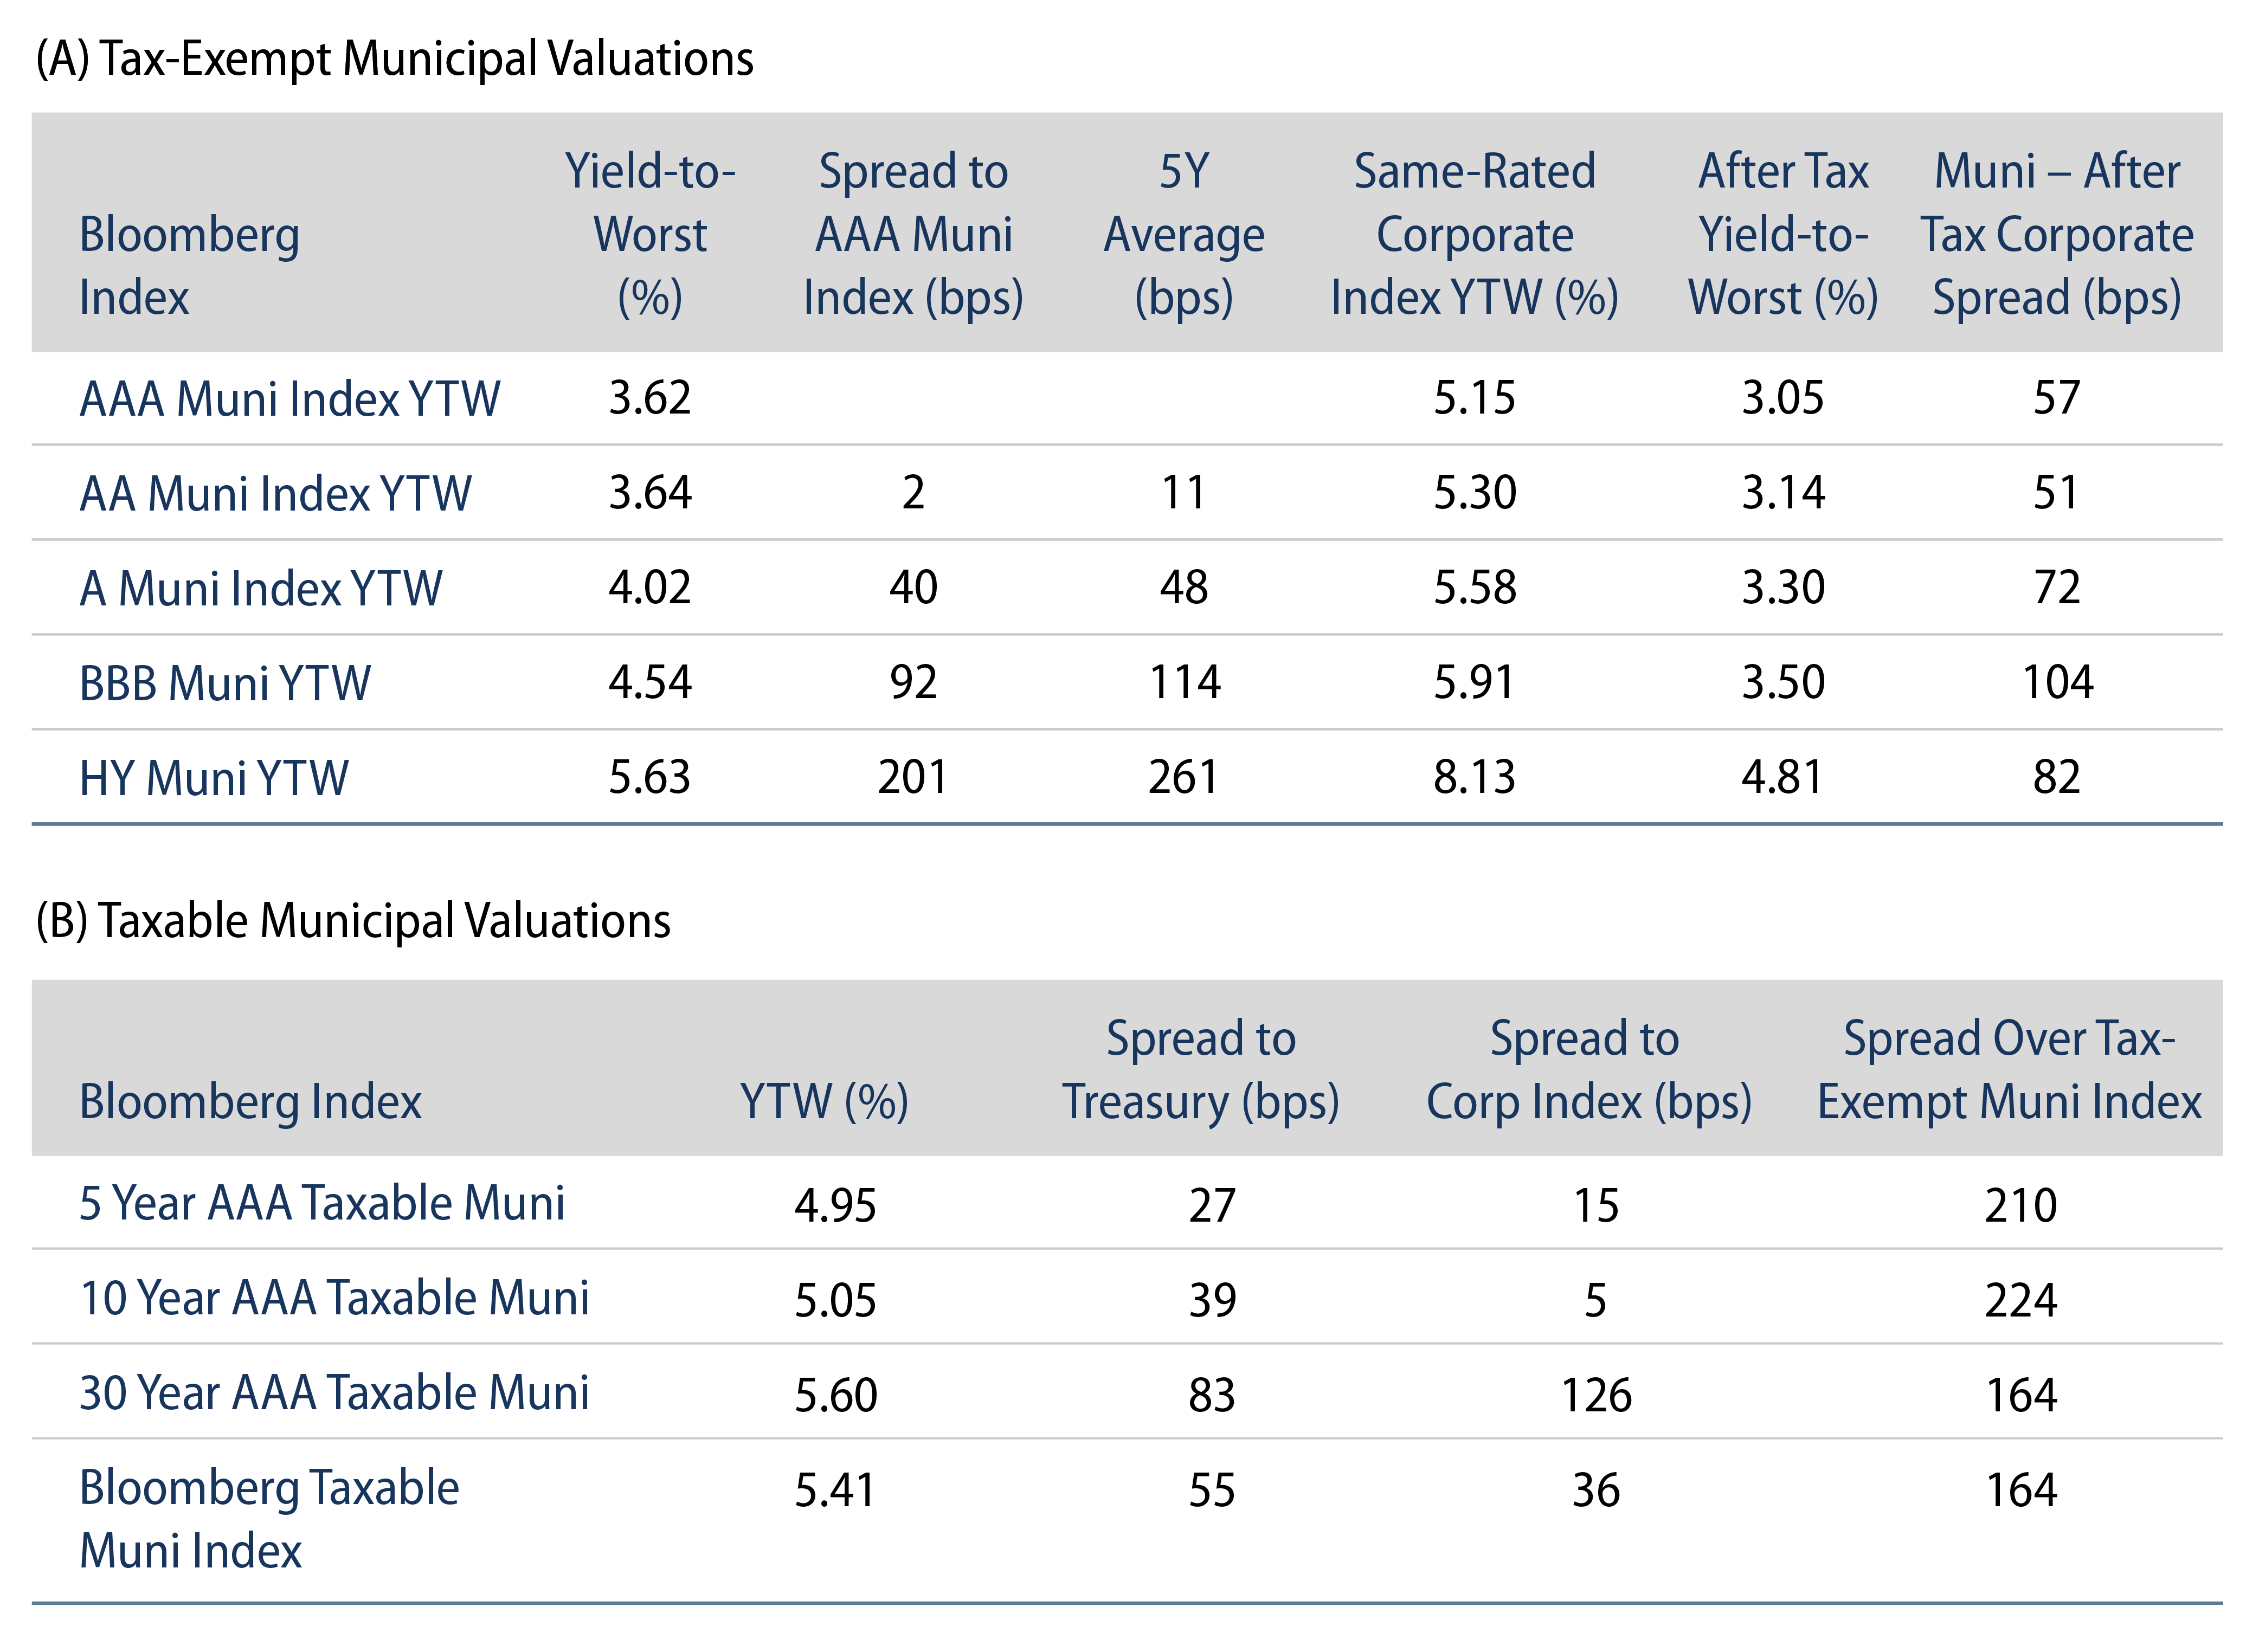
Theme #3: Munis offer attractive after-tax yield pickup versus long Treasuries and corporate credit.

Exhibit 8: Municipal vs. Taxable Fixed-Income Yields by Quality
Municipal vs. Taxable Fixed-Income Yields by Quality
Source: Western Asset, Bloomberg. As 26 Apr 24. 10- and 30-Year comparison reflects Bloomberg Valuation Service (BVAL) AAA Muni Curve and US On-/Off-the-Run Sovereign Curve. AA Muni reflects the Bloomberg AA Muni Bond Index. A Muni reflects the Bloomberg A Muni Bond Index. BBB Muni reflects the Bloomberg BBB Muni Bond Index. HY Muni reflects the Bloomberg High Yield Muni Bond Index. AA Corp reflects the Bloomberg AA Corporate Bond Index. A Corp reflects the Bloomberg A Corporate Bond Index. BBB Corp reflects the Bloomberg BBB Corporate Bond Index. After-tax yield considers top marginal tax rate of 40.8%. Indexes are unmanaged and one cannot directly invest in them. They do not include fees, expenses or sales charges. Past performance is not an indicator or a guarantee of future results. Select the image to expand the view.

© Western Asset Management Company, LLC 2024. The information contained in these materials ("the materials") is intended for the exclusive use of the designated recipient ("the recipient"). This information is proprietary and confidential and may contain commercially sensitive information, and may not be copied, reproduced or republished, in whole or in part, without the prior written consent of Western Asset Management Company ("Western Asset").
Past performance does not predict future returns. These materials should not be deemed to be a prediction or projection of future performance. These materials are intended for investment professionals including professional clients, eligible counterparties, and qualified investors only.
These materials have been produced for illustrative and informational purposes only. These materials contain Western Asset's opinions and beliefs as of the date designated on the materials; these views are subject to change and may not reflect real-time market developments and investment views.
Third party data may be used throughout the materials, and this data is believed to be accurate to the best of Western Asset's knowledge at the time of publication, but cannot be guaranteed. These materials may also contain strategy or product awards or rankings from independent third parties or industry publications which are based on unbiased quantitative and/or qualitative information determined independently by each third party or publication. In some cases, Western Asset may subscribe to these third party's standard industry services or publications. These standard subscriptions and services are available to all asset managers and do not influence rankings or awards in any way.
Investment strategies or products discussed herein may involve a high degree of risk, including the loss of some or all capital. Investments in any products or strategies described in these materials may be volatile, and investors should have the financial ability and willingness to accept such risks.
Unless otherwise noted, investment performance contained in these materials is reflective of a strategy composite. All other strategy data and information included in these materials reflects a representative portfolio which is an account in the composite that Western Asset believes most closely reflects the current portfolio management style of the strategy. Performance is not a consideration in the selection of the representative portfolio. The characteristics of the representative portfolio shown may differ from other accounts in the composite. Information regarding the representative portfolio and the other accounts in the composite are available upon request. Statements in these materials should not be considered investment advice. References, either general or specific, to securities and/or issuers in the materials are for illustrative purposes only and are not intended to be, and should not be interpreted as, recommendation to purchase or sell such securities. Employees and/or clients of Western Asset may have a position in the securities or issuers mentioned.
These materials are not intended to provide, and should not be relied on for, accounting, legal, tax, investment or other advice. The recipient should consult its own counsel, accountant, investment, tax, and any other advisers for this advice, including economic risks and merits, related to making an investment with Western Asset. The recipient is responsible for observing the applicable laws and regulations of their country of residence.
Founded in 1971, Western Asset Management Company is a global fixed-income investment manager with offices in Pasadena, New York, London, Singapore, Tokyo, Melbourne, São Paulo, Hong Kong, and Zürich. Western Asset is a wholly owned subsidiary of Franklin Resources, Inc. but operates autonomously. Western Asset is comprised of six legal entities across the globe, each with distinct regional registrations: Western Asset Management Company, LLC, a registered Investment Adviser with the Securities and Exchange Commission; Western Asset Management Company Distribuidora de Títulos e Valores Mobiliários Limitada is authorized and regulated by Comissão de Valores Mobiliários and Brazilian Central Bank; Western Asset Management Company Pty Ltd ABN 41 117 767 923 is the holder of the Australian Financial Services License 303160; Western Asset Management Company Pte. Ltd. Co. Reg. No. 200007692R is a holder of a Capital Markets Services License for fund management and regulated by the Monetary Authority of Singapore; Western Asset Management Company Ltd, a registered Financial Instruments Business Operator and regulated by the Financial Services Agency of Japan; and Western Asset Management Company Limited is authorised and regulated by the Financial Conduct Authority ("FCA") (FRN 145930). This communication is intended for distribution to Professional Clients only if deemed to be a financial promotion in the UK as defined by the FCA. This communication may also be intended for certain EEA countries where Western Asset has been granted permission to do so. For the current list of the approved EEA countries please contact Western Asset at +44 (0)20 7422 3000.