skip navigation
Blog

Stay up to date on timely topics and market events. Subscribe to our Blog now.

MARKETS
28 September 2021

Weekly Municipal Monitor—Checking in on Stimulus Spending

By Thea Okin, Judy Ewald

Stay up to date on timely topics and market events. Subscribe to our Blog now.

Municipals Posted Negative Returns During the Week

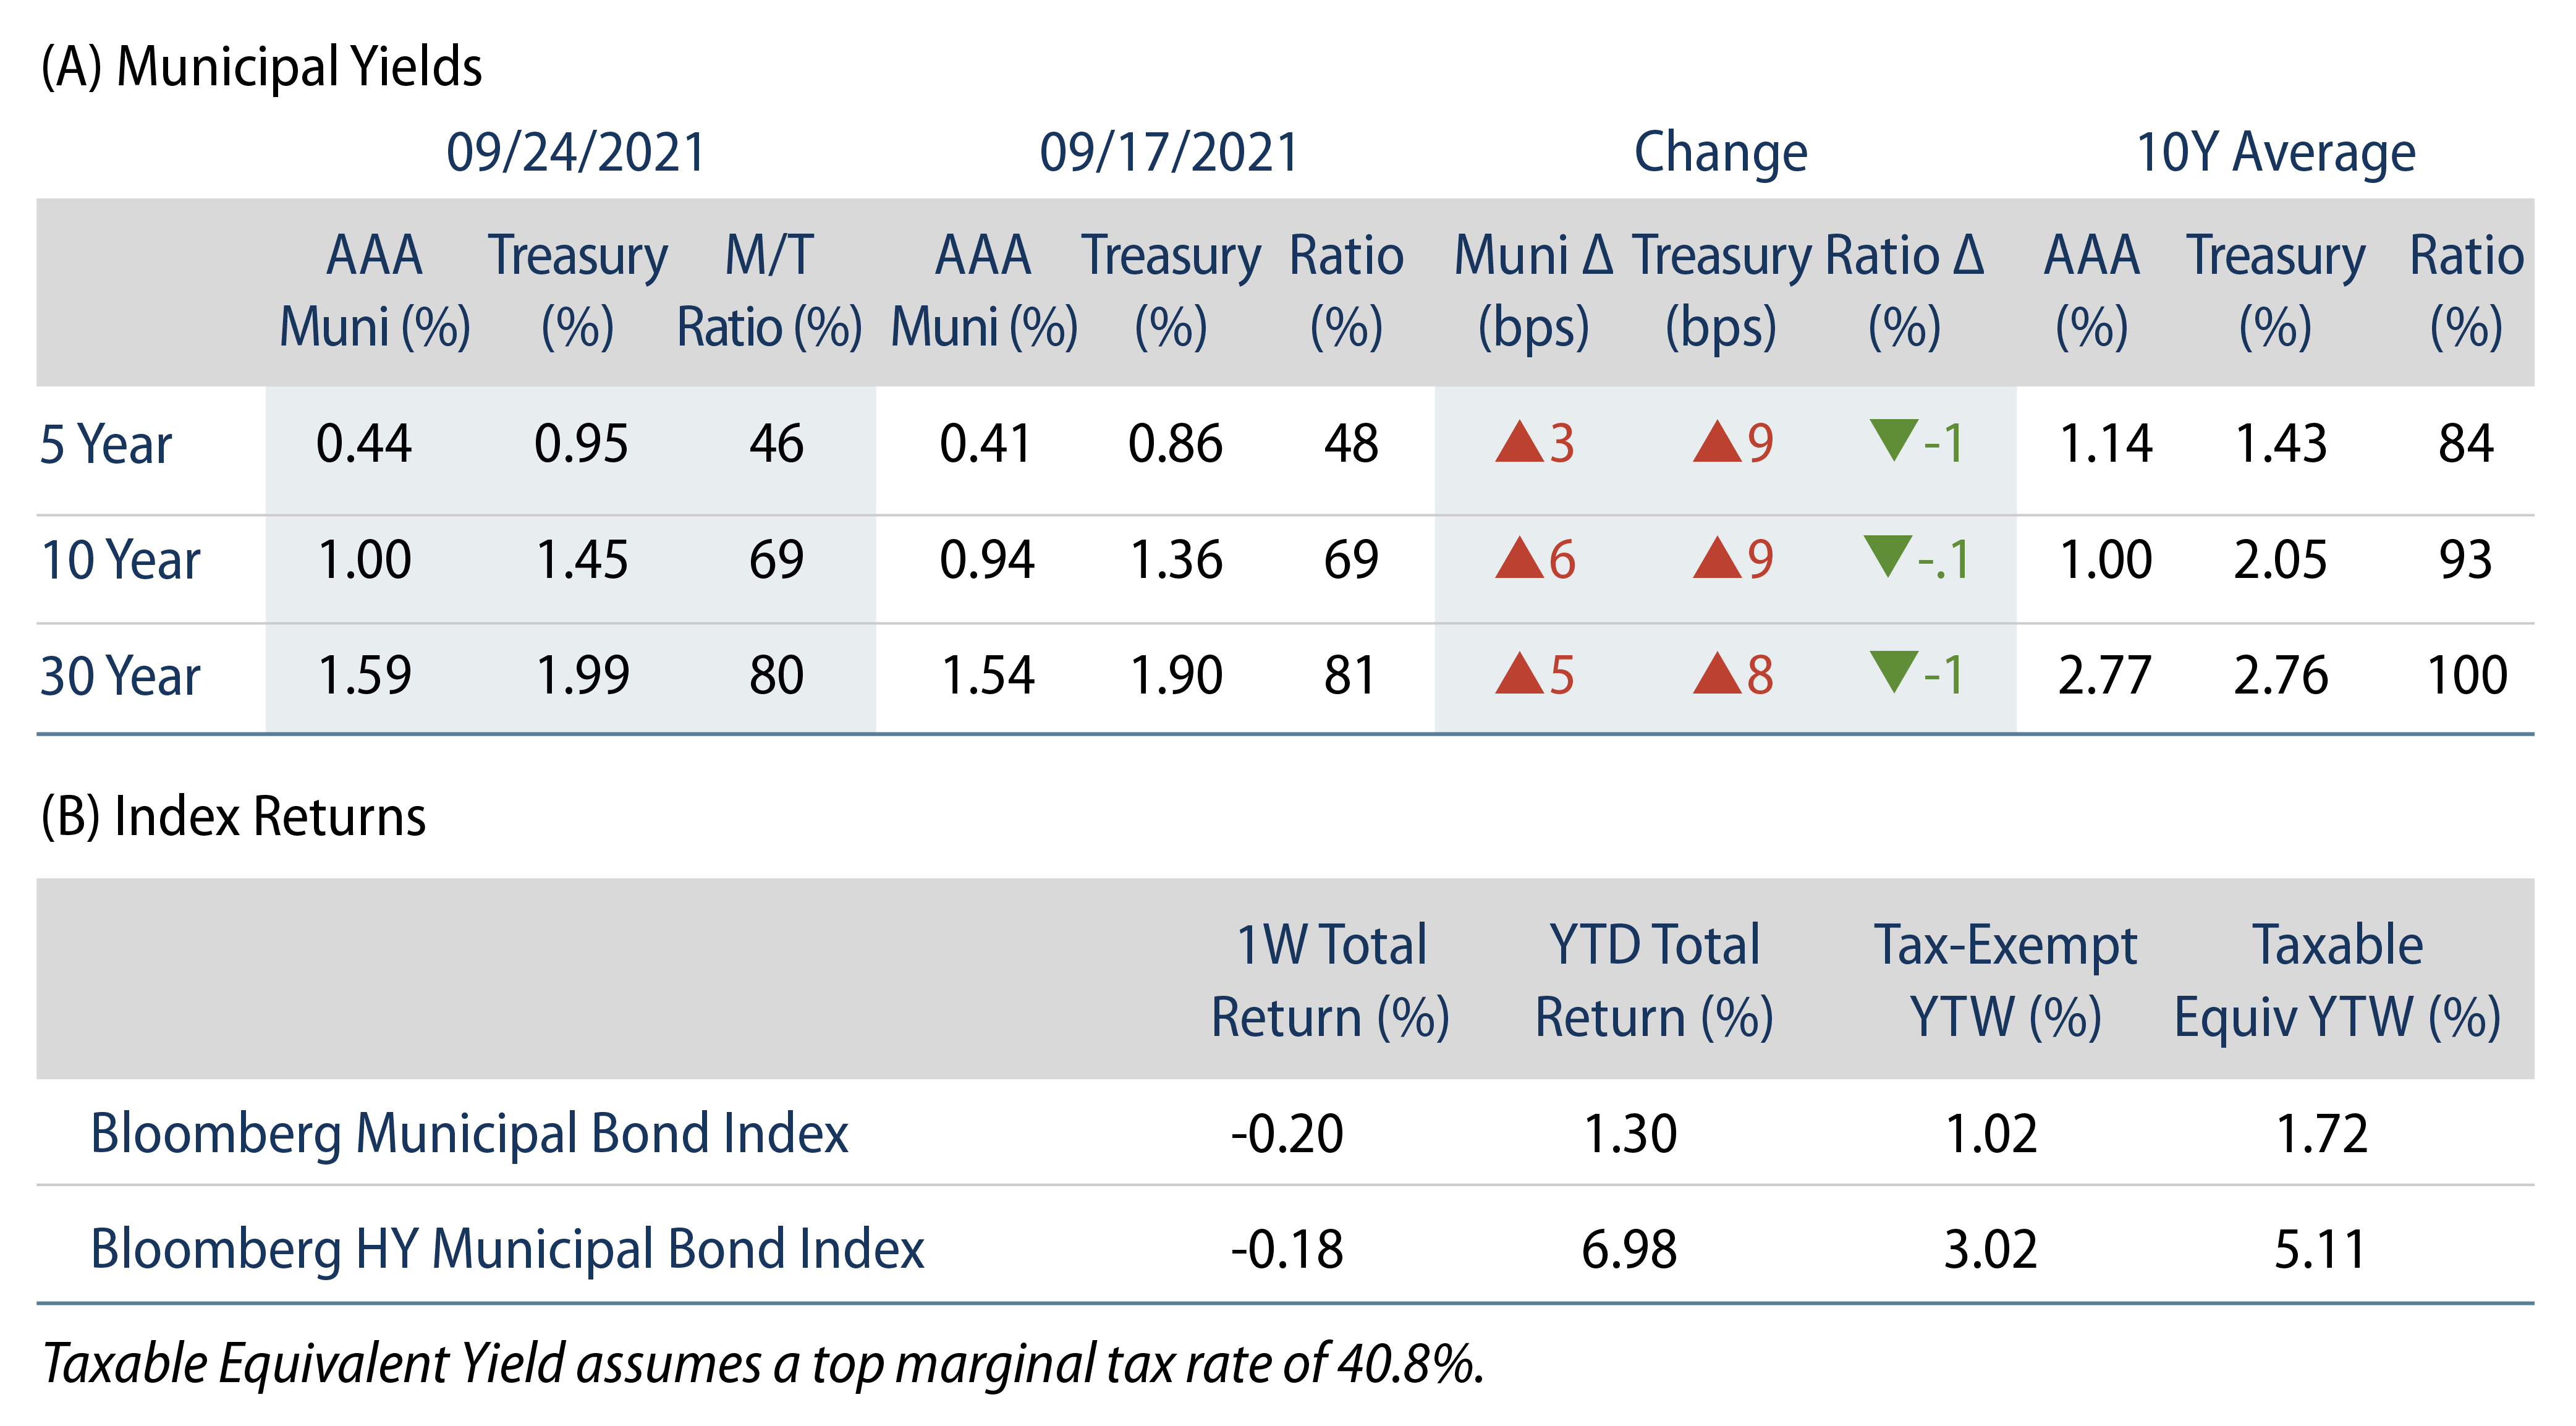
US muni yields increased 3 to 6 bps across the curve, trailing Treasuries higher. The Bloomberg Municipal Index returned -0.20%, while the HY Muni Index returned -0.18%. Technicals remained strong, as municipal mutual fund demand continued to override higher new-issue volumes. This week we check in on the states’ usage of federal stimulus spending.

Technicals Remain Supportive

Fund Flows: During the week ending September 22, municipal mutual funds recorded $1.2 billion of net inflows. Long-term funds recorded $1.1 million of inflows, high-yield funds recorded $408 million of inflows and intermediate funds recorded $212 million of inflows. Municipal mutual funds have now recorded inflows 70 of the last 71 weeks, extending the record inflow cycle to $150 billion, with year-to-date (YTD) net inflows also maintaining a record pace of $88 billion.

Supply: The muni market recorded $9.9 billion of new-issue volume during the week, down 22% from the prior week. Total issuance YTD of $335 billion is 4% higher from last year’s levels, with tax-exempt issuance trending 14% higher year-over-year (YoY) and taxable issuance trending 20% lower YoY. This week’s new-issue calendar is expected to increase to $11.4 billion of new issuance. The largest deals include $1.9 billion state of Hawaii and $1.8 billion Golden State Tobacco Securitization Corp. transactions.

This Week in Munis—Checking in on Stimulus Spending

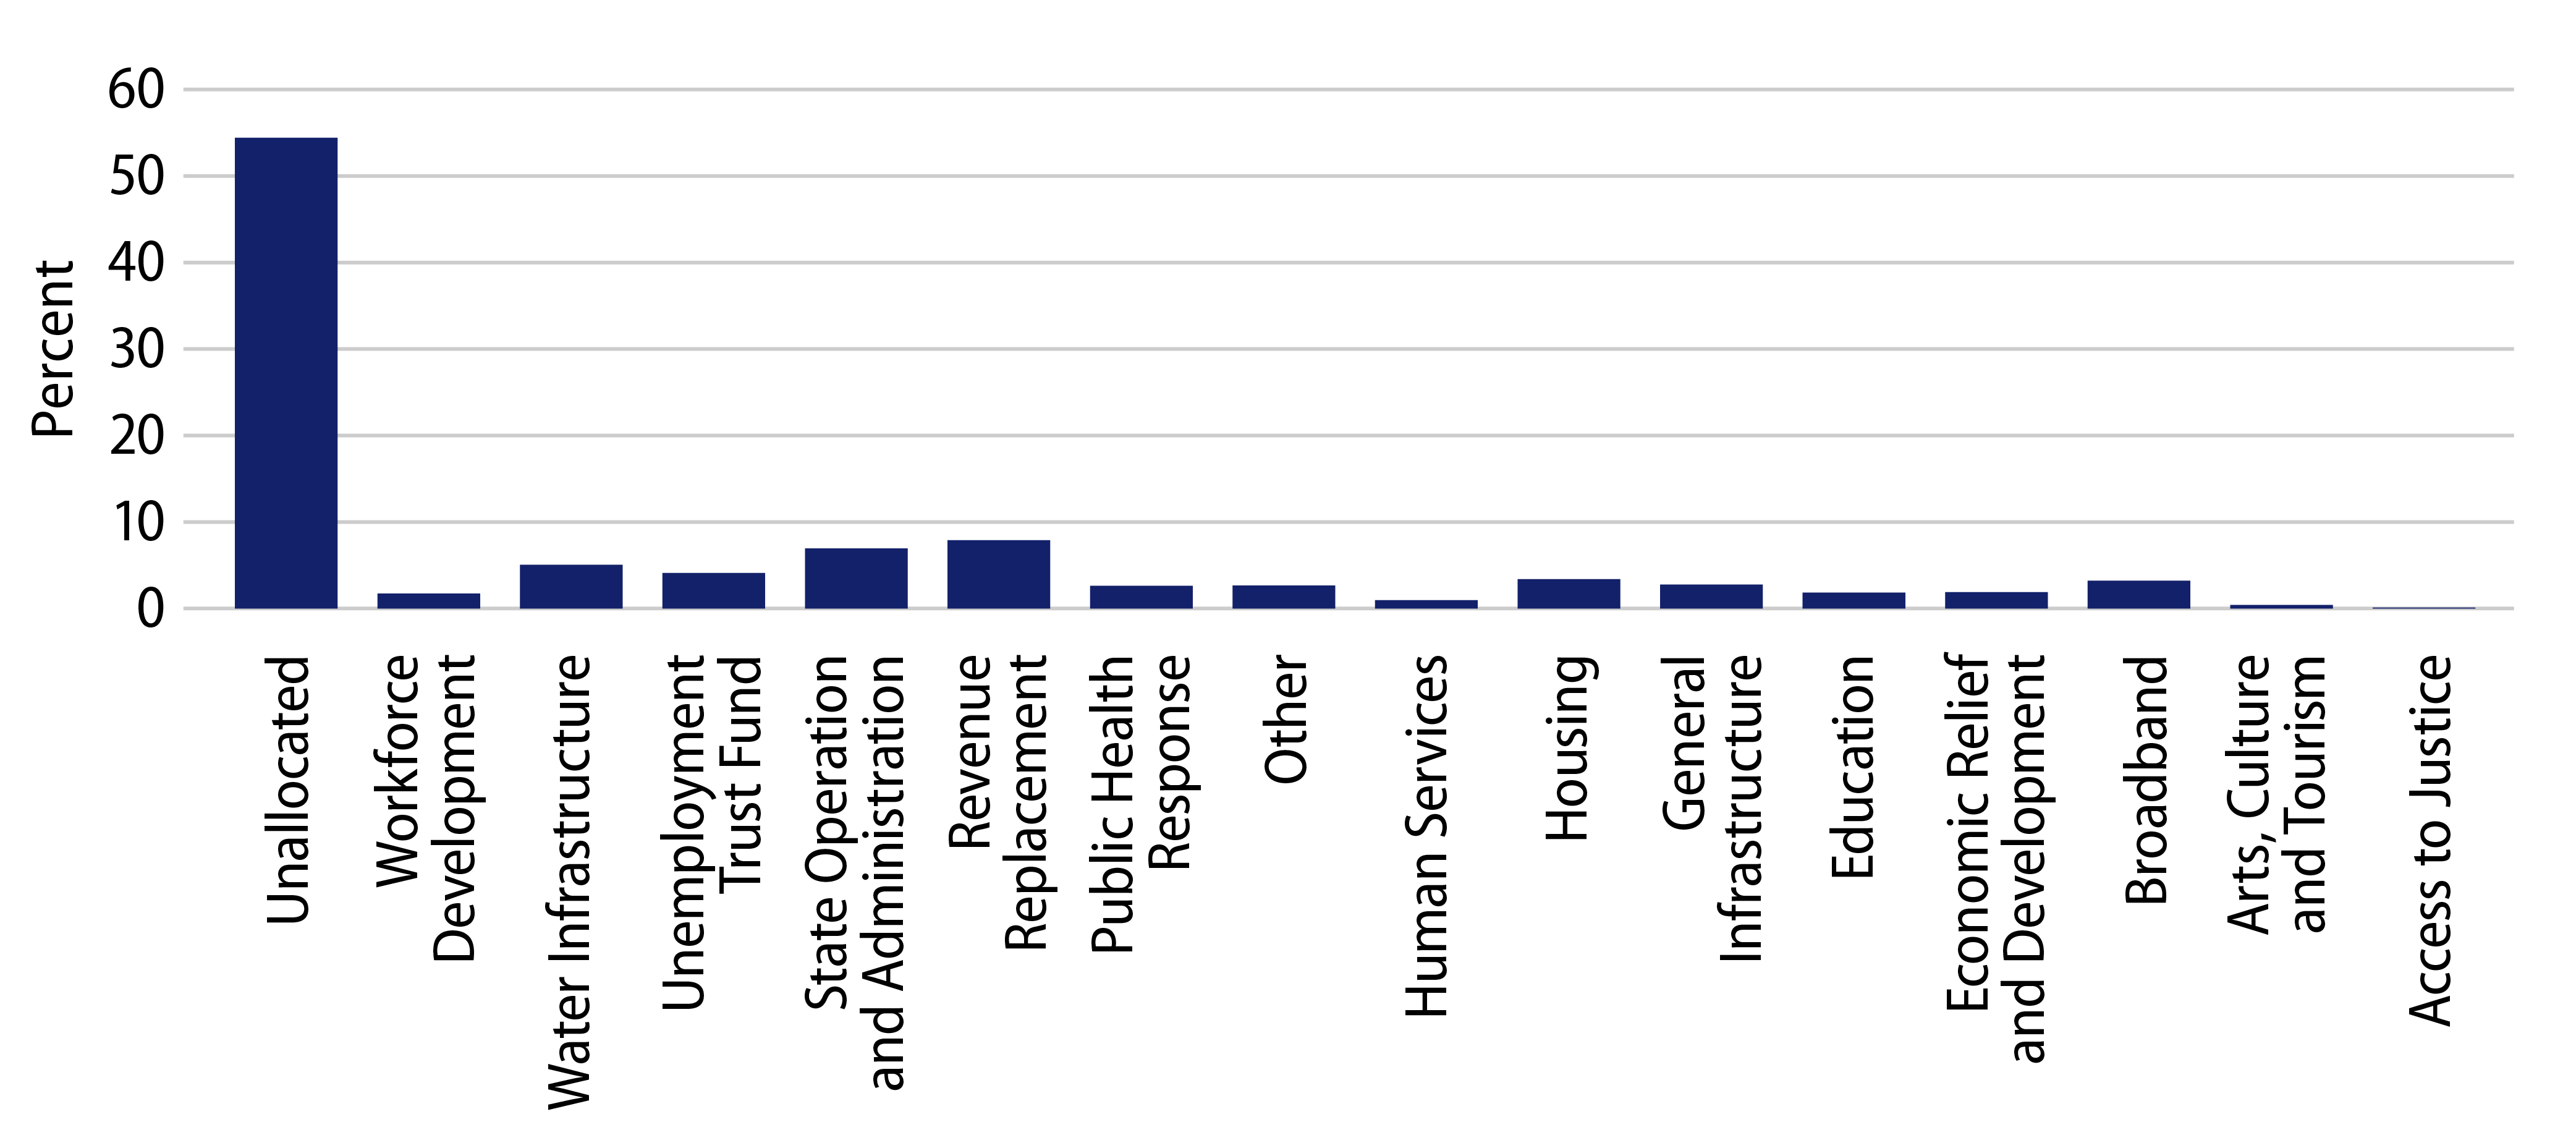
The American Rescue Plan Act (ARPA) allocated $195.3 billion in aggregate funds to all of the states, which must be spent by the end of 2026. So far, 46% of total funding has been earmarked for spending, with the largest amounts going to revenue replacement ($15 billion), followed by administration and operations ($13 billion) costs.

Not surprisingly, states vary in how much of their funding has been allocated to date. California and New York have allocated all their ARPA funds. California will use 32% of its dollars to replace lost revenues, followed by housing and broadband expenditures. California may be using these funds to help solve two of its well-known social problems that were exacerbated by the pandemic: affordable housing and lack of connectivity throughout its largely rural geography. New York has not yet broken down its fund usage.

New York and California’s treatment of stimulus funds is contrasted by the state of Texas which has not allocated any of its $15 billion ARPA funds, but it is providing for localities through the separately established Coronavirus Local Fiscal Recovery Fund. Florida, another conservative state, has appropriated 60% of its ARPA funds while Illinois, a more fiscally challenged state, still has 84.5% of its ARPA funds available.

Certainly, ARPA funds have supported the outlook for municipal credit, as state median rainy-day fund balances are projected to reach 8.3% in fiscal-year 2022, just shy of pre-pandemic levels and well above the 1.6% seen during the Great Recession. Given that 2021 state tax revenues fared better than expected, ARPA funding may be used to help solve challenges that are allowable under the legislation, rather than simply replace lost revenue. Certain states that not have not allocated their full proportions of aid have also advocated that these funds support infrastructure initiatives, a provision that was included in the Senate-approved infrastructure bill currently sitting in Congress. Given the potential for the Covid delta variant to slow the economic recovery, it is prudent to leverage ARPA funding to build reserves, and we continue to monitor potential positive downstream impacts of federal funds on infrastructure entities in states with excess unallocated ARPA funding.

Exhibit 1: Total of State ARPA Spending by Category
Total of State ARPA Spending by Category
Source: National Conference of State Legislatures, Western Asset. As of 20 Sep 21. Select the image to expand the view.
Exhibit 2: Municipal Bond Yields and Index Return
Municipal Bond Yields and Index Return
Source: Bloomberg. As of 24 Sep 21. Select the image to expand the view.
Exhibit 3: Tax-Exempt Muni Valuations
Tax-Exempt Muni Valuations
Source: Bloomberg. As of 24 Sep 21. Select the image to expand the view.
© Western Asset Management Company, LLC 2024. The information contained in these materials ("the materials") is intended for the exclusive use of the designated recipient ("the recipient"). This information is proprietary and confidential and may contain commercially sensitive information, and may not be copied, reproduced or republished, in whole or in part, without the prior written consent of Western Asset Management Company ("Western Asset").
Past performance does not predict future returns. These materials should not be deemed to be a prediction or projection of future performance. These materials are intended for investment professionals including professional clients, eligible counterparties, and qualified investors only.
These materials have been produced for illustrative and informational purposes only. These materials contain Western Asset's opinions and beliefs as of the date designated on the materials; these views are subject to change and may not reflect real-time market developments and investment views.
Third party data may be used throughout the materials, and this data is believed to be accurate to the best of Western Asset's knowledge at the time of publication, but cannot be guaranteed. These materials may also contain strategy or product awards or rankings from independent third parties or industry publications which are based on unbiased quantitative and/or qualitative information determined independently by each third party or publication. In some cases, Western Asset may subscribe to these third party's standard industry services or publications. These standard subscriptions and services are available to all asset managers and do not influence rankings or awards in any way.
Investment strategies or products discussed herein may involve a high degree of risk, including the loss of some or all capital. Investments in any products or strategies described in these materials may be volatile, and investors should have the financial ability and willingness to accept such risks.
Unless otherwise noted, investment performance contained in these materials is reflective of a strategy composite. All other strategy data and information included in these materials reflects a representative portfolio which is an account in the composite that Western Asset believes most closely reflects the current portfolio management style of the strategy. Performance is not a consideration in the selection of the representative portfolio. The characteristics of the representative portfolio shown may differ from other accounts in the composite. Information regarding the representative portfolio and the other accounts in the composite are available upon request. Statements in these materials should not be considered investment advice. References, either general or specific, to securities and/or issuers in the materials are for illustrative purposes only and are not intended to be, and should not be interpreted as, recommendation to purchase or sell such securities. Employees and/or clients of Western Asset may have a position in the securities or issuers mentioned.
These materials are not intended to provide, and should not be relied on for, accounting, legal, tax, investment or other advice. The recipient should consult its own counsel, accountant, investment, tax, and any other advisers for this advice, including economic risks and merits, related to making an investment with Western Asset. The recipient is responsible for observing the applicable laws and regulations of their country of residence.
Founded in 1971, Western Asset Management Company is a global fixed-income investment manager with offices in Pasadena, New York, London, Singapore, Tokyo, Melbourne, São Paulo, Hong Kong, and Zürich. Western Asset is a wholly owned subsidiary of Franklin Resources, Inc. but operates autonomously. Western Asset is comprised of six legal entities across the globe, each with distinct regional registrations: Western Asset Management Company, LLC, a registered Investment Adviser with the Securities and Exchange Commission; Western Asset Management Company Distribuidora de Títulos e Valores Mobiliários Limitada is authorized and regulated by Comissão de Valores Mobiliários and Brazilian Central Bank; Western Asset Management Company Pty Ltd ABN 41 117 767 923 is the holder of the Australian Financial Services License 303160; Western Asset Management Company Pte. Ltd. Co. Reg. No. 200007692R is a holder of a Capital Markets Services License for fund management and regulated by the Monetary Authority of Singapore; Western Asset Management Company Ltd, a registered Financial Instruments Business Operator and regulated by the Financial Services Agency of Japan; and Western Asset Management Company Limited is authorised and regulated by the Financial Conduct Authority ("FCA") (FRN 145930). This communication is intended for distribution to Professional Clients only if deemed to be a financial promotion in the UK as defined by the FCA. This communication may also be intended for certain EEA countries where Western Asset has been granted permission to do so. For the current list of the approved EEA countries please contact Western Asset at +44 (0)20 7422 3000.