

KEY TAKEAWAYS
- Since the 1970s, the Fed has sharply lowered interest rates in the US to counter recessions. With short-term rates already below 2%, comparable cuts during the next recession would require negative rates.
- The experiences of Japan and parts of Europe that have already seen negative interest rates help inform our view of how private banks, the US government and the markets are likely to react when confronted with negative rates.
- While negative rates charged on bank reserves have garnered the most attention, the evidence suggests that the fairly standard policy practice of expansive open-market operations is what really has driven market yields into negative territory in Japan and Europe.
- We think the US financial markets will have no technical difficulty dealing with a negative-rate environment.
- The difficulty of sustaining negative rates will arise from getting investors and savers to accept negative returns on their liquid asset holdings when a zero return is available in cash. For a variety of reasons, such resistance could be much more intense if and when the US adopts negative rates than it has been so far in Japan and Europe.
- The evidence of salutary economic effects from negative rates is less than compelling.
- Overall, negative rates in the US could be a perilous course for the Fed to pursue, even though the political pressures for it will be substantial.
Below-zero interest rates on monetary policy variables are known as negative interest rate policy, or NIRP. The European Currency Union has been practicing NIRP since 2014, Japan since 2016 (Exhibit 1). Presently, sovereign bond yields are negative throughout the developed-market (DM) world except in the US, the UK and Norway, and some private-sector debt has fallen into negative territory in parts of Europe.
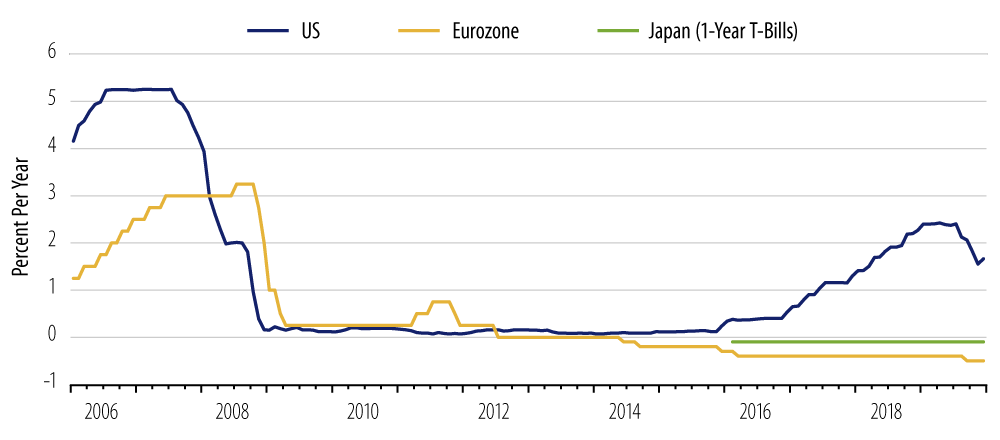
Our guess is that negative rates are all but inevitable in the US when and as the next recession emerges. So, it makes sense for US investors to learn more about the mechanics, intended benefits and possible pitfalls of a NIRP regime. This paper is intended to start or move you along that education process. We’ll discuss why we think NIRP is all but inevitable in the US, how NIRP will likely work in practice, how the Federal Reserve (Fed) will implement and enforce negative rates, and how the regime might play out in US markets.
Why Will NIRP Occur?
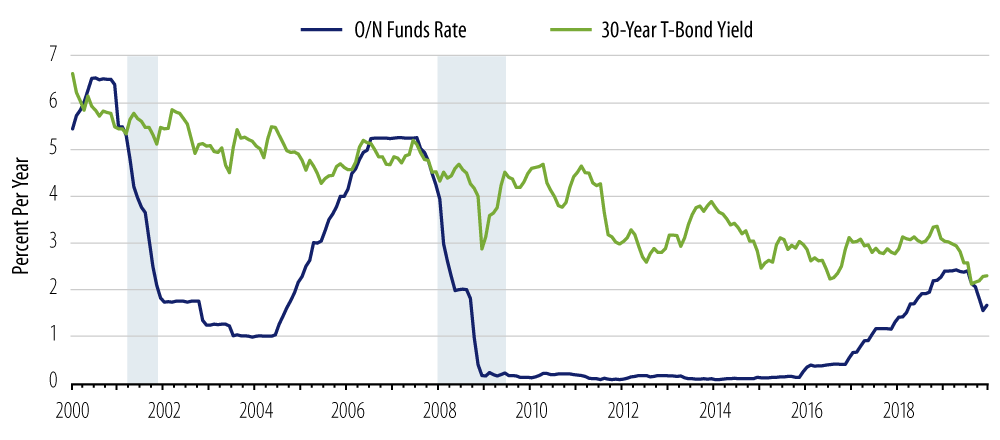
During each recession since the 1970s, the Fed has cut short-term interest rates by more than 500 basis points (bps). The funds rate went from 19.0% to 8.5% over 1981-1983, from 9.75% to 3.0% over 1989-1992, from 6.5% to 1.0% over 2001-2003 and from 5.5% to essentially zero over 2007-2008 (Exhibit 2). The Fed has set great stock in its ability to aid the economy during recessions.
However, the fed funds rate peaked at 2.40% late in 2018 and has since been cut to 1.55%. While Fed Chair Jerome Powell has outlined circumstances for possibly renewed rate hikes, our judgment is that the fed funds rate has peaked for this cycle.
So, short-term rates are likely to stand below 2% when the next recession emerges. If the Fed is to pursue rate cuts on anything approaching the scale seen in previous recessions, a move to the negative is inevitable.
It doesn’t matter whether you are pleased or discomfited by this prospect. The plain facts of the situation leave the Fed with two options: do little or nothing appearing to help the economy weather the next recession or else embark on NIRP.
The Fed has the experience of continental Europe and Japan as a precedent. Various current and former Fed officials have speculated about the legality of a negative rate regime in the US, and the Fed has adroitly handled comparable legal hurdles in the past. It is hard to see any possible legal obstacles to NIRP prevailing if the Fed wants to move and Congress is faced with the exigencies of a declining economy.
How Will NIRP Be Handled by the Markets?
Can bonds be priced in a negative-yield environment? The answer is: yes, easily. Fixed-income math works just as well with negative yields as with positive yields, with one negligible exception we’ll get to in a moment.
Consider, for example, a 3% coupon bond with 10 years to maturity. For a par value of $100, the bond will pay 10 years’ of coupon payments of $3 per year and $100 of principal, for total cash flows of $130. At a par price of $100, the bond would yield its coupon rate, 3%. As yields fall below 3%, the price of the bond rises above par. At a price of $130, the total undiscounted value of the bond’s cash flows equals its price. In other words, its yield is zero. At any price above $130, the total cash flows accruing to the bond are less than its initial price, implying less repayment than initial outlay, thus a negative yield.
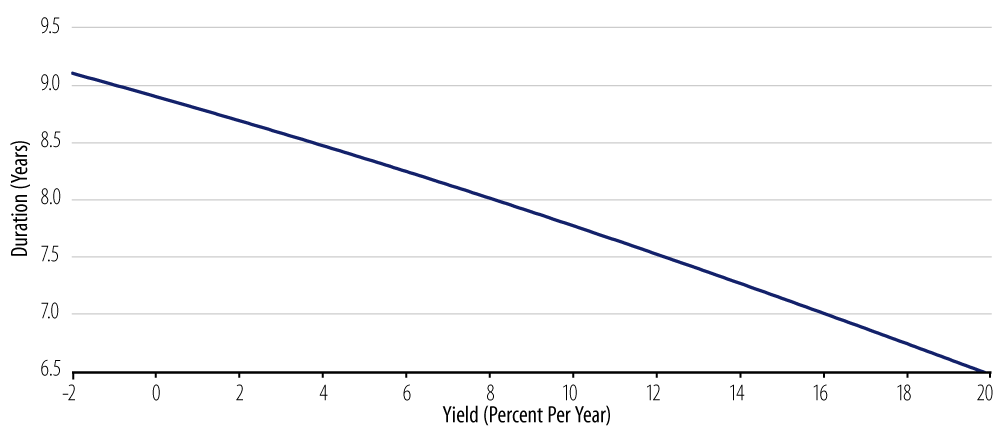
Exhibit 3 illustrates how the price of such a 3% bond varies as yields decline to -2% and Exhibit 4 shows how the duration of that bond would vary as yields decline to -2%. We could go lower, but you get the point.
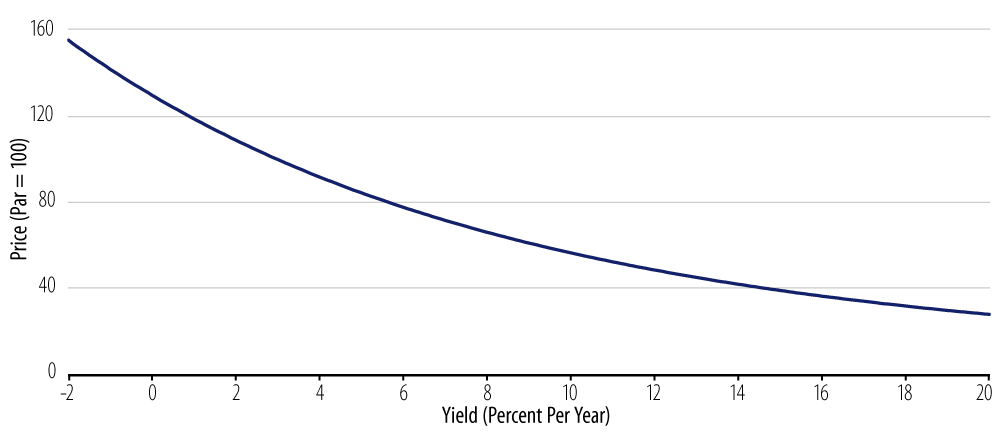
Again, there is nothing in bond math requiring positive yields. Indeed, the experiences in Europe and Japan have followed in exactly this manner. Bonds there do not have negative coupons. They have positive or zero coupons, but their prices have risen so high that their yields are now negative.
Similarly, evaluation of pension liabilities is no more difficult with negative discount rates than it is with positive ones. It will still be the case that as yields fall further—become more negative—pension valuations will rise further, and their duration will lengthen. Whether pension funds or insurance companies will be able to deal with the stress from such increases in liability valuation is another issue unrelated to the plain math.
How would money funds operate in a NIRP environment? In Europe, money funds have adapted to NIRP not by quoting negative yields, but via share cancellation. Euro money funds do not “break the buck” in terms of per share valuations. However, money fund investors see the number of shares in their accounts declining over time in order to effect a negative rate of return.
The only technical problem negative rates pose for fixed-income math is for consols, bonds that never mature, but pay a (supposedly) fixed coupon forever. Such instruments were issued by both the UK and the US in the 19th and early-20th centuries. The prices of consols would become unboundedly large as their yields approached zero, and no price could be calculated at any negative yield. However, all the consols ever issued have since been repurchased, so this is not a relevant issue for NIRP considerations.¹
How Will NIRP Be Implemented?
A negative fed funds rate would mean that commercial banks would pay other banks to borrow reserves (cash) from them. Why would banks ever do this? They would if it cost them even more to hold the reserves themselves. Since the onset of the global financial crisis in 2008, central banks across the developed market world have moved to pay interest on the reserves commercial banks deposit with them. In Europe and Japan, under NIRP, the European Central Bank (ECB) and Bank of Japan (BoJ) have shifted from paying positive interest on reserves to “charging” a negative rate of interest on reserves (IOR).
Banks can avoid these charges by holding vault cash, which earns a zero yield, but European and Japanese banks apparently have only limited ability to stockpile vault cash, and reserves are much more liquid when held on deposit at the central bank than when they are stashed in bank vaults. It is also likely that “moral suasion” has discouraged banks from building up vast stockpiles of zero-yield cash. Any bank that did so might be seen as contravening the central bank’s wishes and possibly looked upon unfavorably should it require future central bank assistance.
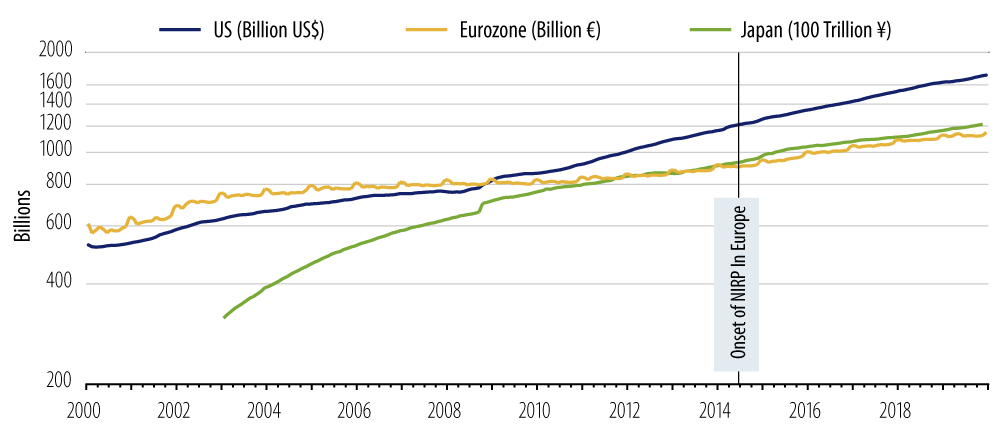
For all these reasons, European and Japanese banks have continued to hold reserves on deposit at their respective central banks, even though they are now paying a fee for that “privilege.” Neither vault cash held by banks nor currency held by the public has exhibited extraordinary increases in Europe or Japan since the onset of NIRP. Exhibit 5 shows this behavior for currency in circulation (in comparison to that in the US, where rates have remained positive).
In principle, negative rates could be sustained solely by reduction of the IOR to negative levels. However, this would not be a suitable way of easing policy. That is, forcing banks to accept negative rates on their reserves hardly amounts to easy policy.
Banks are required to hold reserves both by sound operating principles and by central bank regulation. In the days before IOR, having to hold these required reserves with no return was seen as a tax on bank operations. Paying a positive IOR was then intended as an effective cut in that tax. But if raising the IOR is an effective tax cut for banks, then lowering it to zero or negative levels must be an effective tax increase on banks.
In standard macroeconomic analysis, tax hikes reduce both GDP and interest rates. Though they lower interest rates, tax hikes are clearly not expansive policy, let alone expansive monetary policy. By the same lens, increasing effective taxation on banks by lowering the rate they receive/pay on reserves will indeed lower yield levels, but it will likely impede bank lending operations and, thus, prove contractionary.
Exhibit 6 makes this point graphically. We are used to thinking of the demand for reserves as depending on market interest rates, say T-Bill yields. This is because in a no-IOR world, market yields are the opportunity cost of holding reserves, what the bank gives up in order to hold reserves. So, as market yields decline, the demand for reserves increases and the demand for T-Bills declines, because lower market yields mean lower opportunity costs of holding reserves relative to T-Bills.
It is a simple matter to extend this analysis to handle non-zero IORs. Then, the opportunity cost of holding reserves becomes the difference or spread of market yields over the IOR. For any given level of IOR, the higher the level of market yields, the lower the demand for reserves and the higher the demand for T-Bills, as before, and vice versa for a lower level of market yields. It follows that for any given level of market yields, the lower the IOR, the higher the opportunity cost of holding reserves, and so the lower the demand for reserves and the higher the demand for T-Bills. The opposite holds for a higher IOR.
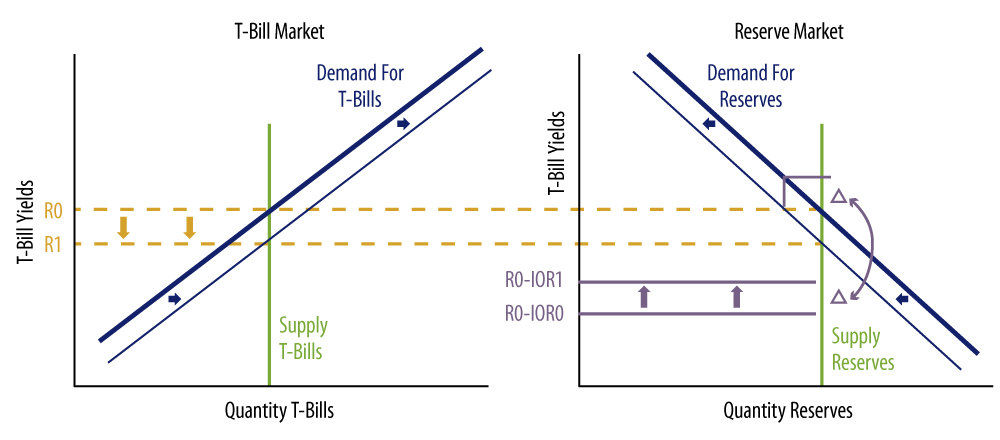
With market yields still the variable on the vertical axes, we can handle decreases or increases in market yields by sliding along the demand curves for reserves and T-Bills, just as we could before the introduction of the IOR. However, now, decreases in the IOR mean a shift leftward (inward) of the demand curve for reserves and a shift rightward (outward) of the demand curve for T-Bills. This is because the lower IOR means a higher opportunity cost of holding reserves, thus less demand for reserves and more demand for T-Bills at any given level of market yields. These curves move in the opposite directions when the IOR increases, with the demand for reserves shifting out and the demand for T-Bills shifting in.
Exhibit 6 shows the effects of a decline in the IOR that is not accompanied by any change in the central bank’s supply of reserves. The IOR declines from IOR0 to IOR1 (possibly negative), a change of Δ. At the previous level of market yields R0, the opportunity cost of holding reserves is now higher by amount Δ, and so the demand curve for reserves shifts inward/leftward by about the same amount as the demand for reserves would have declined if market yields had risen by Δ (with no change in the IOR). The demand curve for T-Bills shifts outward/rightward2, and in both markets there is downward pressure onyields 3.
With the lower demand for reserves—because of the higher effective tax on holding reserves—there is reason to believe that bank lending activity will be lower at any given level of market yields. In other words, this looks to be a contractionary change in monetary policy. Market yields will decline, just as they would with an increase in income tax rates, but there is no reason to think that the decline in yields will have expansionary effects on the economy. The opposite is to be expected.
The central bank could accomplish the same or a larger decline in market yields via open-market operations that increase the supply of reserves in exchange for a decrease in the (net) supply of T-Bills, pushing the supply curve for reserves to the right and the (net) supply curve for T-Bills to the left. Such an operation would imply an expansion of bank lending activity, because at any level of market yields, banks now have a larger supply of reserves and liquidity than they did previously.
In other words, negative yields could be accomplished solely by pulling the IOR to sufficiently negative yields. However, if the intention is to stimulate the economy, negative yields must be effected via an expansion of the central bank’s balance sheet (an increase in the supply of reserves).
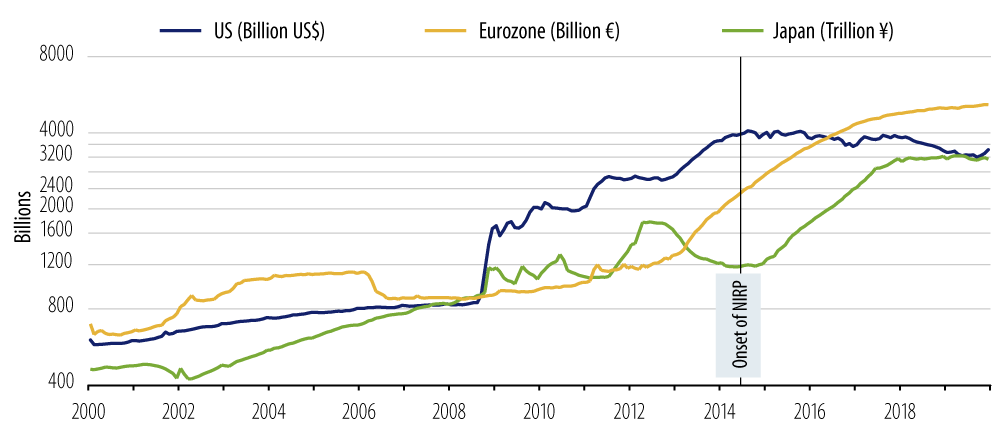
Whether or not one accepts this assertion, the facts are clear that in both Europe and Japan, NIRP has been achieved via BOTH negative IORs and a dramatic expansion of the supply of reserves to the respective banking systems.
As seen in Exhibit 7, both the ECB and BoJ have massively expanded their balance sheets while pursuing NIRP. In percent terms, both the ECB and BoJ balance sheets under NIRP have expanded by as much as or more than did the Fed’s balance sheet under its successive campaigns of quantitative easing (QE), QE1, QE2 and QE3 combined!
Negative rates charged on reserves have garnered the attention, but the evidence suggests that the “heavy lifting” propelling market yields into negative territory has in fact been the fairly standard policy practice of expansive open-market operations. Reserves are available in such plentiful supplies across Europe and Japan that banks are pleading with other banks to take the reserves off their hands, even paying them to do so.
Wouldn’t banks prefer to lend those excess reserves in the private sector at some positive rate? Sure they would. This is the whole point of NIRP: to make yields on reserves and other safe assets so low that banks and other investors are pushed to provide credit to more risky borrowers, such as businesses and consumers. Whether this policy has actually done so is another issue, and one we will deal with in the following sections.
Whence NIRP?
As recently as the turn of the 21st century, students of central banking considered zero yields to be a “bound” on policy below which rates couldn’t go. As our analysis thus far makes clear, this was never a matter of mathematics. Rather, the presumption was that savers and investors would never accept negative yields on their fixed-income investments, because they could always get zero by holding cash. What has happened to contradict this?
For banks, they are required by regulations to hold some of their assets as reserves. The ECB and BoJ have been charging banks for that “privilege,” and their only alternative is to hold reserves as vault cash, an unattractive alternative. But what about depositors? No one is forcing them to hold liquid balances in negative-yielding bank deposits.
Well, so far, depositors have not had to pay explicitly negative rates. Instead, banks in Europe have kept explicit deposit rates at zero for most retail customers and covered their costs by increasing (flat) fees associated with opening and maintaining accounts. So, there has been no price incentive for depositors to reduce their deposits unless they are willing to forego their banking relationship altogether.4
This situation might be changing. European banks have been able to get by on fee increases alone because European policy rates have been only somewhat below zero. However, with the latest rounds of further rate cuts this summer, EU policy rates have fallen sufficiently negative such that commercial banks are starting to impose explicitly negative rates even on retail deposits. Going forward, we’ll see whether this imposition of explicitly negative deposit rates for small depositors marks the tipping point for acceptance of NIRP policy.
It is possible that such a tipping point will come a lot sooner in the US if and when NIRP is instituted here. American savers and investors may prove to be less pliant than their European and Japanese counterparts. Furthermore, at least in the past four years, European and Japanese investors have had a “haven” of non-negative returns in USD-denominated instruments, where they could park truly idle cash balances. If the US goes negative as well, that haven will be gone for everyone, and we could see an exodus into cash.
We might even see not-so-cottage industries rising up, offering to store investors’ cash holdings for nominal fees in warehouses offering ample security and protection against thieves. Banks could even take to substantially expanding their own safe deposit vault facilities.
Fed Credit Yes, Cash No?
At that point, central bankers would face an ironic quandary. The point of NIRP is to make liquidity so plentiful that returns on it go negative and investors are pushed into more risky assets. However, to do so, central banks might have to restrict access to cash, the very asset they are striving to supply in more than ample quantities (at least in “virtual cash” form, i.e., reserves).
In order to reduce the convenience of holding cash, there have already been efforts to decrease the available supply of large-denomination euro notes, with talk of similarly reducing the supply of large denomination US dollar notes. To date, such suggestions have been couched as countering criminal or underground activity. However, if providers of storage for currency hoarders are seen as subverting the policy ends of DM central bankers, they too might be considered “underground” actors and so hindered.
Even if they can prevail over these potential tensions, central banks in an all-NIRP DM world will still have to come to grips with the fact that they will be trying to reduce access to the very asset they are trying to provide in ample supply. They will also be attempting to establish an artificial barrier between holdings of actual cash, with a zero yield, and virtual cash, with a negative yield. The accompanying stresses have not yet dislodged European or Japanese NIRP policy, but things could change as yields there go more negative and if—and as—the Fed starts to pursue NIRP as well.
NIRP … Really?
Of course, all of this begs the question of how effective NIPR has been in Europe and Japan … or even how effective zero interest rate policy (ZIRP) has been in the US since the financial crisis. If ZIRP and NIRP can clearly be seen to have successfully stimulated the US and European economies over the last decade, then any coercion inflicted on savers and investors could be said to be worth the cost, and policymakers’ actions can be seen to be benevolent rather than arrogant. However, the range of studies to date has provided little or no hard evidence pointing to beneficial economic effects from ZIRP or NIRP.
In a 2010 speech, then-Fed Chair Ben Bernanke cited a number of studies purportedly showing the beneficial effects of ZIRP and QE in the US. One “structural” study5 modeled the empirical structure of the money markets over 1994-2007 and then simulated how open-market operations on the order of magnitude of QE1-QE3 would have affected interest rates within that structure. Other studies cited were “event studies,” analyzing the changes in market yields in the minutes and hours following the announcement of various policy initiatives.
The “structural” study failed to address the question of whether and how various regulatory changes—Basel Accords, Dodd-Frank, etc.—not to mention the effects of financial panic may have altered the structure of US financial markets from what they were previously, thus it is not clear how relevant its analysis was to 2008-2009 money markets. The “event” studies did not even attempt to establish that the “momentary” effects on the market on the days of announcements were indeed sustained subsequently, to where they might have some impact on the economy.
Indeed, no study has attempted to or reported explicit effects of these policies on the US economy. The studies released to date on the effects of NIRP have been event studies, and, again, have not even attempted to document any effects on the European or Japanese economies.
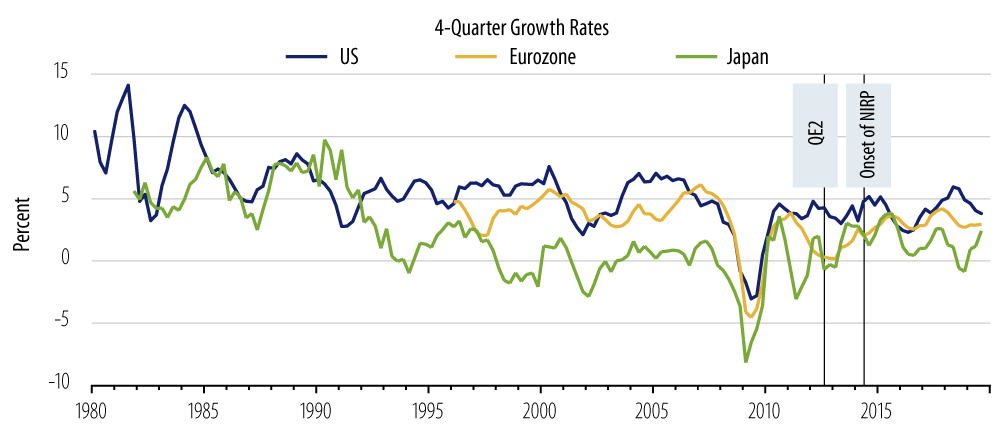
Certainly, experience fails to provide any easily intelligible indication that the adventurous policies of the last decade have meaningfully affected their respective economies. Despite unprecedentedly active monetary policy activity, nominal GDP growth across the US, Europe, and Japan has remained remarkably slow and remarkably steady throughout the expansion (Exhibit 8).
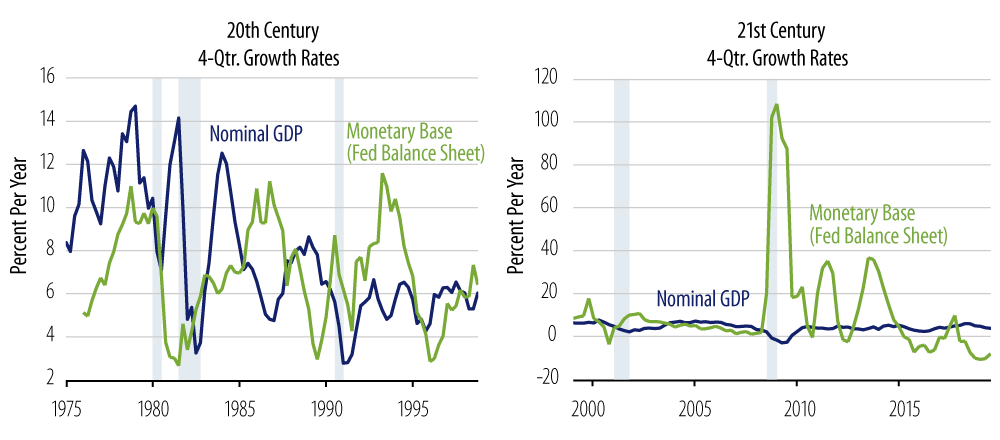
From the 1970s through 2005, variations in the growth rate of the Fed’s balance sheet were accompanied by roughly equal variations in the growth of nominal GDP (Exhibit 9, left-hand side). Since the onset of the global crisis, however, the magnitude of Fed open-market operations has exploded, with no visible effects on nominal growth (Exhibit 9, right-hand side). The experience has been the same across Europe, Japan and even the UK.
Why has policy proven so ineffectual? We described earlier how Fed open-market operations increase the available supply of bank reserves and thence, presumably, stimulate bank lending and deposit-taking and the economy. This is standard money-and-banking analysis. Such theory and analysis was established in an environment where banks’ reserve requirements were the dominant constraint on banking activity. In the last few decades, however, capital requirements have come to be a dominant constraint on bank activity, dramatically more so than was true previously.
After three rounds of Basel Accords, after Sarbanes-Oxley and Dodd-Frank, and after the last few years of Fed stress tests of banks’ capital and liquidity on a number of criteria, banks now face a wide range of constraints on their behavior. The Fed can inject liquidity into the system, but the evidence suggests that banks merely sit on it. Without banks’ transmitting Fed policy to the economy, central bank policy operations can be argued to have no effect on the economy or even on market yields. Ditto for Europe, Japan and the UK.
These points are also debatable, but here too, the lack of clear historical responsiveness of the US, European or Japanese economies since 2008 to repeated doses of extreme monetary stimulus is forceful support for the argument that NIRP and even ZIRP have not stimulated their respective economies.
Conclusions
Central banks, of course, have argued strenuously otherwise, but the evidence behind their arguments is less than compelling. Still, the political clout of the Fed and other DM central banks will be a factor when the global economy next plunges into recession, and policymakers scramble to find answers.
At present, Fed officials are confident they will not need to resort to NIRP. However, as Mike Tyson once said, everyone has a plan until they get punched in the face. It is hard to imagine that Fed officials will not resort to any tactic available or conceivable when the economy appears to be in need of it, and it is hard to see Congress standing in their way.
There will be some pushback against negative rates within the Fed, in Congress and in the private sector. Whether and when that pushback prevails will likely depend on whether US investors and depositors accept negative rates on their liquid assets. A quick and widespread exodus to cash hoarding would derail NIRP. And even if such hoarding does not immediately occur, the lack of any clearly positive response in the economy or in bank lending activity to a NIRP environment could also eventually quash the Fed’s experimentation with negative rates.
We think such experimentation is all but inevitable when and as the economy proves to be in need. The financial markets will have no technical difficulty dealing with a negative-rate environment. The difficulties in implementing and sustaining NIRP will come from getting the private sector to refrain from circumventing negative rates via increased holdings of cash, from dealing with the problems insurers and pension funds have surviving a negative-rate environment and from coping with the possibility that NIRP in the US will be as ineffective as it has been in Europe and Japan or as ZIRP has been in the US.
- The last consols in the UK were redeemed only in 2015, possibly to avoid pricing complications if and when the BoE were to pursue NIRP.
- Banks obviously hold assets other than reserves and T-Bills. Presumably, changes in the IOR would induce substitution between reserves and all these other asset types, not just between reserves and T-Bills, so that when the IOR declines, the shift inward in the demand curve for reserves would be larger than the shift outward in the demand for T-Bills. For ease of analysis, in Exhibit 6, the shifts in the demand curves for reserves and T-Bills are depicted as being of the same magnitude (but different direction). Also, the partial analysis here does not consider the role of reserves as a factor of production in the process of managing and sustaining deposits, thus financing lending operations. However, this role is implicit in our conclusion that a reduction in the demand for reserves portends a decline in banks’ supply of loans.
- A 2019 paper by Brunnermeier and Koby, https://scholar.princeton.edu/markus/publications/reversal-interest-rate-effective-lower-bound-monetary-policy, makes this same point in a more limited setting. In their model, a “reversal rate” sets in at some level of interest rates, after which further declines in interest rates contract bank lending and economic activity, due largely to the constraining effects of bank capital requirements. However, their model makes no distinction between T-Bills and reserves/cash and no distinction between market yields and the IOR. Our contention is that when these distinctions are allowed for, the reversal rate will occur at any level of IOR, as indicated in Exhibit 6, provided that the lower levels of IOR are not accompanied by any increase in bank reserves. This is not due to the effects of capital requirements, but to the effective taxation nature of declines in the IOR. Of course, even in our treatment, the constraining effects of bank capital requirements can prevent open-market operations—i.e., changes in the supply of reserves—from influencing yields and economic activity. This point is taken up in a later section of this paper.
- While large (corporate?) depositors have been hit with explicitly negative yields on deposits, we have seen reports that corporations are dealing with negative deposit rates by pre-paying and over-paying their corporate taxes, eventually receiving tax refunds that have earned a zero rate of return.
- See Li and Wei 2012, https://www.federalreserve.gov/pubs/feds/2012/201237/201237pap.pdf.