skip navigation
Blog

Stay up to date on timely topics and market events. Subscribe to our Blog now.

ECONOMY
01 April 2019

Yield Curve Discrepancies: Keeping Them Straight

By Amit Chopra, Julien Scholnick

Stay up to date on timely topics and market events. Subscribe to our Blog now.

Discussions about an inverted yield curve—and whether it portends a recession—are back in the spotlight. Of particular interest is the spread between 3-month T-bills and 10-year USTs, as this curve went negative on March 23. Because the last six out of seven US recessions have been preceded by an inversion between these two maturities (Exhibit 1), the question now is whether another recession will surface in the next six to 18 months.

Here we examine the powerful predictive history of the 3m/10yr curve and highlight why there are discrepancies between what this curve and other curves tell us. We also describe the differences in the financial landscape since the great financial crisis (GFC) and why this may prompt a different economic outcome this time around.

Exhibit 1: The 3m/10yr Spread
The 3m/10yr Spread
Source: Bloomberg. As of 31 Mar 19

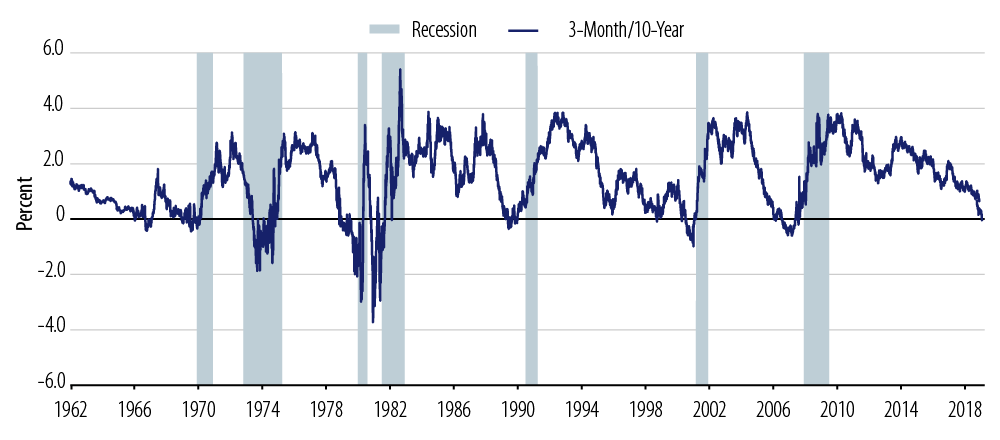
So why is the shape of the 3m/10yr curve so important? In short, the 3m rate is a proxy for the rate at which financial institutions borrow while the 10yr rate is that at which they can earn/lend/extend credit. If this spread is negative, lending or credit creation shrinks, which leads to nominal growth falling because it diminishes the incentive for financial institutions to lend for longer-term investments that generate growth.

A Tale of Two Curves

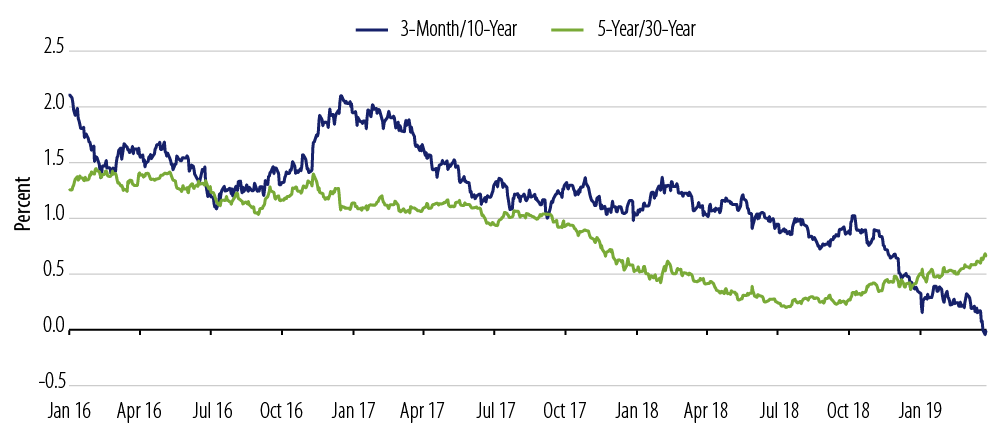
Now, if you look at the 5yr/30yr curve as a basis for assessing long-term inflation expectations, which have a high correlation with 30yr bond yields and the commensurate Fed reaction function (high correlation with 5yr UST yields), then the story is a bit different. The 5yr/30yr curve began flattening aggressively in late 3Q17 and continued until its low point of 19 bps in July 2018 before steadily steepening and reaching its current wide level of 67 bps. This steepening occurred at the same time the 3m/10yr was flattening (Exhibit 2). This is true not only in spot space, but also in forward space, suggesting that the Fed may have been preemptive in its dovishness and is engineering a soft landing to prevent a recession.

Exhibit 2: 3m/10yr Spread vs. 5yr/30yr Spread
3m/10yr Spread vs. 5yr/30yr Spread
Source: Bloomberg. As of 31 Mar 19

Changes in the Financial Landscape

A lot has changed in the financial system since the GFC that suggests the message from inverted yield curves is not the same as it’s been in the past. First, the risks of a “bank run” type of funding freeze are much lower since the GFC. Banks are not as dependent on retail funding (customer deposits) as they were prior to the crisis. For this reason, higher short rates may lessen the effect to constrain lending and create tighter financial conditions. Regulatory changes since the GFC also have made bank funding more stable and central banks are there to provide liquidity and curtail any stoppage of funding. This was reinforced last November by Fed Chair Jerome Powell who said, “after 10 years of concentrated effort in the public and private sectors, the system is now much stronger, with greater capacity to function effectively in stressful times.”

Second, credit risk or debt in the system increasingly resides on sovereign balance sheets. Private sector debt levels remain below the levels seen prior to the GFC. Given the health of the consumer and the manageable debt levels in the corporate sector, levels don’t suggest to us that the likelihood of a severe default cycle is now higher than before the crisis. Additionally, we don’t see signs of excesses in the economy that need to be unwound as was the case in previous boom-bust cycles. In fact, GDP is still struggling to return to the pre-GFC trend.

Finally, the financial landscape is now different because central banks in advanced economies are utilizing additional monetary policy tools. There’s also the expectation that central banks will remain accommodative and err on the dovish side, as evidenced by the recent pivots by both the ECB and the Fed. This was explicitly reinforced by Powell in March when he said, “My colleagues and I have one overarching goal: to sustain the economic expansion.”

The Bottom Line

While the 3m/10yr curve historically has been a powerful leading indicator of growth and inflation in the US, we think it deserves closer scrutiny given the changes in the financial backdrop. If that portion of the curve remains inverted for a protracted period then there should be greater cause for concern. But, for now, if growth is resilient and central banks remain supportive then this inversion could just be sounding a false alarm.

© Western Asset Management Company, LLC 2024. The information contained in these materials ("the materials") is intended for the exclusive use of the designated recipient ("the recipient"). This information is proprietary and confidential and may contain commercially sensitive information, and may not be copied, reproduced or republished, in whole or in part, without the prior written consent of Western Asset Management Company ("Western Asset").
Past performance does not predict future returns. These materials should not be deemed to be a prediction or projection of future performance. These materials are intended for investment professionals including professional clients, eligible counterparties, and qualified investors only.
These materials have been produced for illustrative and informational purposes only. These materials contain Western Asset's opinions and beliefs as of the date designated on the materials; these views are subject to change and may not reflect real-time market developments and investment views.
Third party data may be used throughout the materials, and this data is believed to be accurate to the best of Western Asset's knowledge at the time of publication, but cannot be guaranteed. These materials may also contain strategy or product awards or rankings from independent third parties or industry publications which are based on unbiased quantitative and/or qualitative information determined independently by each third party or publication. In some cases, Western Asset may subscribe to these third party's standard industry services or publications. These standard subscriptions and services are available to all asset managers and do not influence rankings or awards in any way.
Investment strategies or products discussed herein may involve a high degree of risk, including the loss of some or all capital. Investments in any products or strategies described in these materials may be volatile, and investors should have the financial ability and willingness to accept such risks.
Unless otherwise noted, investment performance contained in these materials is reflective of a strategy composite. All other strategy data and information included in these materials reflects a representative portfolio which is an account in the composite that Western Asset believes most closely reflects the current portfolio management style of the strategy. Performance is not a consideration in the selection of the representative portfolio. The characteristics of the representative portfolio shown may differ from other accounts in the composite. Information regarding the representative portfolio and the other accounts in the composite are available upon request. Statements in these materials should not be considered investment advice. References, either general or specific, to securities and/or issuers in the materials are for illustrative purposes only and are not intended to be, and should not be interpreted as, recommendation to purchase or sell such securities. Employees and/or clients of Western Asset may have a position in the securities or issuers mentioned.
These materials are not intended to provide, and should not be relied on for, accounting, legal, tax, investment or other advice. The recipient should consult its own counsel, accountant, investment, tax, and any other advisers for this advice, including economic risks and merits, related to making an investment with Western Asset. The recipient is responsible for observing the applicable laws and regulations of their country of residence.
Founded in 1971, Western Asset Management Company is a global fixed-income investment manager with offices in Pasadena, New York, London, Singapore, Tokyo, Melbourne, São Paulo, Hong Kong, and Zürich. Western Asset is a wholly owned subsidiary of Franklin Resources, Inc. but operates autonomously. Western Asset is comprised of six legal entities across the globe, each with distinct regional registrations: Western Asset Management Company, LLC, a registered Investment Adviser with the Securities and Exchange Commission; Western Asset Management Company Distribuidora de Títulos e Valores Mobiliários Limitada is authorized and regulated by Comissão de Valores Mobiliários and Brazilian Central Bank; Western Asset Management Company Pty Ltd ABN 41 117 767 923 is the holder of the Australian Financial Services License 303160; Western Asset Management Company Pte. Ltd. Co. Reg. No. 200007692R is a holder of a Capital Markets Services License for fund management and regulated by the Monetary Authority of Singapore; Western Asset Management Company Ltd, a registered Financial Instruments Business Operator and regulated by the Financial Services Agency of Japan; and Western Asset Management Company Limited is authorised and regulated by the Financial Conduct Authority ("FCA") (FRN 145930). This communication is intended for distribution to Professional Clients only if deemed to be a financial promotion in the UK as defined by the FCA. This communication may also be intended for certain EEA countries where Western Asset has been granted permission to do so. For the current list of the approved EEA countries please contact Western Asset at +44 (0)20 7422 3000.