

Executive Summary
- A credit cycle follows the direction of the broad economy and is generally considered to have four distinct phases: expansion, downturn, repair and recovery.
- We are currently in the expansion phase and Western Asset believes there is continued runway.
- There have been three credit cycle downturns in the past 30 years, and each was associated with either a Fed that tightened policy too much, a bursting market bubble or both.
- Currently, there is no apparent sector of the credit market that in order to avoid failure requires an increase in asset valuations or revenue streams to sustain business.
- Expansion phases are generally supportive of credit markets and underlying corporate bond valuations, however note that it is not the intent of this paper to opine on the relative attractiveness of any of the various credit asset classes.
- In our view, if investors run for cover now, they risk foregoing the incremental return which credit risk provides.
- This expansion phase will end one day but it won’t pass because of old age; there have to be catalysts and as of now, no trigger characteristic is in play nor do we see one on the near horizon.
In the timeless folktale Chicken Little, while tending to her garden an acorn drops on Henny Penny’s head and she declares, “Goodness gracious, the sky is falling!” As it turns out, the sky did not fall but that mattered little to the duck and goose who met with a tragic end after Henny led them to a hideout that turned out to be a foxhole. An alarmist can be well intentioned but when their warnings are not supported by substantial and meaningful evidence they run the risk of earning a reputation as a “Chicken Little.”
At various times over the past few years a number of fixed-income strategists, columnists and commentators have sounded the alarm about an imminent downturn in the credit cycle. The arguments for a turn in the credit cycle include slowing global economic growth, weakening fundamentals, poor market technicals, a belief that the current cycle had gone on too long, a breakdown in cross-asset correlations and risks associated with the Federal Reserve (Fed) normalizing interest rates while reversing quantitative easing. Many strategists believe that we are experiencing the last gasp of expansion. Western Asset disagrees with these statements today, just as it has disagreed with pundits who have been forecasting downturns for the past few years.
We appreciate that at some point such forecasts will be right and this credit cycle will end, but not likely in the next six to 12 months. In general credit fundamental conditions are solid and market technicals are supportive. In our view, reducing credit risk in a portfolio now due to fear of a looming cyclical downturn is not supported by the current environment and available data.
The purpose of this note is to discuss why we believe the sky is not going to fall any time soon and the key factors at play that provide the basis for our view that the current expansion phase of this credit cycle has continued runway. Before we discuss these factors, let’s take a look at what we mean when we describe a credit cycle, and also identify where we are today.
Analysis of a Credit Cycle
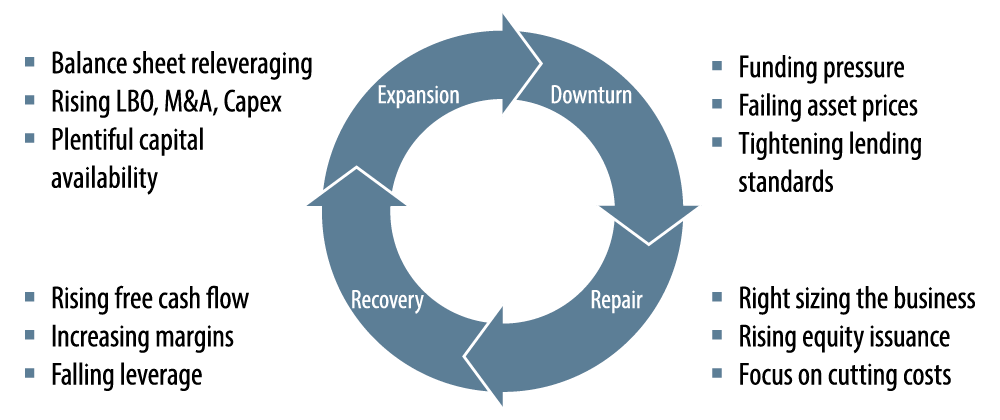
A credit cycle follows the direction of the broad economy and is generally considered to have four distinct phases: expansion, downturn, repair and recovery.
The expansion period is generally associated with relatively easy lending standards, availability of capital, increased borrowing and rising leverage metrics. A downturn starts when companies struggle to meet the resulting increased financial obligations due to stalled or negative growth. Lending standards tighten and borrowing costs rise. Available capital is reduced and is accessible only by top-tier entities. As liquidity diminishes, companies start to fail and default rates rise. The repair phase is noted when companies are able to stem the decline in fundamental credit conditions by adding liquidity and stabilizing their balance sheets. Liquidity is enhanced and leverage reduced by various measures including cost cutting, issuing equity and asset sales. As free cashflow starts to grow and margins increase, companies enter the recovery stage. Having navigated the cycle, companies remain cautious and maintain a focus on conservative balance sheet management until such time that solid and sustainable growth is achieved ushering in another expansion phase.
Phases of a Credit Cycle
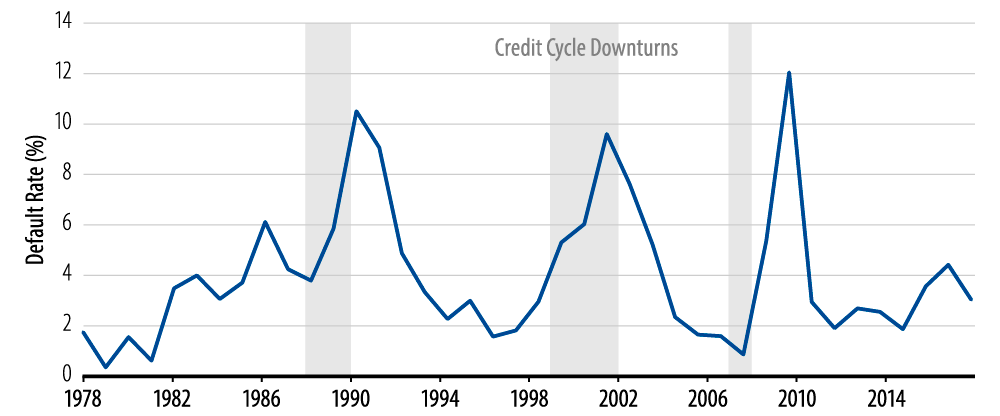
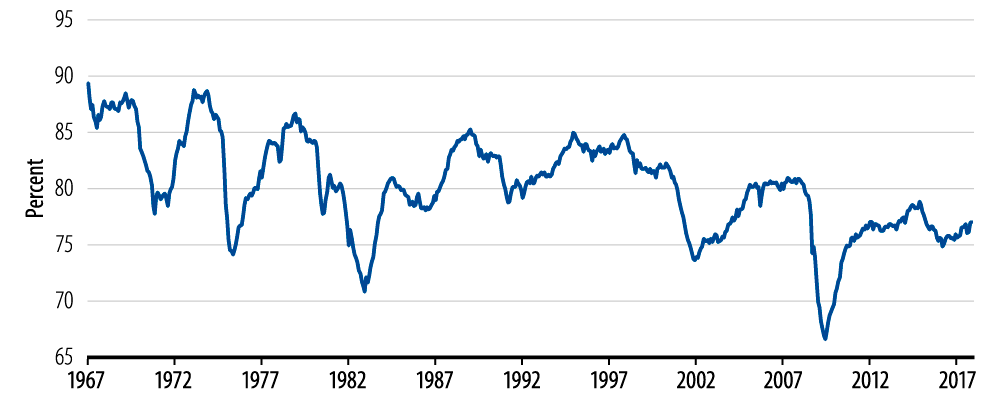
There have been three credit cycle downturns in the past 30 years: 1989-1990, 1999-2002 and 2007-2008. Each downturn was associated with either a Fed that tightened policy too much, a bursting market bubble or both. Each of these credit cycle downturns was closely accompanied by an economic downturn during which default rates rose sharply.
Speculative Default Rate
Although these factors are not necessarily the only catalysts that can trigger the next credit cycle downturn, it’s worth noting that they are not in place today. The Fed has begun to normalize interest rates and it is expected that it will be doing so gradually, as inflation has remained below the Fed’s official target. The Fed has warned that its rate normalization efforts will be “like watching paint dry.” This stands in contrast to the late 1980s and late 1990s when the Fed was battling inflation pressures and aggressively tightened to such a degree that it choked off economic growth, which precipitated recessions.
Currently, there is no apparent sector of the credit market that in order to avoid failure requires an increase in asset valuations or revenue streams to sustain business, as was the case with technology companies and the tech bubble in 2000, telecom companies and the telecom bubble in 2001, and homeowners and the housing bubble in 2008.
The housing bubble is often cited as the catalyst to the last credit downturn, the great financial crisis (GFC) of 2008. However, there’s a strong case to be made that the seeds of a downturn were planted years earlier. The Fed had begun raising rates in 2004, banks began to tighten lending standards aggressively in 2006 and by 2007 available capital had become scarce. By the time the housing bubble burst in 2008, corporate leverage ratios were already elevated and when credit market liquidity dried up corporate defaults skyrocketed. Repair began in 2009 as equity issuance soared, cost cuts were implemented and asset sales completed.
Equity Issuance

By 2010, the credit markets entered the recovery phase as leverage ratios peaked and began trending lower, and interest coverage had troughed and was headed higher. Since 2011 we have been in the expansion phase. Lending standards have eased, capital is plentiful, corporate borrowing has set new highs and leverage has risen. The National Bureau of Economic Research (NBER) reports that there have been 11 credit cycles since World War II with an average length of 69 months. The current run of 76 months in the expansion phase tops the average length of an entire cycle. Though the current expansion phase is long by historical standards, it is not unprecedented. From 1963 until the end of that decade (approximately 84 months), the US economy experienced its longest period of economic expansion fueled by huge productivity gains. Today, there are factors in place that we believe will provide a runway for the current expansion phase to continue.
We remain alert for warning signs that could portend a turn in the cycle and the beginning of a downturn. These signs include weakening earnings, elevated levels of M&A as well as highly leveraged LBO transactions, tightening lending standards, over-levered balance sheets and an aggressive Fed tightening policy. In our view, none of these indicators is flashing yellow at this time.
There are several reasons supporting our perspective that the current expansion phase of this credit cycle has not yet run its course, including 1) changed corporate treasury behavior, 2) an unusually low economic growth rate during an expansion phase, and 3) legislative and regulatory changes.
1. Changed Corporate Treasury Behavior
Many companies failed during the GFC because the capital markets had seized up. At the time, cashflow supported expenses but paying off a large maturity was a different matter. Corporations with debt obligations coming due historically waited between one and three months (before their existing debt matured) to refinance. To avoid the possibility of a systemic issue impacting an issuer’s ability to refinance, companies en masse have changed their behavior and now look to refinance debt obligations that mature as far as two and three years out.
Companies Have Aggressively Moved Out Their Maturity Schedule
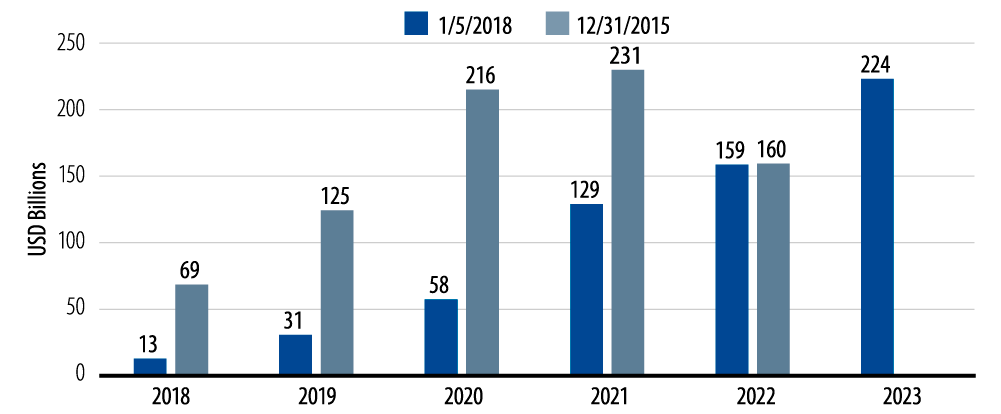
For example, in December 2015 the loan market had $194 billion in maturities coming due in 2018 and 2019. As of January 5, 2018, that amount had shrunk to $44 billion, approximately an 80% decrease in debt maturing obligations due within the next two-plus years. High-yield bond issuers have demonstrated a similar change in behavior. Refinancing early eliminates the risk that credit markets will be closed in the month a deal matures and extends the runway of an issuer’s debt obligations. This behavior should have the effect of limiting corporate failures which in turn should help extend the expansion phase.
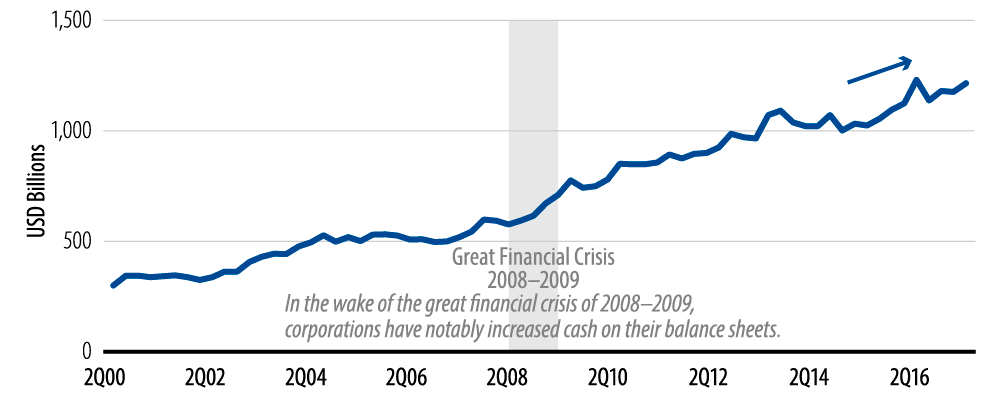
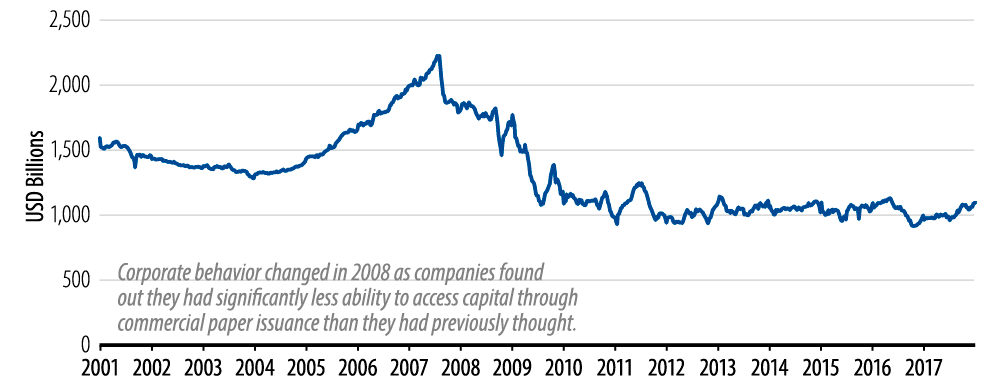
Right now corporations are utilizing a higher level of liquidity than seen before the crisis. In the wake of the GFC, corporations have notably increased cash on their balance sheets. Corporations remember how fickle the commercial paper (CP) market became as the crisis unfolded. Companies that believed they had sufficient liquidity because of their ability to access the CP market found out in 2008 that in fact they had significantly less ability to access capital through CP issuance than they thought. Corporate behavior thus changed. The result has been a significant reduction in the issuance of CP and a comparable increase in actual cash on the balance sheet. This reduction in CP availability also reduces risk that a market disruption could negatively impact business operations. Having cash on hand greatly improves the liquidity profile of the broad corporate market, enhances its ability to withstand periods of brief market disorder and thereby helps extend the expansion phase.
Corporations Are Holding an Elevated Level of Cash
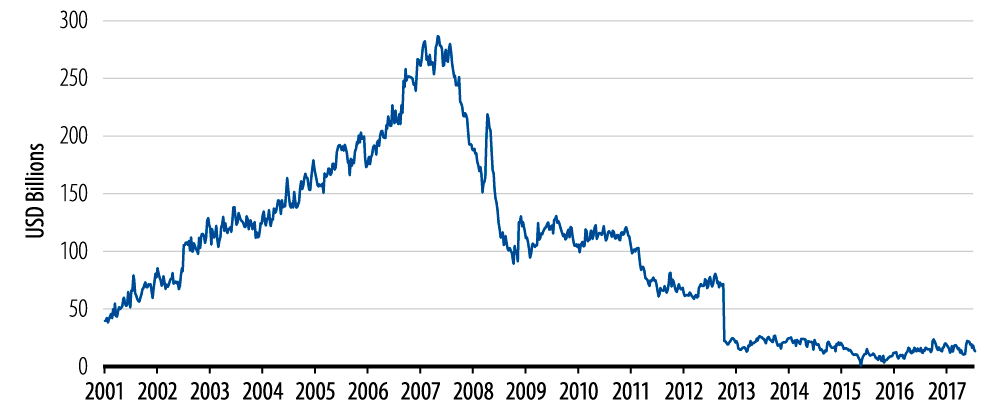
Amount of Commercial Paper Outstanding
2. Low Growth Rate
Calendar Year Growth in Real GDP
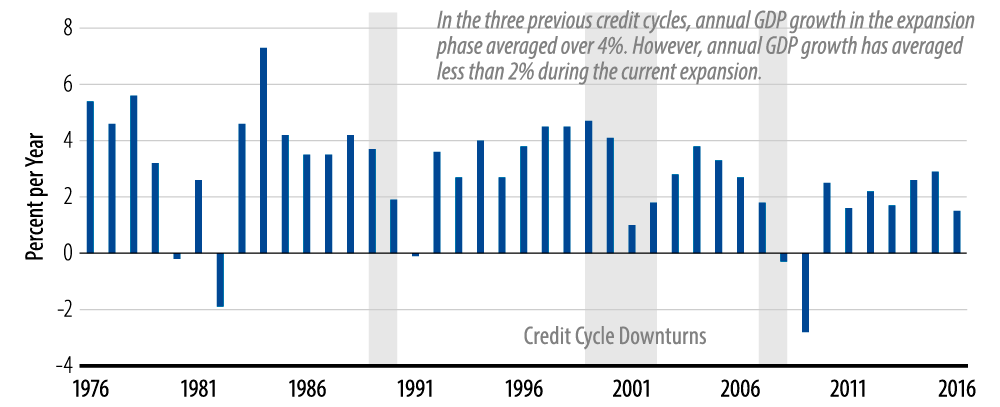
In the three previous credit cycles annual GDP growth in the expansion phase averaged over 4%. However, annual GDP growth has averaged approximately half that during the current expansion (Exhibit 7). A contributing factor to the low-growth environment of the past seven years has been corporations’ reluctance to invest back into their businesses. Capital expenditures (capex) data measured by fixed business spending as a percentage of GDP show that corporate expenditures are well below those of previous expansion periods. It appears that businesses have chosen to sacrifice a level of growth for maintaining an elevated level of liquidity. From 1980 to 2007 the average annualized quarterly capex reading was 13.0%. Since then the reading has averaged 12.3% with the most recent data point, 3Q17 reported at 12.6%, below the long-term average and well below the readings recorded at the end of a number of previous expansion phases.
Capital expenditures are an investment. Investment influences the rate of economic growth. To the extent that there is spare capacity, increased investment will boost the rate of economic growth. During previous expansion phases capacity utilization averaged well above 80%. In this expansion phase the rate has been well below that, averaging approximately 75%. As the extra slack in capacity is absorbed it’s likely that companies will look to increasingly reinvest back into their businesses in the form of buying new equipment, building larger factories and investing in research and development. While companies have remained cautious, which has resulted in economic growth well below that of other expansion periods, an increase in investment down the road could be a source of future growth helping to further sustain the current expansion.
CapEx Spending as a Percent of GDP
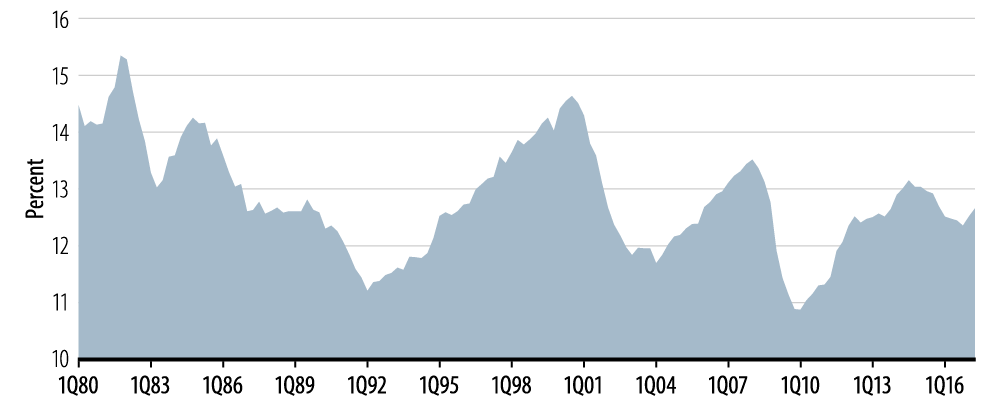
Capacity Utilization
3. Legislative and Regulatory Changes
In the wake of the GFC, significant legislative and regulatory changes have been ratified and implemented with regard to the operations of the financial system. These changes address the issue of leverage and overall business risk across the banking industry. From a legislative perspective, Congress passed the Dodd-Frank Act which clamped down on higher-risk banking activities including proprietary trading and investments in hedge funds. From a regulatory perspective, Basel III was adopted which included strict capital and liquidity standards. The new capital requirements mandated that banks maintain a higher amount of common equity, which has the effect of limiting banking leverage. Liquidity requirements were enhanced as well. Since implementation of the Volcker Rule in July 2010 and as Basel III is phased in, daily corporate bond inventories across the banking industry have plummeted as the cost to inventory a high level of risk assets has become uneconomic.
Dealer Corporate Bond Inventory
A financial system that caps the allowable level of leverage for banks and requires plentiful liquid assets may dampen their ability to generate profits but it also provides much-improved protection for when a downturn occurs. A healthy banking system should have the effect of helping to sustain the economic expansion which in turn should provide further runway to the credit cycle expansion phase.
Conservative Expansion Continues
In our opinion the current credit expansion phase is generally in solid condition. Corporations have managed their balance sheets conservatively since emerging from the GFC and we don’t see signs that they will change direction in the near future. While the broad expansion cycle remains intact, certain industries moved into the downturn phase at various times over the past few years. The commodity sector did so in 2014, retail in 2015 and the wireline industry in 2017. However, downturns in these areas were specific to their underlying businesses or business practices. Fracking technology greatly enhanced the ability of exploration and production companies to extract a greater amount of crude oil, upsetting the supply/demand dynamic. Shoppers now make over 50% of their purchases online according to Fortune magazine, threatening the business model of brick and mortar retailers. Wireline companies favored equity owners with large cash distributions over the past few years—a strategy that looms disastrously as they’ve lost market share to cable companies while struggling to meet their elevated debt obligations. These industries face risks that are unique and do not threaten the broad economy. In addition, they may stand to benefit when the overall credit cycle does move into a downturn as they will be better prepared having already experienced their own. But for now and for at least well into 2018, we expect the broad expansion cycle to continue.
Probably the greatest risk to the expansion phase centers on how the Fed navigates normalizing short-term rates and the quantitative easing unwind. With inflation below the Fed’s stated target and economic growth below that of previous expansion phases, we believe there’s low probability of a Fed policy mistake that could strangle the expansion within the next 12 months. Should inflation move materially above the Fed’s 2.0% target and economic growth rises considerably above the anemic level of the post-GFC era, we would revisit our view. But as of now we are satisfied that Fed policy presents little risk to the expansion cycle remaining on track.
Expansion phases are generally supportive of credit markets and underlying corporate bond valuations. It is not the intent of this paper to opine on the relative attractiveness of any of the various credit asset classes. However, we also want to be clear that because we believe the expansion phase has continued runway that should not be taken as an indication that we expect valuations to continue to tighten. That discussion is beyond the scope of this report. Though expansion phases are generally associated with tightening credit spreads, we note that there have been periods during expansion phases in which spreads experienced periods of temporary widening.
Ultimately, we at Western Asset believe that the forces listed here are the key components providing further runway for the expansion cycle. In our view, the sky is not falling and to run for cover now may mean that investors risk foregoing the incremental return which credit risk provides. This expansion phase will end one day but it won’t pass because of old age. There have to be catalysts and as of now no trigger characteristic is in play nor do we see one on the near horizon.